| Param | Original file | Final file |
|---|---|---|
| Filename | modeM0/AS1G06_168T23_9000000706_05518cztM0_level2.evt | modeM0/AS1G06_168T23_9000000706_05518cztM0_level2_quad_clean.evt |
| Size (bytes) | 560,911,680 | 74,652,480 |
| Size | 534.9 MB | 71.2 MB |
| Events in quadrant A | 3,490,370 | 451,032 |
| Events in quadrant B | 4,164,965 | 437,991 |
| Events in quadrant C | 4,666,611 | 423,698 |
| Events in quadrant D | 4,156,262 | 425,241 |
| Mode M0 | |||
|---|---|---|---|
| Quadrant | BADHDUFLAG | Total packets | Discarded packets |
| A | 0 | 15672 | 3 |
| B | 0 | 17433 | 2 |
| C | 0 | 19123 | 2 |
| D | 0 | 17564 | 2 |
| Mode M9 | |||
|---|---|---|---|
| Quadrant | BADHDUFLAG | Total packets | Discarded packets |
| A | 0 | 10 | 0 |
| B | 0 | 10 | 0 |
| C | 0 | 10 | 0 |
| D | 0 | 11 | 0 |
| Mode SS | |||
|---|---|---|---|
| Quadrant | BADHDUFLAG | Total packets | Discarded packets |
| A | 0 | 154 | 0 |
| B | 0 | 154 | 0 |
| C | 0 | 154 | 0 |
| D | 0 | 154 | 0 |
| Quadrant | Total seconds | Saturated seconds | Saturation percentage |
|---|---|---|---|
| A | 7499 | 94 | 1.253500% |
| B | 7499 | 201 | 2.680357% |
| C | 7499 | 304 | 4.053874% |
| D | 7499 | 85 | 1.133484% |
Noise dominated data is calculated using 1-second bins in cleaned event files. If a bin has >2000 counts, and if more than 50% of those come from <1% of pixels, then it is considered to be noise-dominated and hence unusable.
| Quadrant | # 1 sec bins | Bins with >0 counts | Bins with >2000 counts | High rate bins dominated by noise | Noise dominated (total time) | Noise dominated (detector-on time) | Marked lightcurve |
|---|---|---|---|---|---|---|---|
| A | 7904 | 7502 | 11 | 11 | 0.14% | 0.15% | 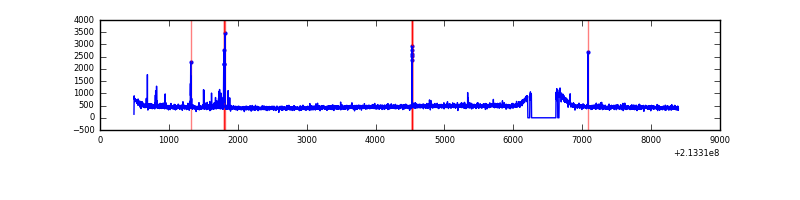 |
| B | 7904 | 7502 | 55 | 55 | 0.70% | 0.73% | 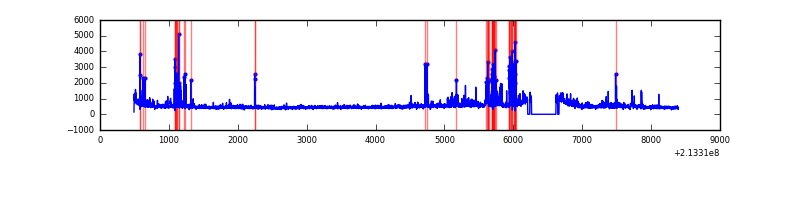 |
| C | 7904 | 7501 | 137 | 137 | 1.73% | 1.83% | 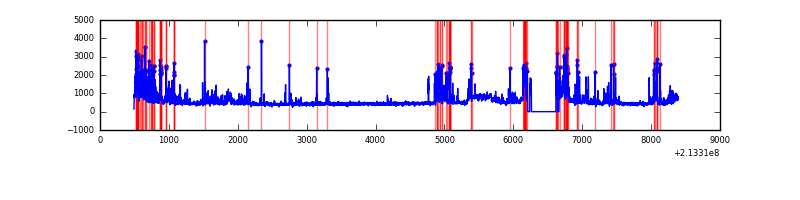 |
| D | 7904 | 7502 | 30 | 30 | 0.38% | 0.40% | 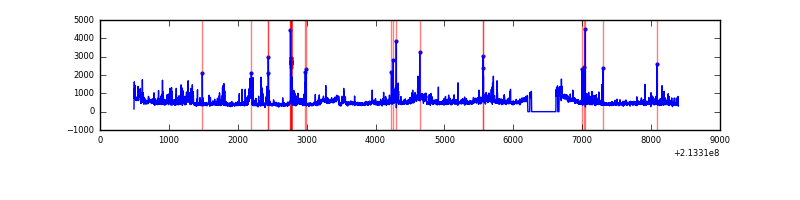 |
Top three noisy pixels from each quadrant. If the there are fewer than three noisy pixels in the level2.evt file, extra rows are filled as -1
| Pixel properties | Quadrant properties | ||||||
|---|---|---|---|---|---|---|---|
| Quadrant | DetID | PixID | Counts | Sigma | Mean | Median | Sigma |
| A | 15 | 174 | 62350 | 343.0 | 873 | 851 | 179.3 |
| A | 0 | 50 | 28880 | 156.33 | 873 | 851 | 179.3 |
| A | 7 | 16 | 23490 | 126.26 | 873 | 851 | 179.3 |
| B | 10 | 16 | 272505 | 1588.39 | 879 | 857 | 171.0 |
| B | 15 | 204 | 215771 | 1256.65 | 879 | 857 | 171.0 |
| B | 7 | 221 | 46310 | 265.77 | 879 | 857 | 171.0 |
| C | 9 | 247 | 1190426 | 6051.28 | 836 | 839 | 196.6 |
| C | 1 | 16 | 167931 | 849.98 | 836 | 839 | 196.6 |
| C | 14 | 67 | 18826 | 91.5 | 836 | 839 | 196.6 |
| D | 9 | 85 | 252950 | 1199.99 | 847 | 819 | 210.1 |
| D | 2 | 152 | 211394 | 1002.21 | 847 | 819 | 210.1 |
| D | 2 | 63 | 124245 | 587.43 | 847 | 819 | 210.1 |
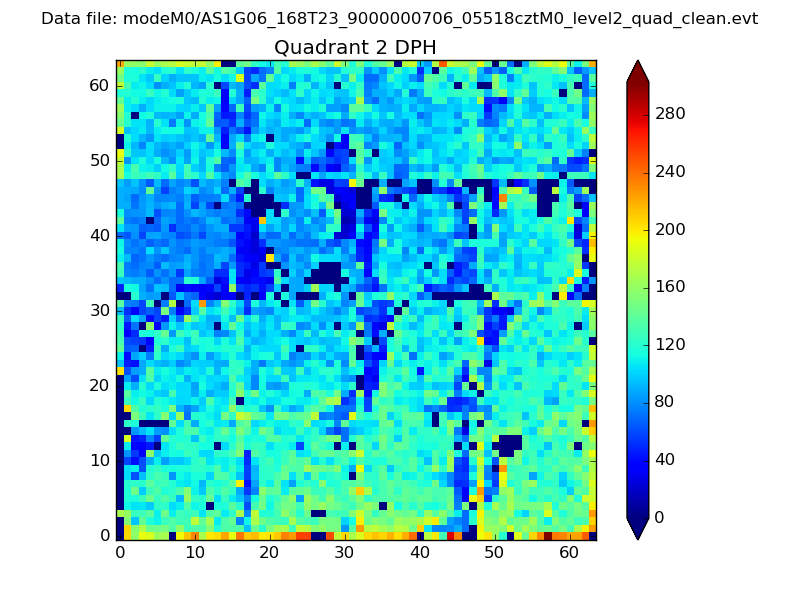
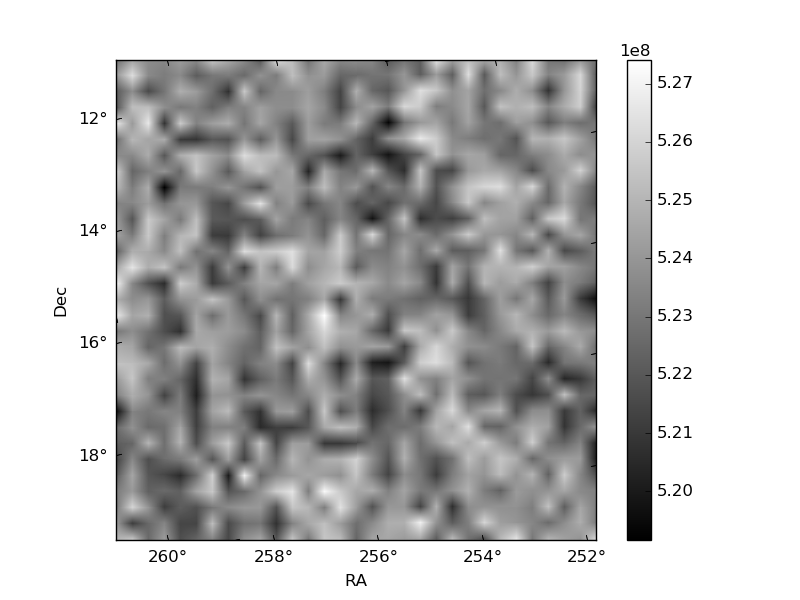
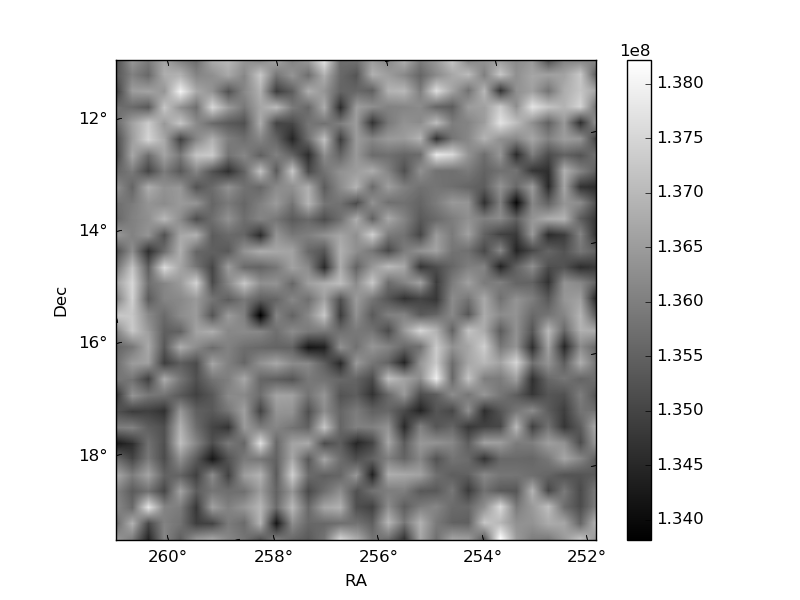
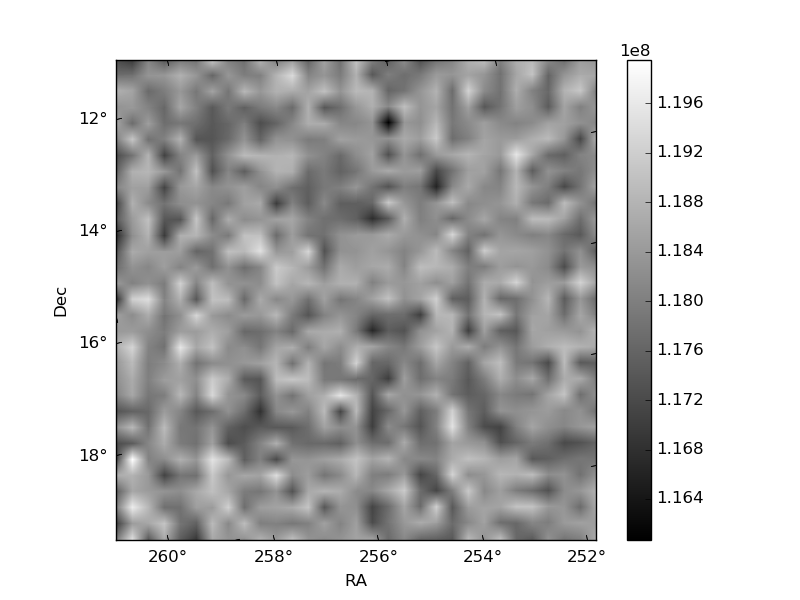
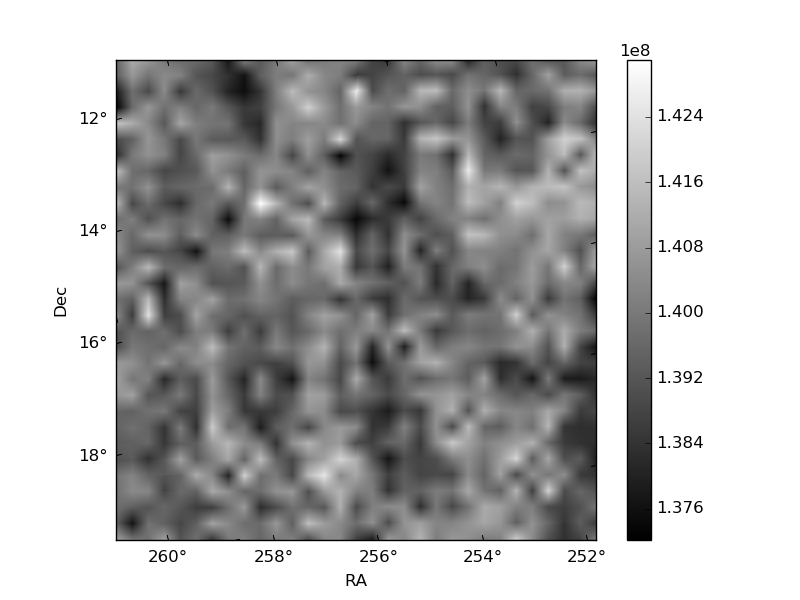
Histogram calculated using DETX and DETY for each event in the final _common_clean file
| Quadrant A | 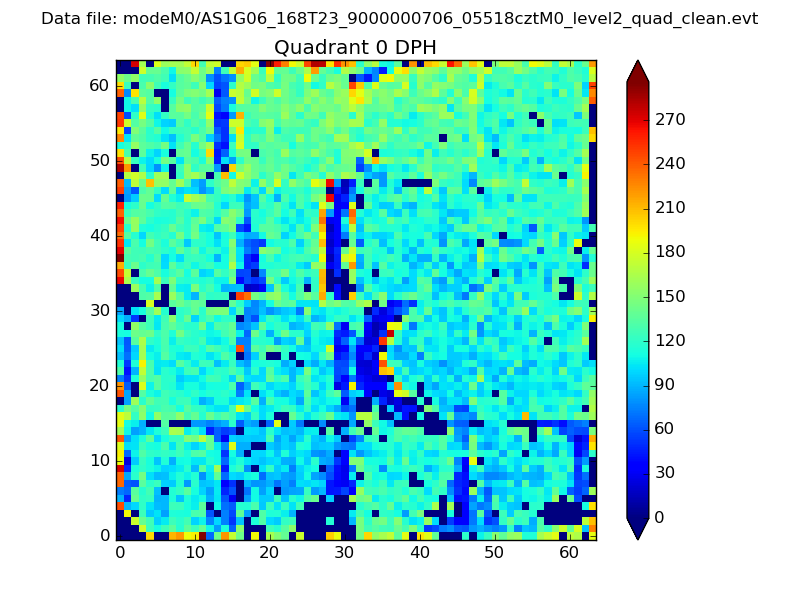 |
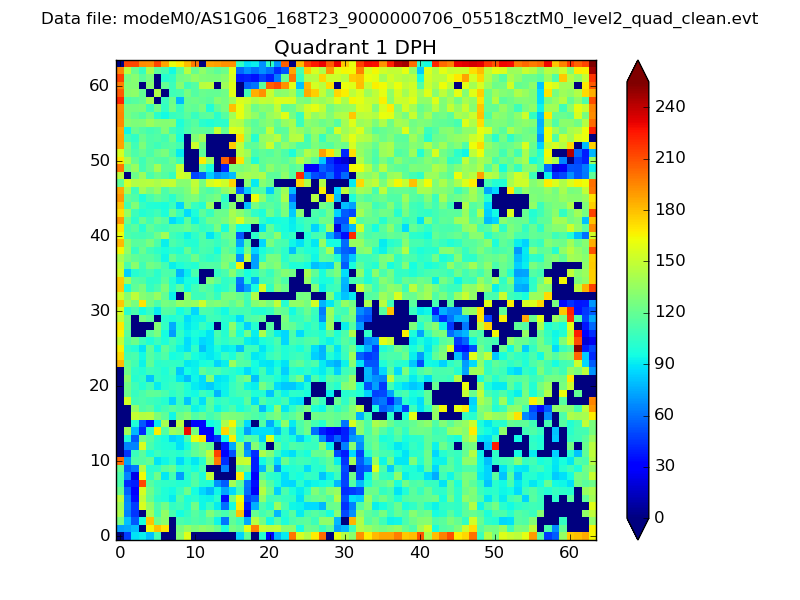 |
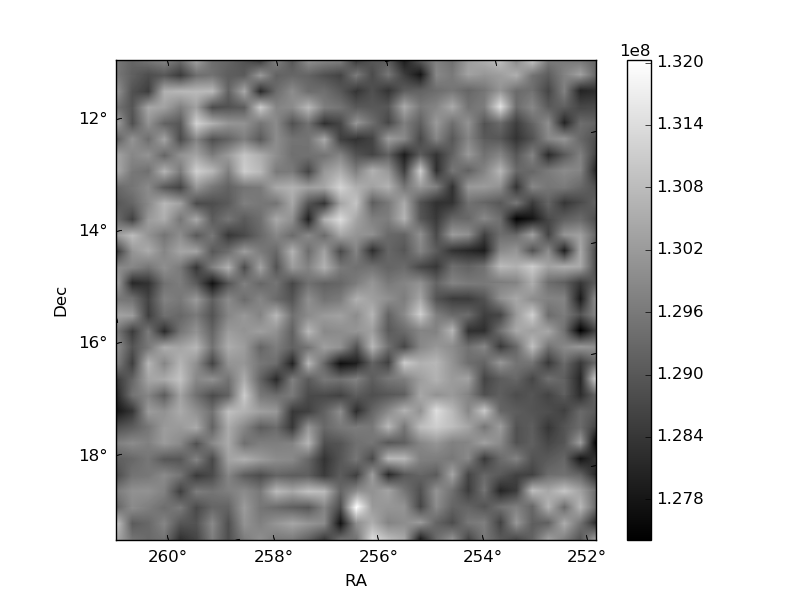
Quadrant B |
|---|---|---|---|
| Quadrant D | 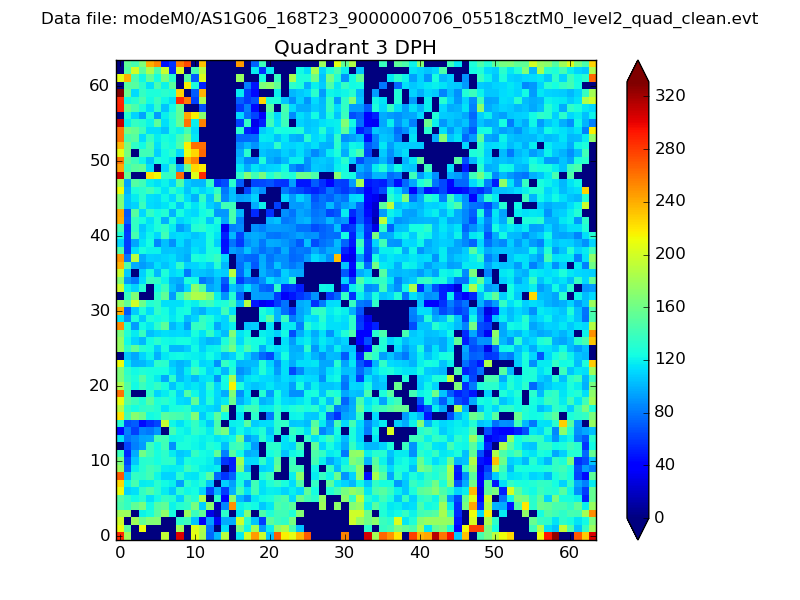 |
 |
Quadrant C |
| Plot type | Count rate plots | Images |
|---|---|---|
| Comparison with Poisson distribution Blue bars denote a histogram of data divided into 1 sec bins. Red curve is a Poisson curve with rate = median count rate of data. |
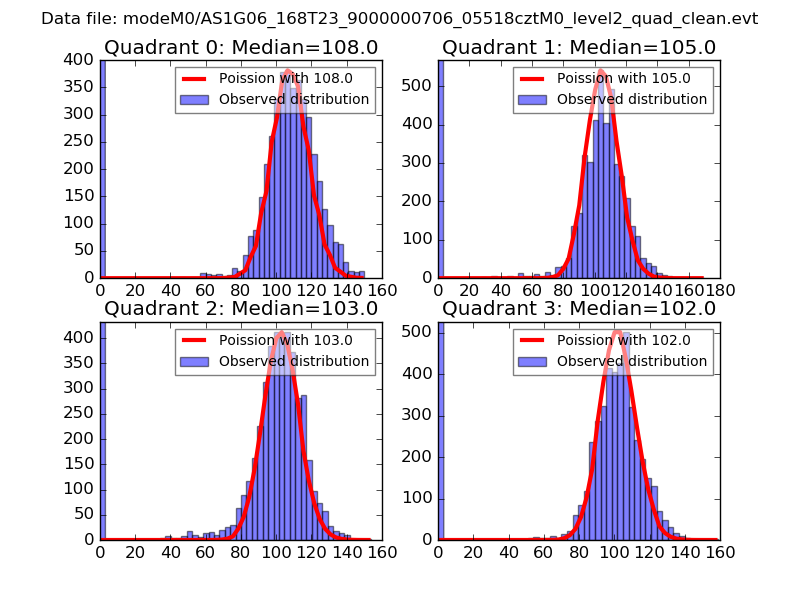 |
 |
| Quadrant-wise count rates Data is divided into 100 sec bins |
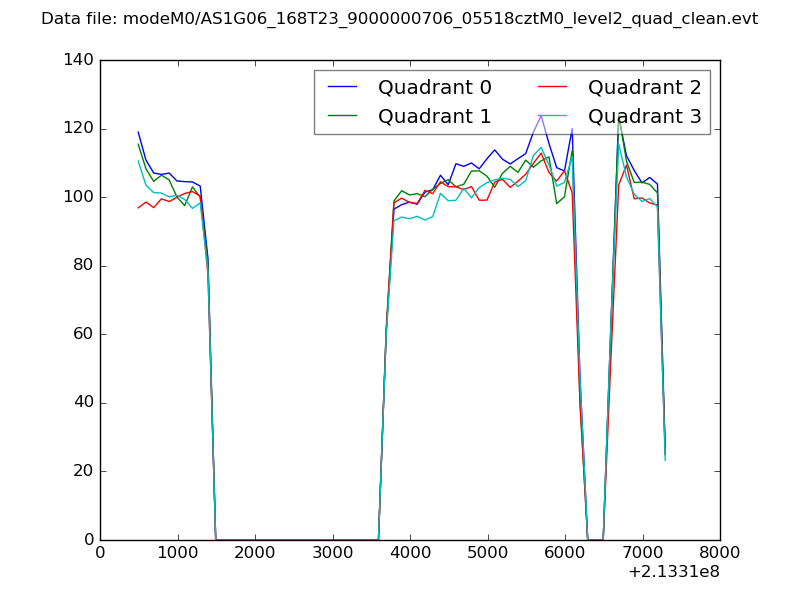 |
|
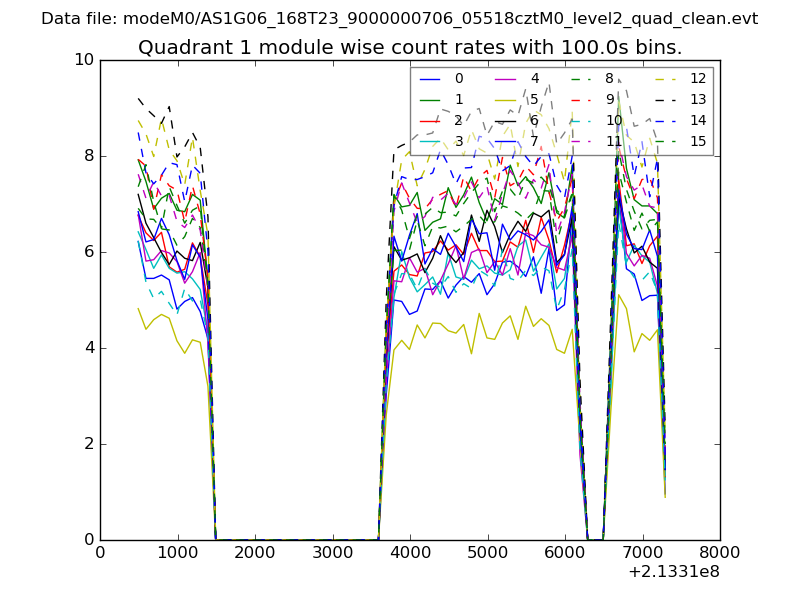
| Module-wise count rates for Quadrant A Data is divided into 100 sec bins |
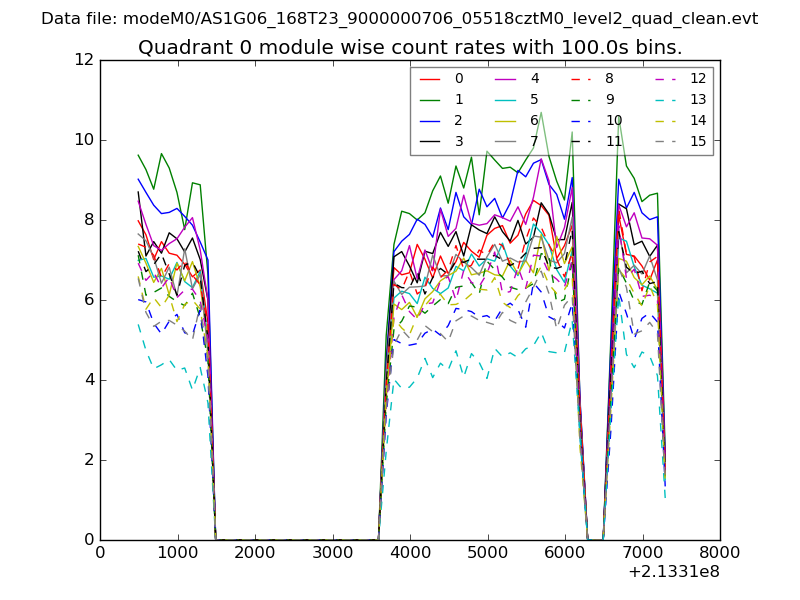 |
 |
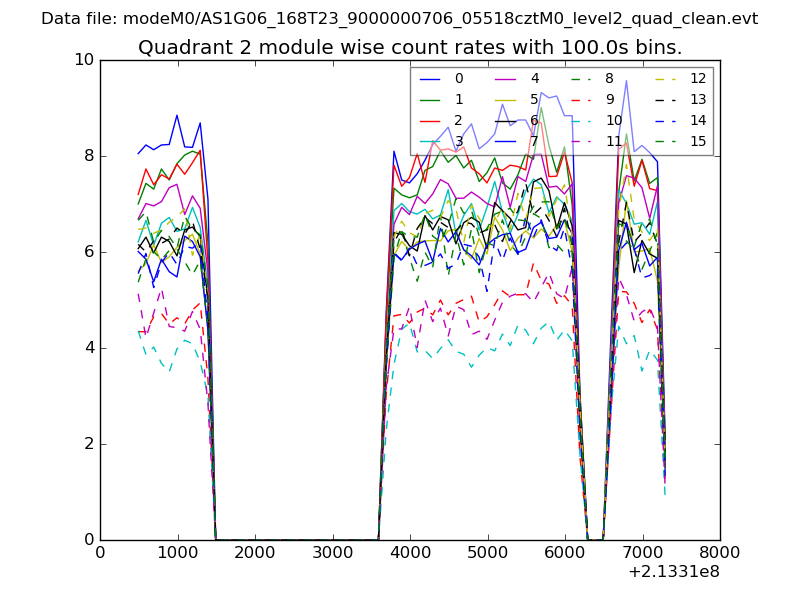
| Module-wise count rates for Quadrant B Data is divided into 100 sec bins |
 |
 |
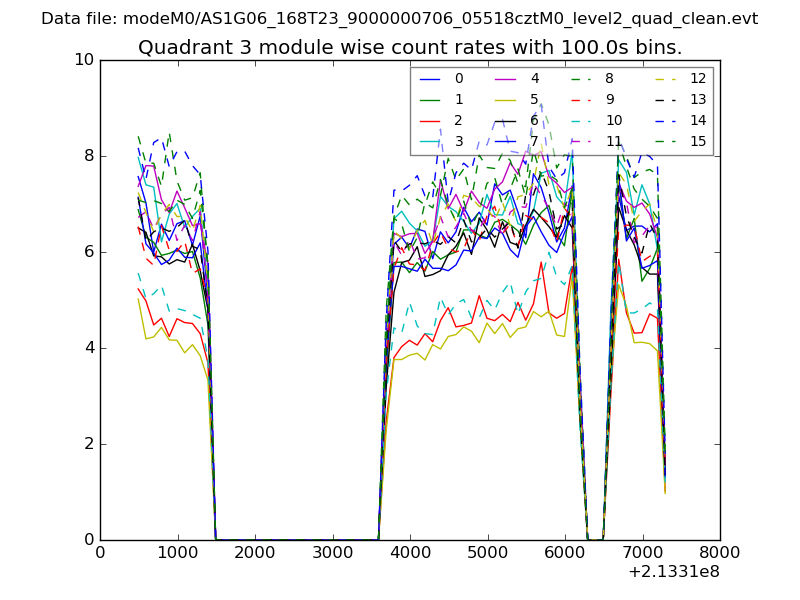
| Module-wise count rates for Quadrant C Data is divided into 100 sec bins |
 |
 |
| Module-wise count rates for Quadrant D Data is divided into 100 sec bins |
 |
 |
| Parameter | Plot |
|---|---|
| CZT HV Monitor | 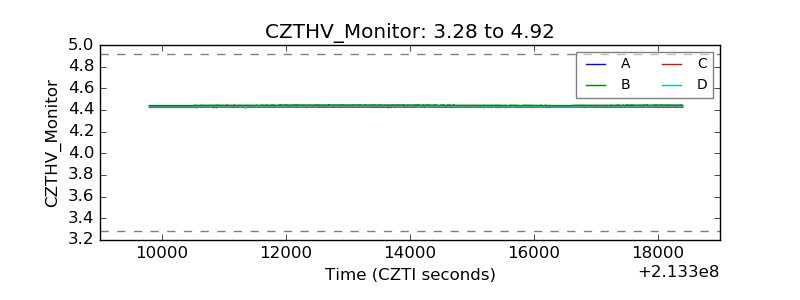 |
| D_VDD | 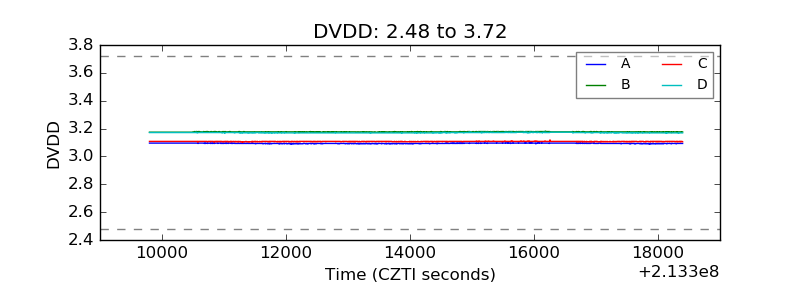 |
| Temperature 1 | 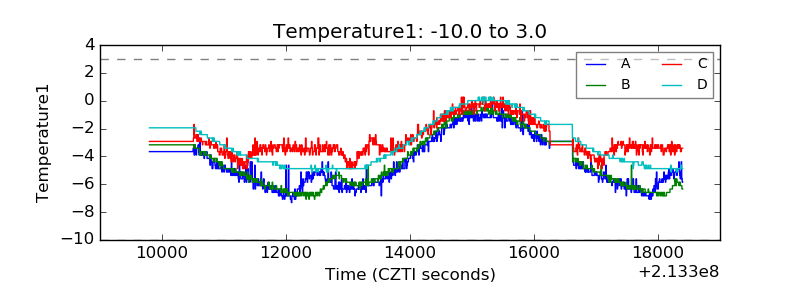 |
| Veto HV Monitor | 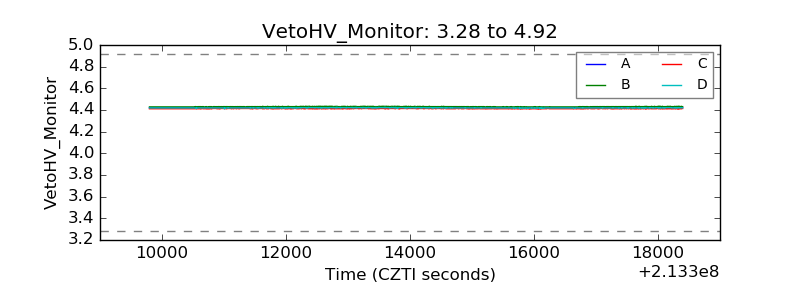 |
| Veto LLD | 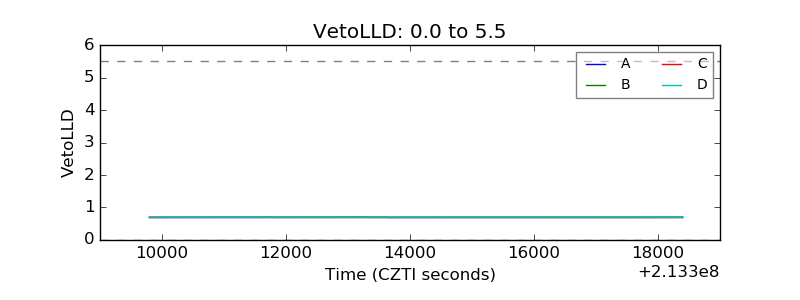 |
| Alpha Counter | 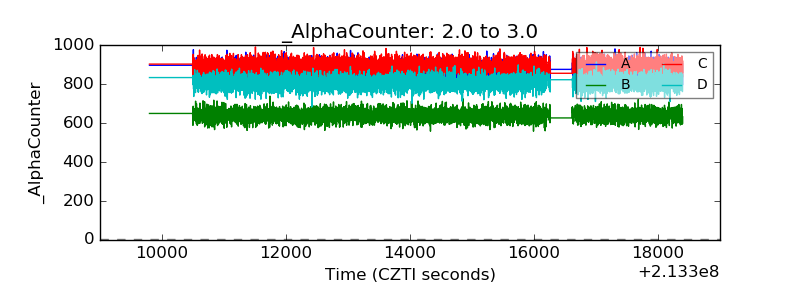 |
| _CPM_Rate | 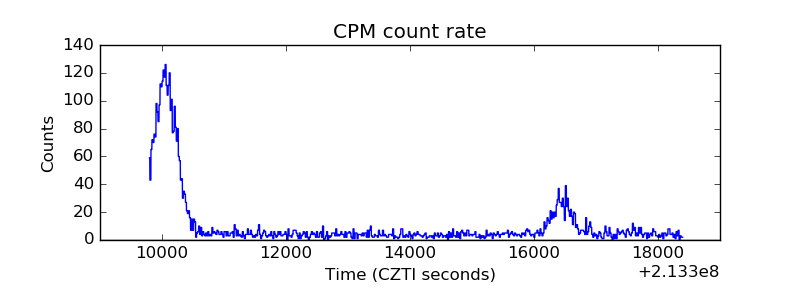 |
| CZT Counter | 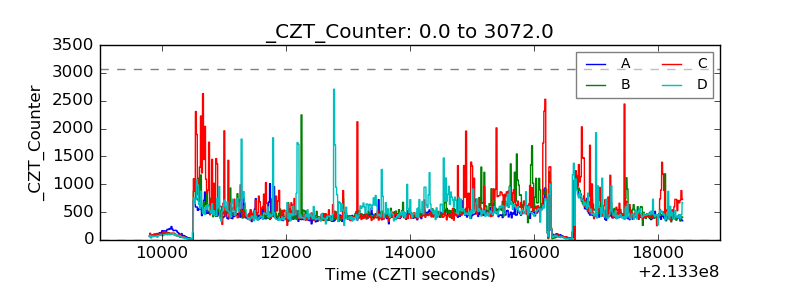 |
| +2.5 Volts monitor |  |
| +5 Volts monitor |  |
| _ROLL_ROT | 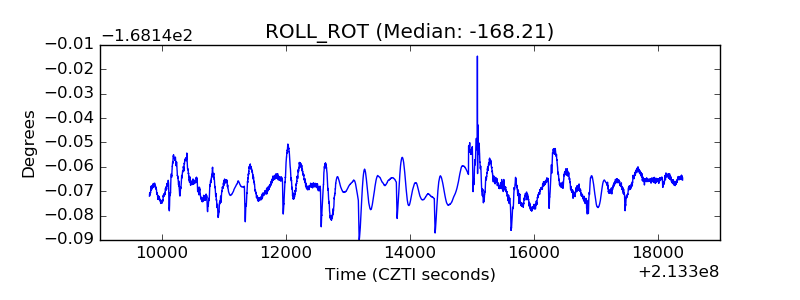 |
| _Roll_DEC | 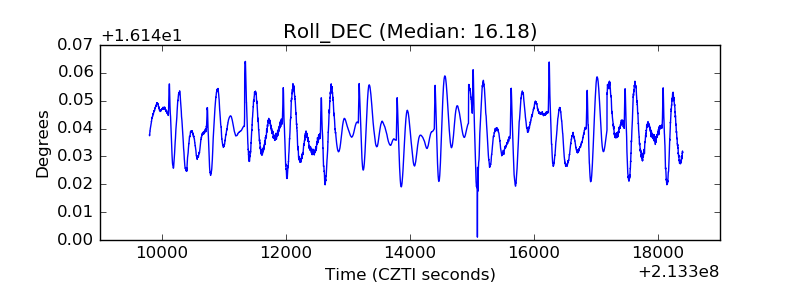 |
| _Roll_RA | 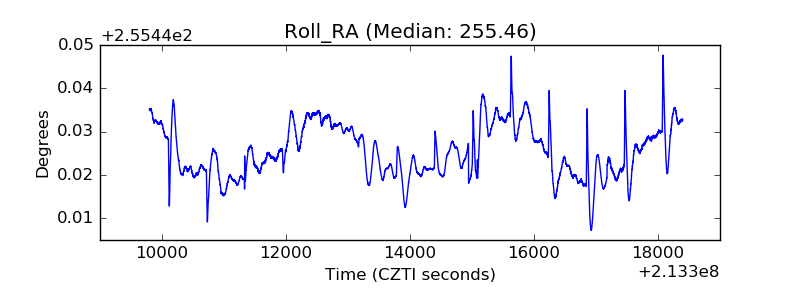 |
| Veto Counter | 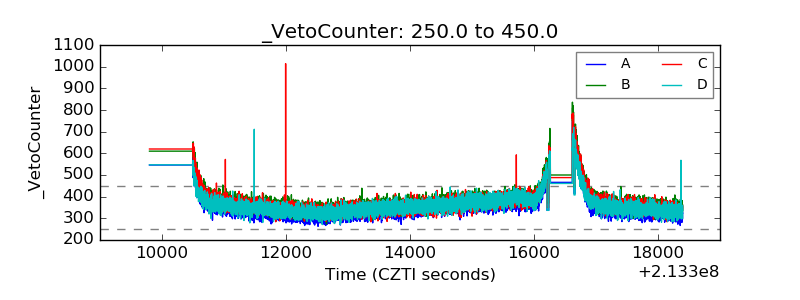 |