| Param | Original file | Final file |
|---|---|---|
| Filename | modeM0/AS1G06_168T23_9000000706_05519cztM0_level2.evt | modeM0/AS1G06_168T23_9000000706_05519cztM0_level2_quad_clean.evt |
| Size (bytes) | 607,700,160 | 77,618,880 |
| Size | 579.5 MB | 74.0 MB |
| Events in quadrant A | 3,762,621 | 464,970 |
| Events in quadrant B | 4,522,134 | 451,977 |
| Events in quadrant C | 5,345,903 | 435,915 |
| Events in quadrant D | 4,230,816 | 440,857 |
| Mode M0 | |||
|---|---|---|---|
| Quadrant | BADHDUFLAG | Total packets | Discarded packets |
| A | 0 | 16837 | 3 |
| B | 0 | 18819 | 2 |
| C | 0 | 21351 | 2 |
| D | 0 | 18173 | 2 |
| Mode M9 | |||
|---|---|---|---|
| Quadrant | BADHDUFLAG | Total packets | Discarded packets |
| A | 0 | 6 | 0 |
| B | 0 | 6 | 0 |
| C | 0 | 6 | 0 |
| D | 0 | 6 | 0 |
| Mode SS | |||
|---|---|---|---|
| Quadrant | BADHDUFLAG | Total packets | Discarded packets |
| A | 0 | 164 | 0 |
| B | 0 | 164 | 0 |
| C | 0 | 164 | 0 |
| D | 0 | 164 | 0 |
| Quadrant | Total seconds | Saturated seconds | Saturation percentage |
|---|---|---|---|
| A | 8002 | 169 | 2.111972% |
| B | 8002 | 318 | 3.974006% |
| C | 8002 | 433 | 5.411147% |
| D | 8002 | 221 | 2.761810% |
Noise dominated data is calculated using 1-second bins in cleaned event files. If a bin has >2000 counts, and if more than 50% of those come from <1% of pixels, then it is considered to be noise-dominated and hence unusable.
| Quadrant | # 1 sec bins | Bins with >0 counts | Bins with >2000 counts | High rate bins dominated by noise | Noise dominated (total time) | Noise dominated (detector-on time) | Marked lightcurve |
|---|---|---|---|---|---|---|---|
| A | 8592 | 8006 | 2 | 2 | 0.02% | 0.02% | 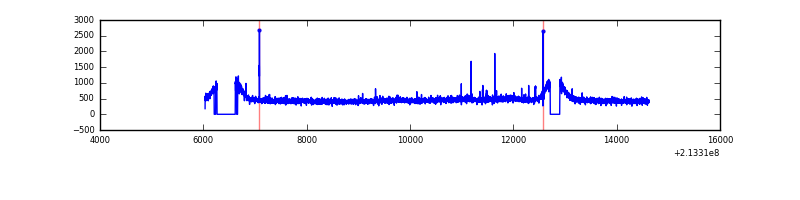 |
| B | 8592 | 8006 | 34 | 34 | 0.40% | 0.42% | 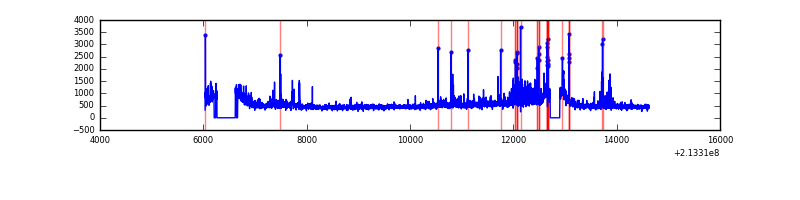 |
| C | 8592 | 8005 | 205 | 205 | 2.39% | 2.56% | 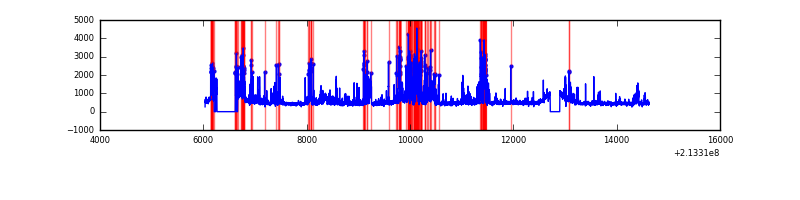 |
| D | 8592 | 8006 | 125 | 125 | 1.45% | 1.56% | 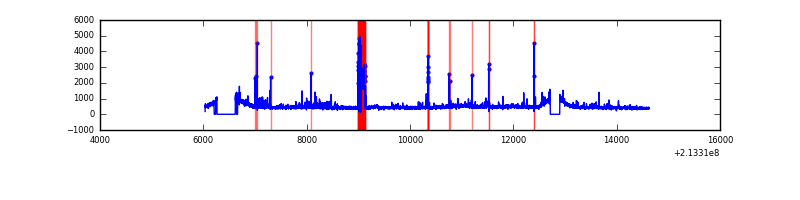 |
Top three noisy pixels from each quadrant. If the there are fewer than three noisy pixels in the level2.evt file, extra rows are filled as -1
| Pixel properties | Quadrant properties | ||||||
|---|---|---|---|---|---|---|---|
| Quadrant | DetID | PixID | Counts | Sigma | Mean | Median | Sigma |
| A | 15 | 174 | 19553 | 93.82 | 962 | 940 | 198.4 |
| A | 0 | 50 | 15437 | 73.07 | 962 | 940 | 198.4 |
| A | 0 | 226 | 9666 | 43.98 | 962 | 940 | 198.4 |
| B | 15 | 204 | 336339 | 1776.02 | 964 | 942 | 188.8 |
| B | 10 | 16 | 149304 | 785.62 | 964 | 942 | 188.8 |
| B | 11 | 51 | 62603 | 326.51 | 964 | 942 | 188.8 |
| C | 9 | 247 | 1684091 | 7774.15 | 919 | 925 | 216.5 |
| C | 1 | 16 | 31452 | 141.0 | 919 | 925 | 216.5 |
| C | 1 | 241 | 28820 | 128.84 | 919 | 925 | 216.5 |
| D | 2 | 33 | 346039 | 1500.42 | 924 | 892 | 230.0 |
| D | 2 | 152 | 165574 | 715.9 | 924 | 892 | 230.0 |
| D | 2 | 63 | 68740 | 294.95 | 924 | 892 | 230.0 |
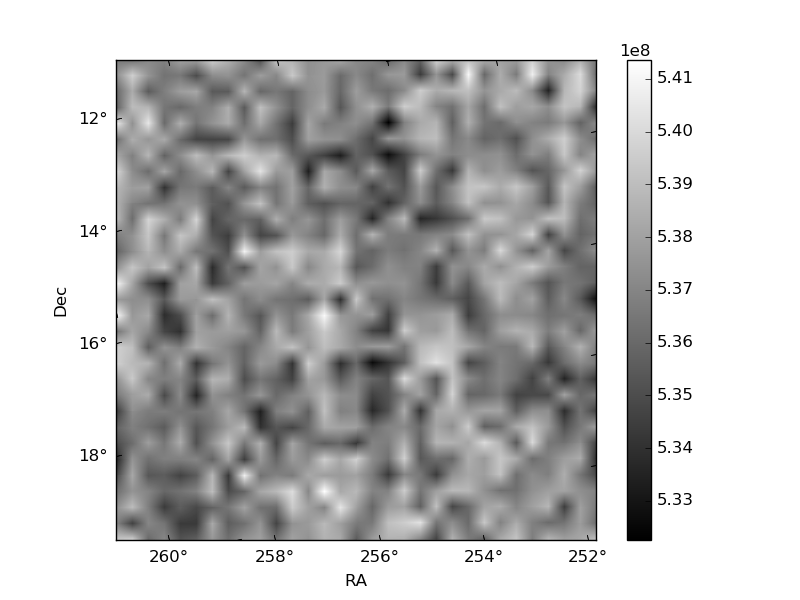
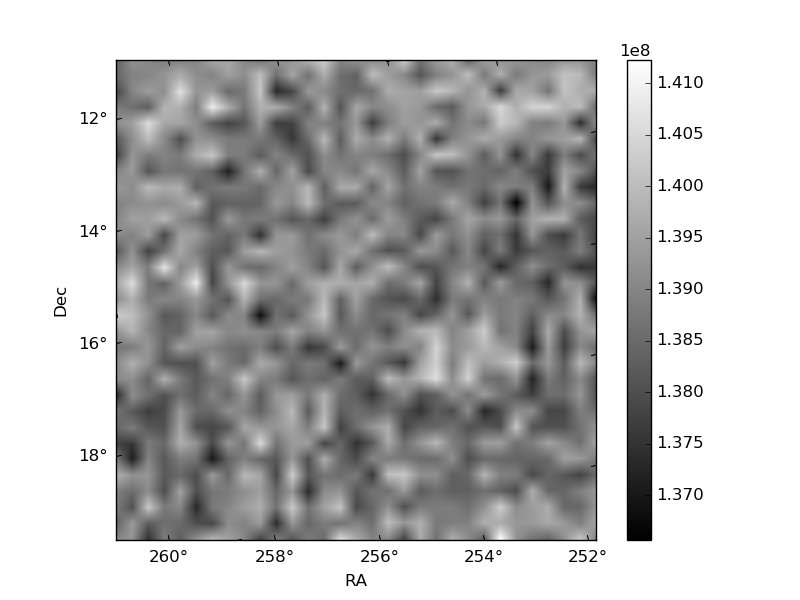
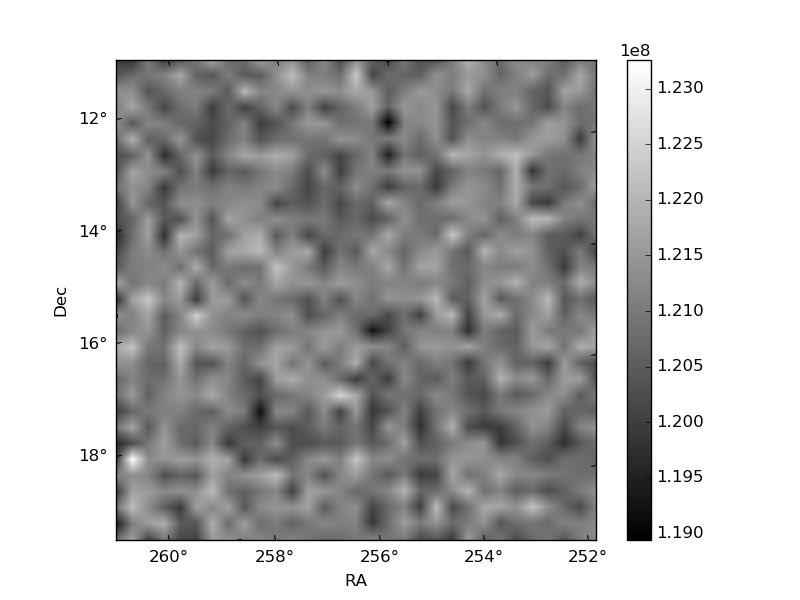
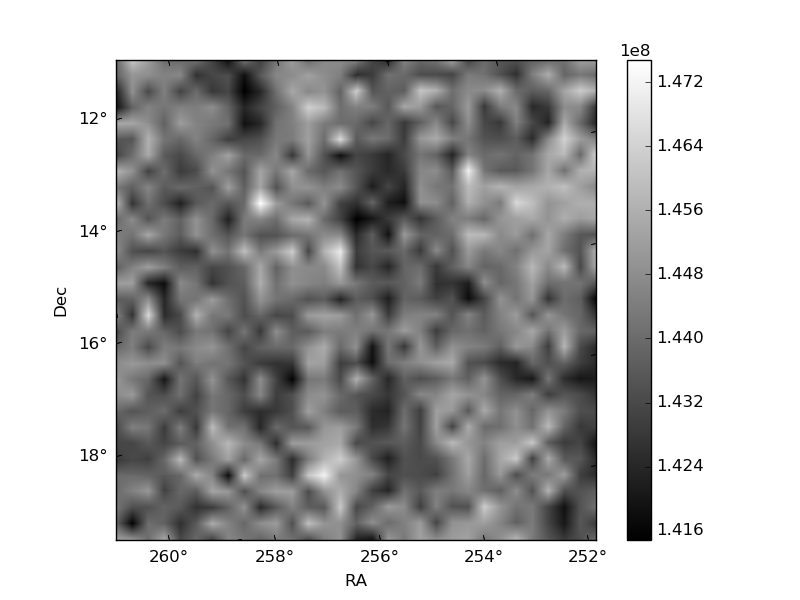
Histogram calculated using DETX and DETY for each event in the final _common_clean file
| Quadrant A | 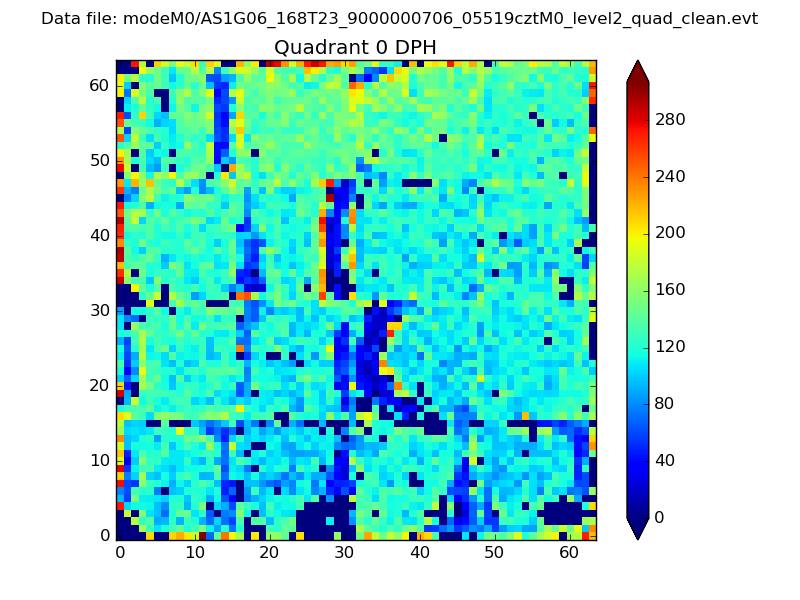 |
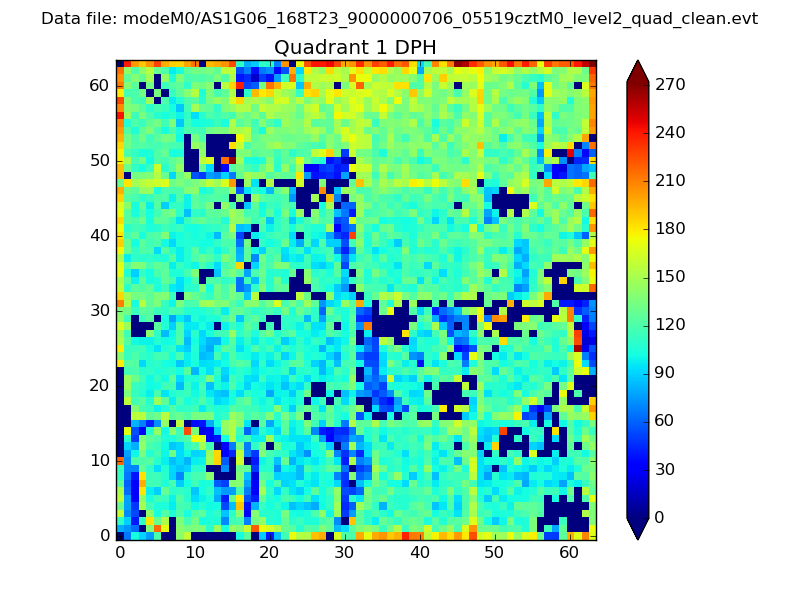 |
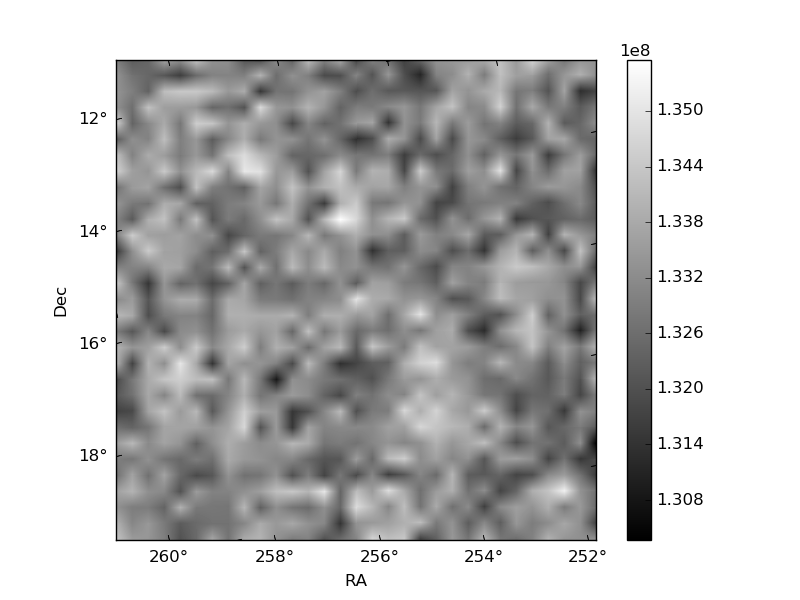
Quadrant B |
|---|---|---|---|
| Quadrant D | 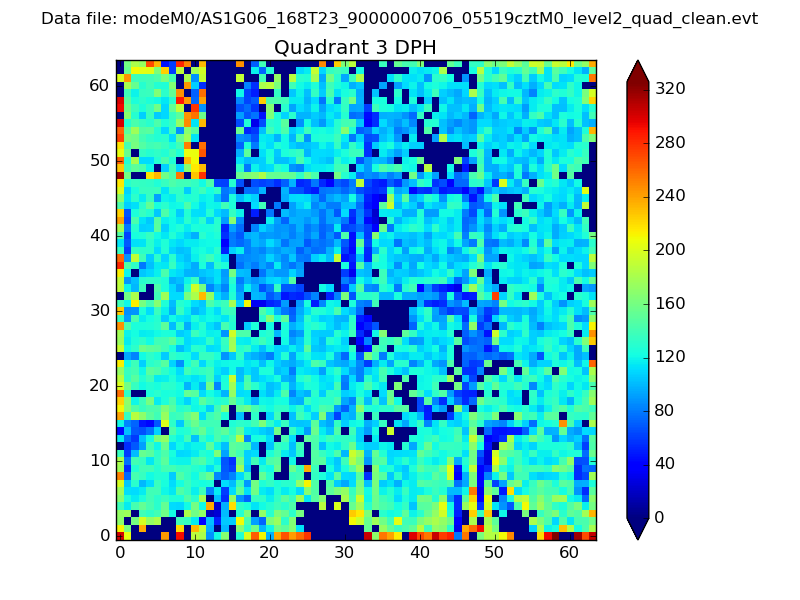 |
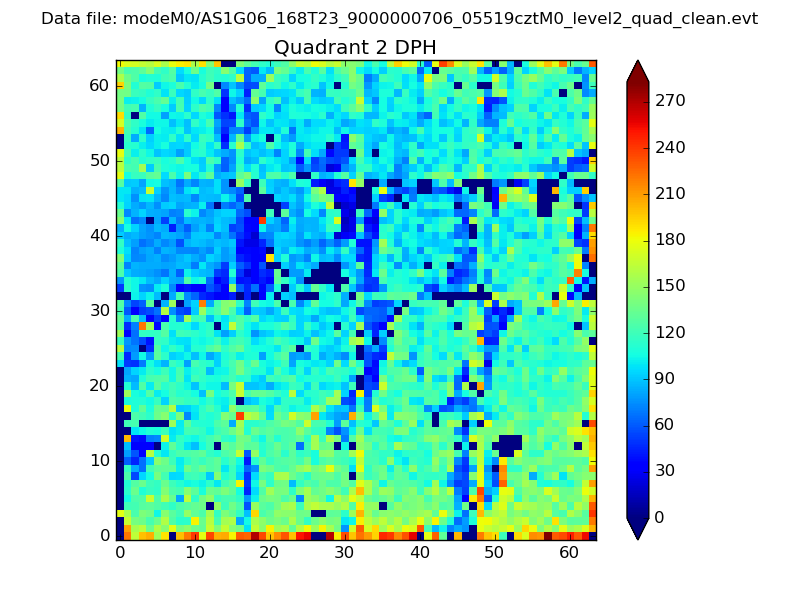 |
Quadrant C |
| Plot type | Count rate plots | Images |
|---|---|---|
| Comparison with Poisson distribution Blue bars denote a histogram of data divided into 1 sec bins. Red curve is a Poisson curve with rate = median count rate of data. |
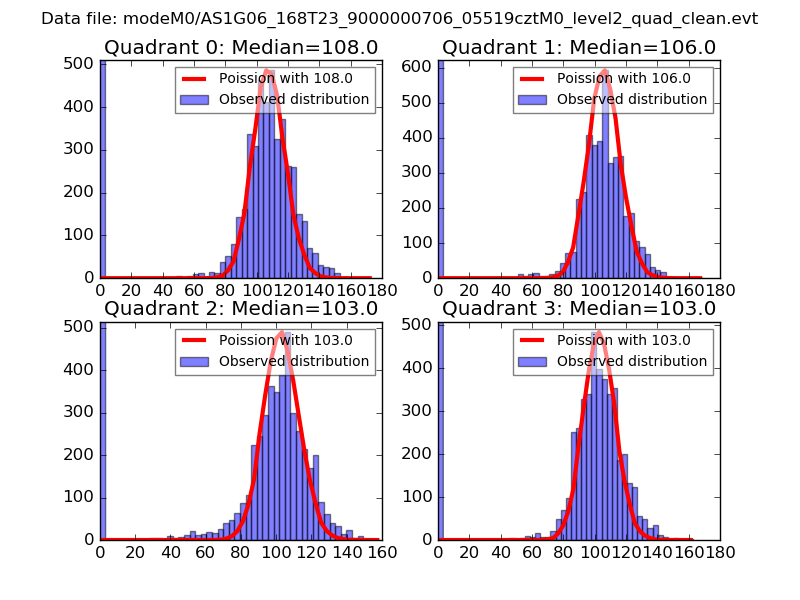 |
 |
| Quadrant-wise count rates Data is divided into 100 sec bins |
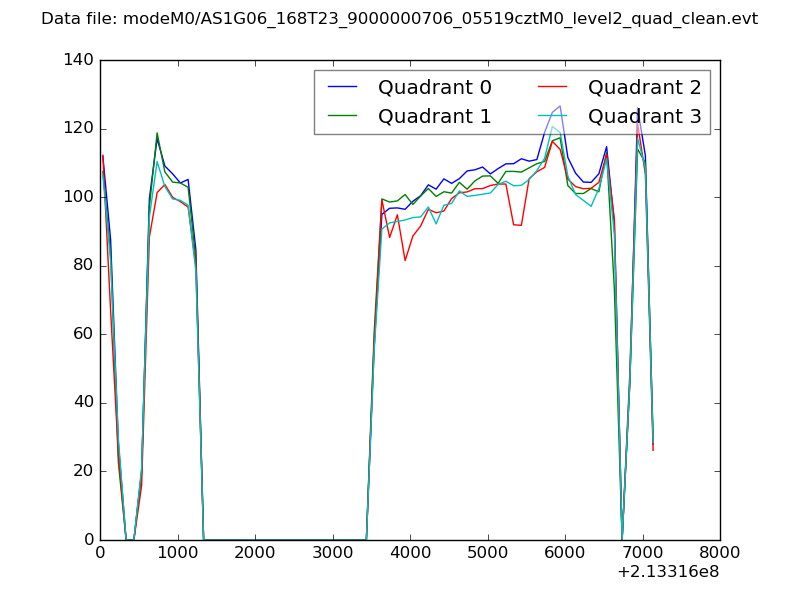 |
|
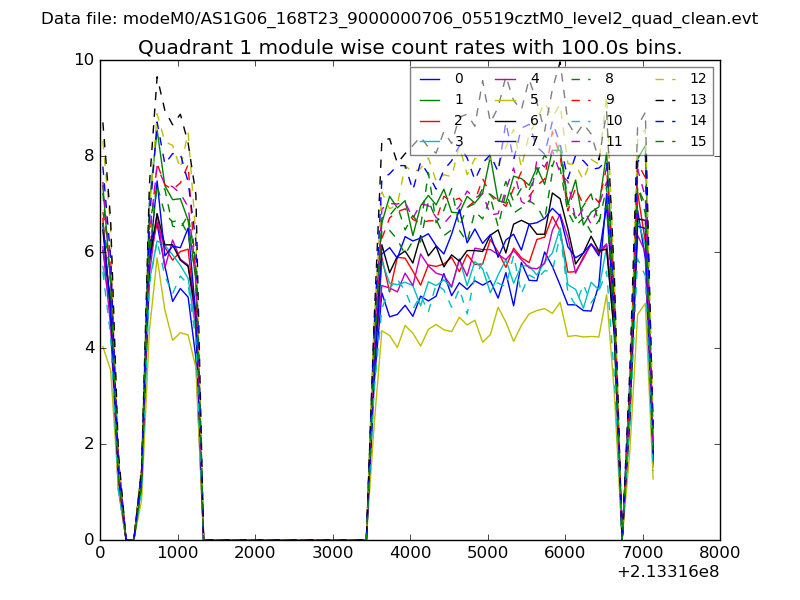
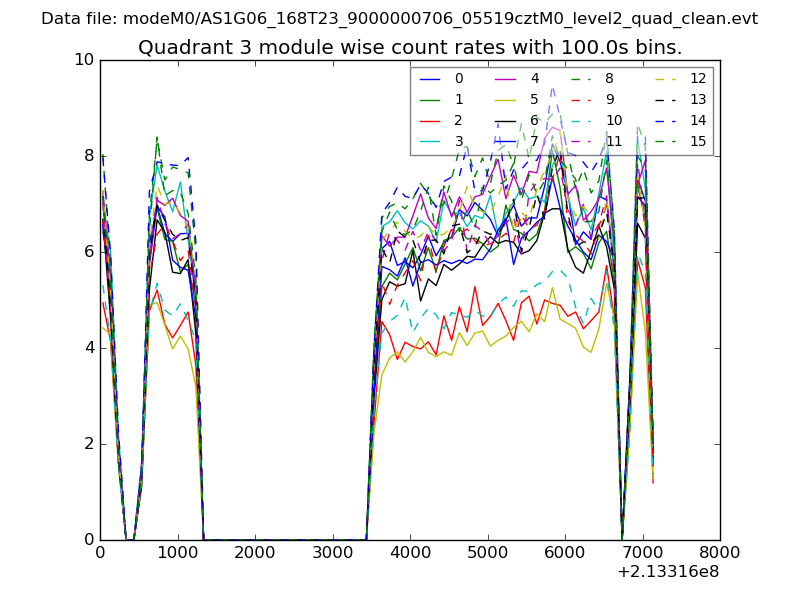
| Module-wise count rates for Quadrant A Data is divided into 100 sec bins |
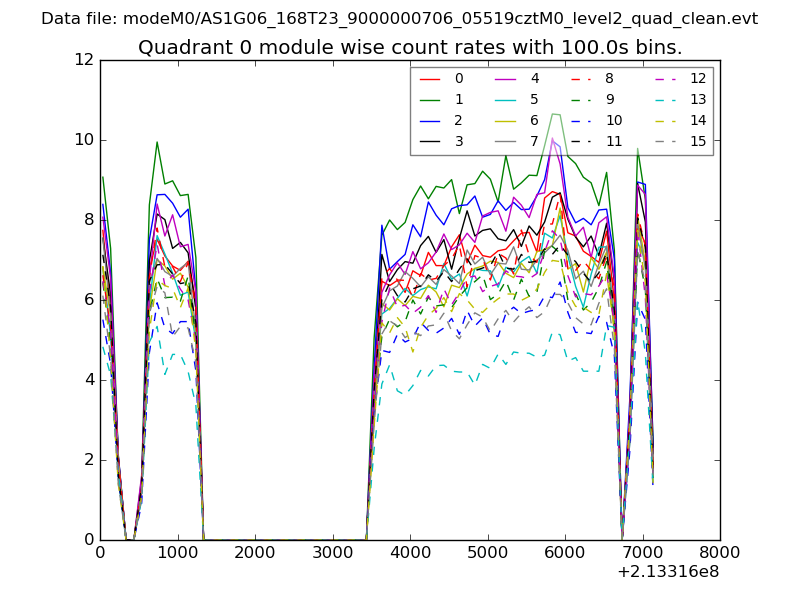 |
 |
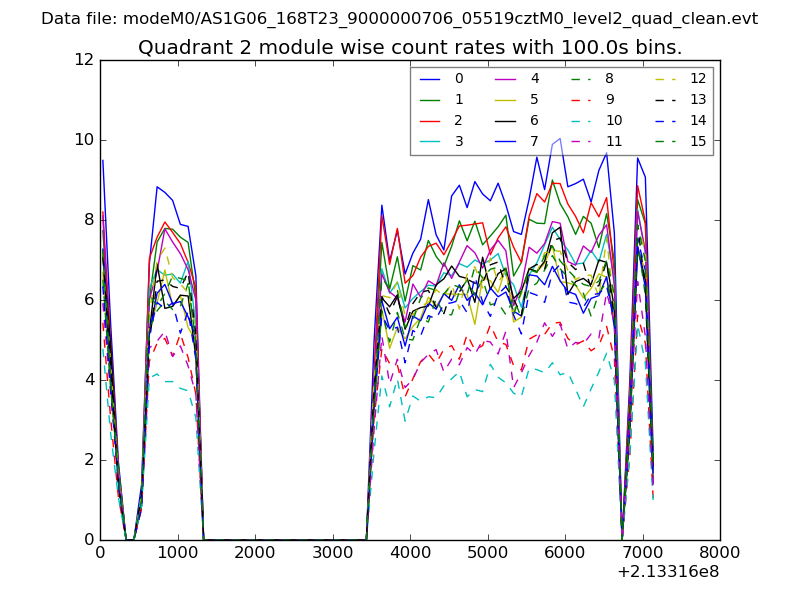
| Module-wise count rates for Quadrant B Data is divided into 100 sec bins |
 |
 |
| Module-wise count rates for Quadrant C Data is divided into 100 sec bins |
 |
 |
| Module-wise count rates for Quadrant D Data is divided into 100 sec bins |
 |
 |
| Parameter | Plot |
|---|---|
| CZT HV Monitor | 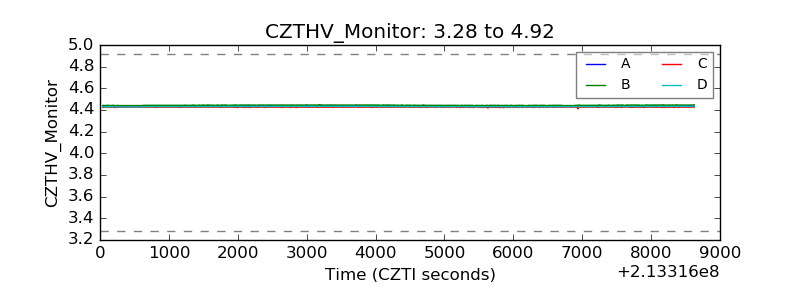 |
| D_VDD | 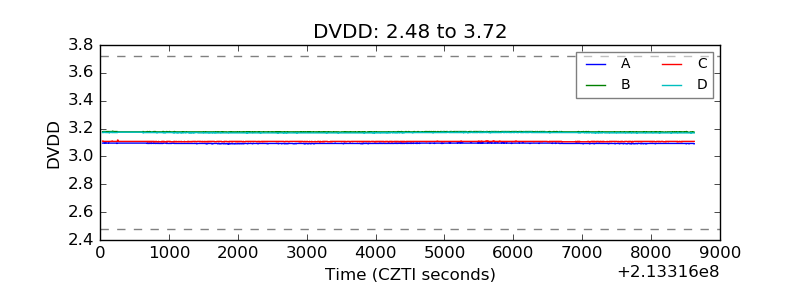 |
| Temperature 1 | 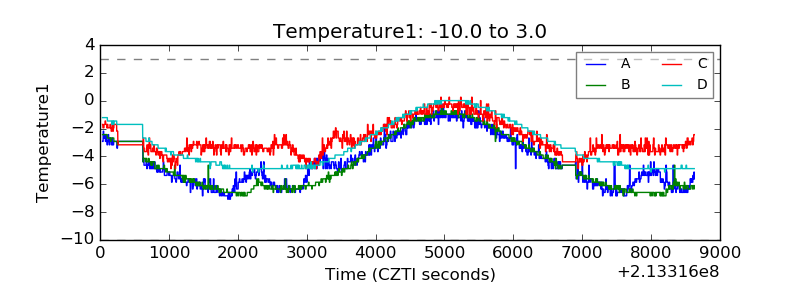 |
| Veto HV Monitor | 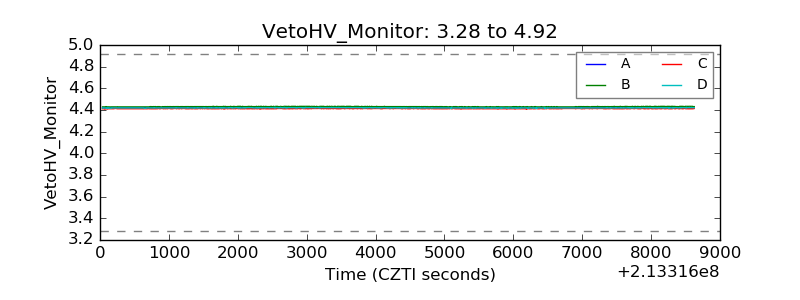 |
| Veto LLD | 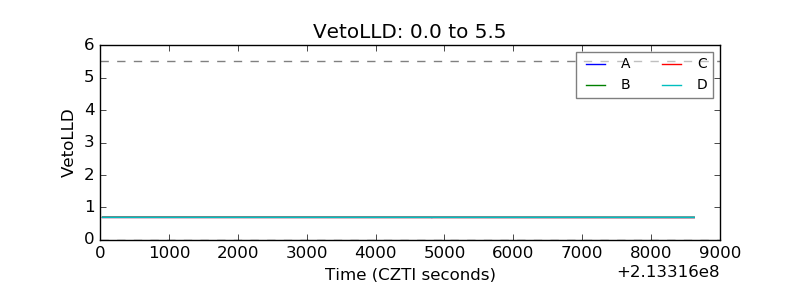 |
| Alpha Counter | 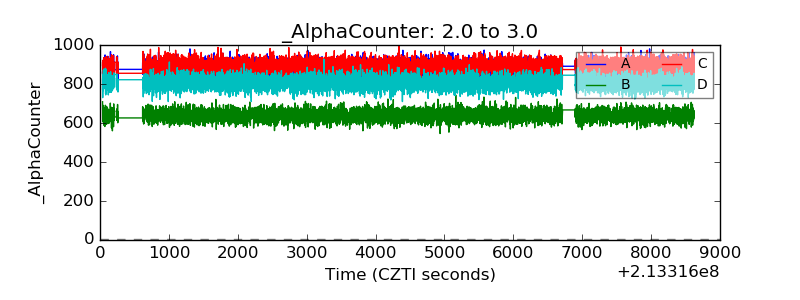 |
| _CPM_Rate | 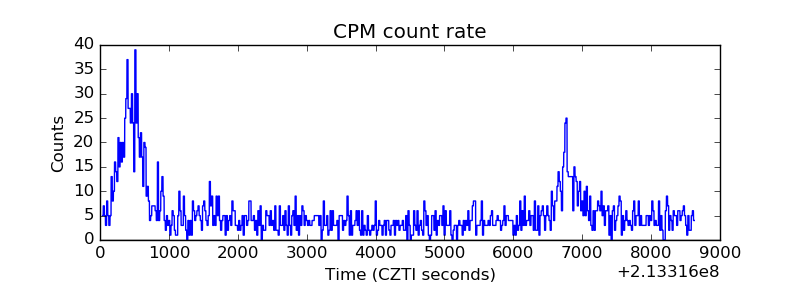 |
| CZT Counter | 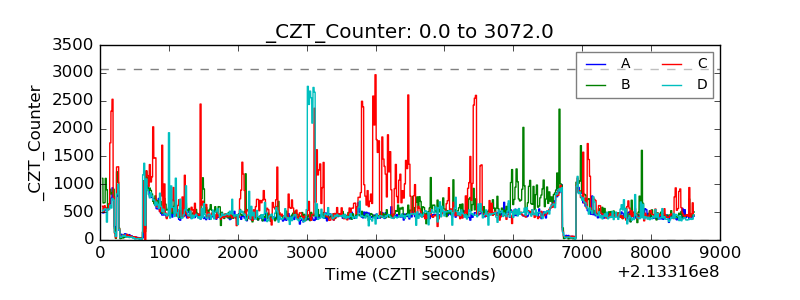 |
| +2.5 Volts monitor | 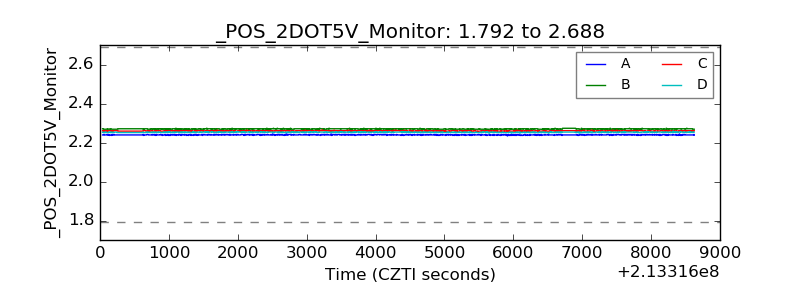 |
| +5 Volts monitor |  |
| _ROLL_ROT | 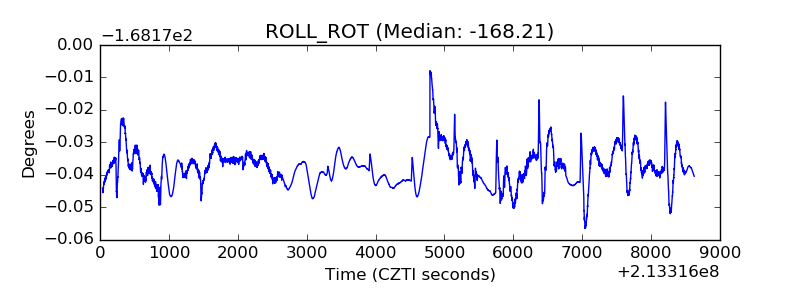 |
| _Roll_DEC | 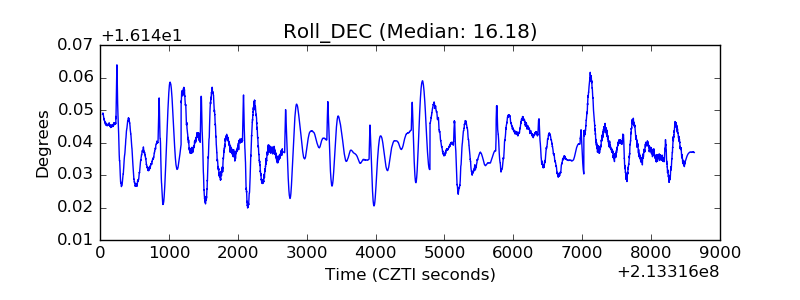 |
| _Roll_RA | 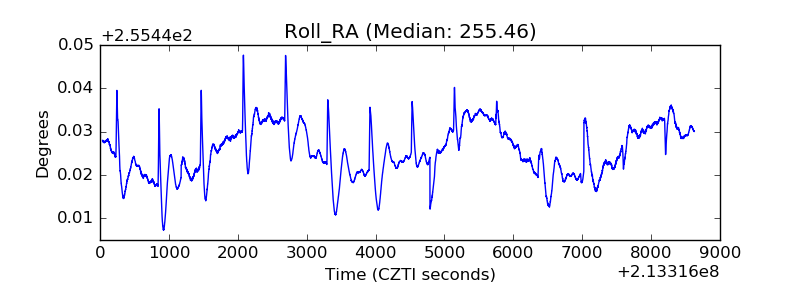 |
| Veto Counter | 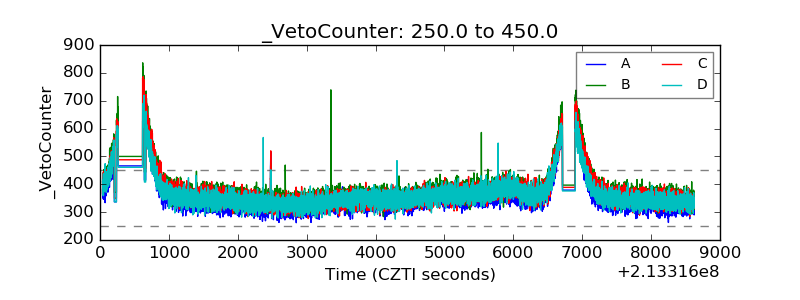 |