| Param | Original file | Final file |
|---|---|---|
| Filename | modeM0/AS1A02_199T01_9000000708cztM0_level2.fits | modeM0/AS1A02_199T01_9000000708cztM0_level2_quad_clean.evt |
| Size (bytes) | 319,547,520 | 377,798,400 |
| Size | 304.7 MB | 360.3 MB |
| Events in quadrant A | 1,938,650 | 2,454,171 |
| Events in quadrant B | 1,848,964 | 2,422,679 |
| Events in quadrant C | 1,884,418 | 2,259,650 |
| Events in quadrant D | 1,564,988 | 1,866,895 |
| Mode M0 | |||
|---|---|---|---|
| Quadrant | BADHDUFLAG | Total packets | Discarded packets |
| A | 0 | 73035 | 0 |
| B | 0 | 81389 | 0 |
| C | 0 | 73313 | 0 |
| D | 0 | 108175 | 0 |
| Mode SS | |||
|---|---|---|---|
| Quadrant | BADHDUFLAG | Total packets | Discarded packets |
| A | 0 | 724 | 0 |
| B | 0 | 722 | 0 |
| C | 0 | 726 | 0 |
| D | 0 | 722 | 0 |
| Mode M9 | |||
|---|---|---|---|
| Quadrant | BADHDUFLAG | Total packets | Discarded packets |
| A | 0 | 60 | 0 |
| B | 0 | 60 | 0 |
| C | 0 | 60 | 0 |
| D | 0 | 59 | 0 |
| Quadrant | Total seconds | Saturated seconds | Saturation percentage |
|---|---|---|---|
| A | 35512 | 400 | 1.126380% |
| B | 35502 | 559 | 1.574559% |
| C | 35516 | 287 | 0.808086% |
| D | 35447 | 3878 | 10.940277% |
Noise dominated data is calculated using 1-second bins in cleaned event files. If a bin has >2000 counts, and if more than 50% of those come from <1% of pixels, then it is considered to be noise-dominated and hence unusable.
| Quadrant | # 1 sec bins | Bins with >0 counts | Bins with >2000 counts | High rate bins dominated by noise | Noise dominated (total time) | Noise dominated (detector-on time) | Marked lightcurve |
|---|---|---|---|---|---|---|---|
| A | 41477 | 35572 | 0 | 0 | 0.00% | 0.00% |  |
| B | 41477 | 35574 | 0 | 0 | 0.00% | 0.00% |  |
| C | 41477 | 35576 | 0 | 0 | 0.00% | 0.00% |  |
| D | 41477 | 35563 | 0 | 0 | 0.00% | 0.00% | 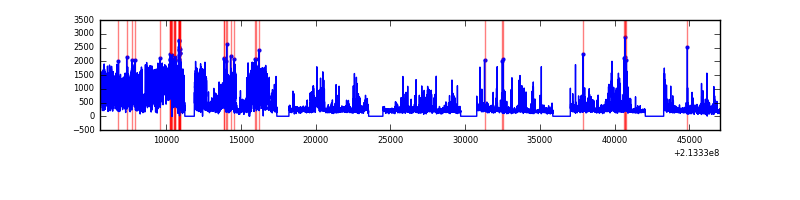 |
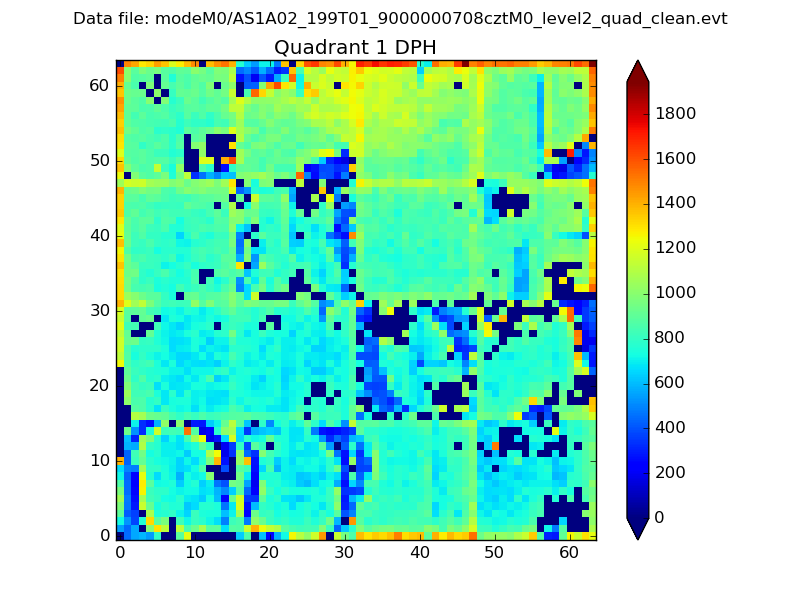
Top three noisy pixels from each quadrant. If the there are fewer than three noisy pixels in the level2.evt file, extra rows are filled as -1
| Pixel properties | Quadrant properties | ||||||
|---|---|---|---|---|---|---|---|
| Quadrant | DetID | PixID | Counts | Sigma | Mean | Median | Sigma |
| A | 14 | 188 | 1964 | 11.58 | 502 | 471 | 129.0 |
| A | 0 | 29 | 1849 | 10.68 | 502 | 471 | 129.0 |
| A | 7 | 110 | 1678 | 9.36 | 502 | 471 | 129.0 |
| B | 2 | 9 | 1633 | 12.04 | 487 | 465 | 97.0 |
| B | 12 | 226 | 1309 | 8.7 | 487 | 465 | 97.0 |
| B | 14 | 254 | 1295 | 8.56 | 487 | 465 | 97.0 |
| C | 1 | 81 | 1381 | 7.01 | 497 | 461 | 131.2 |
| C | 1 | 80 | 1379 | 7.0 | 497 | 461 | 131.2 |
| C | 12 | 241 | 1331 | 6.63 | 497 | 461 | 131.2 |
| D | 11 | 82 | 1185 | 6.52 | 445 | 405 | 119.6 |
| D | 1 | 3 | 1176 | 6.45 | 445 | 405 | 119.6 |
| D | 1 | 19 | 1175 | 6.44 | 445 | 405 | 119.6 |
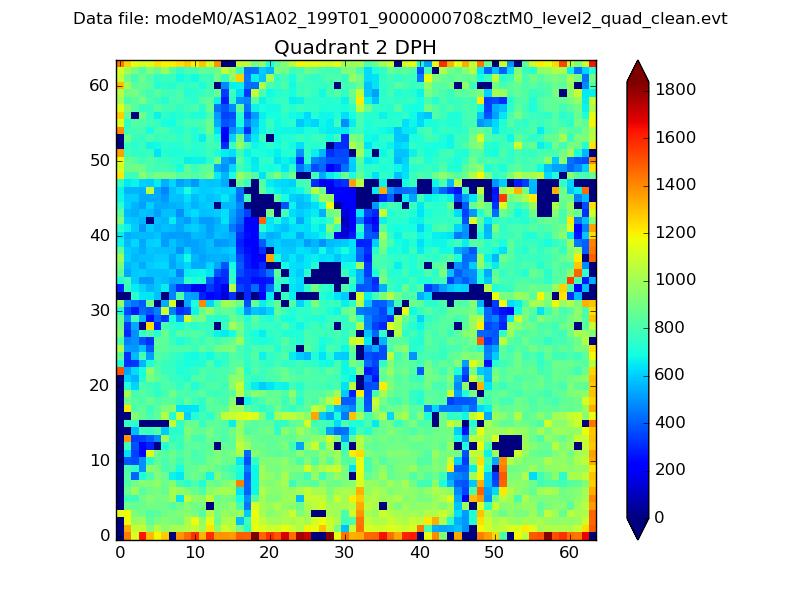
Histogram calculated using DETX and DETY for each event in the final _common_clean file
| Quadrant A | 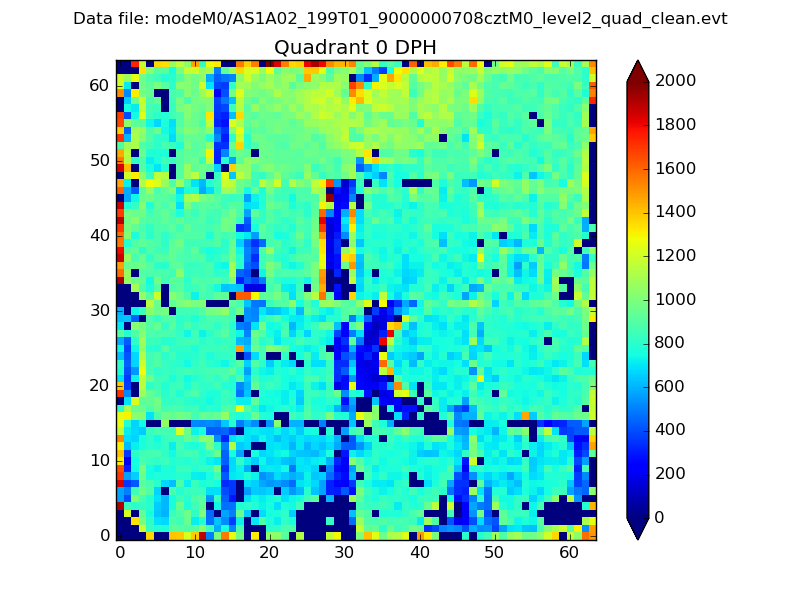 |
 |
Quadrant B |
|---|---|---|---|
| Quadrant D | 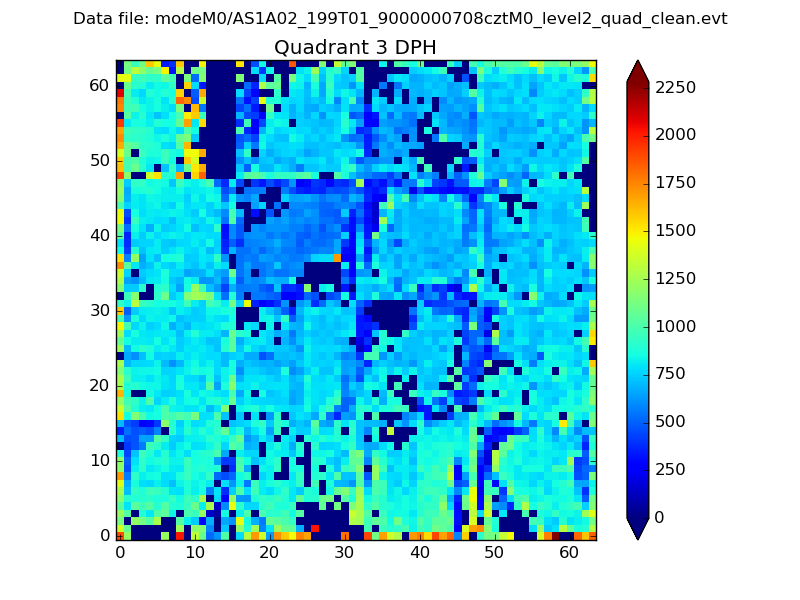 |
 |
Quadrant C |
| Plot type | Count rate plots | Images |
|---|---|---|
| Comparison with Poisson distribution Blue bars denote a histogram of data divided into 1 sec bins. Red curve is a Poisson curve with rate = median count rate of data. |
 |
 |
| Quadrant-wise count rates Data is divided into 100 sec bins |
 |
|
| Module-wise count rates for Quadrant A Data is divided into 100 sec bins |
 |
 |
| Module-wise count rates for Quadrant B Data is divided into 100 sec bins |
 |
 |
| Module-wise count rates for Quadrant C Data is divided into 100 sec bins |
 |
 |
| Module-wise count rates for Quadrant D Data is divided into 100 sec bins |
 |
 |
| Parameter | Plot |
|---|---|
| CZT HV Monitor | 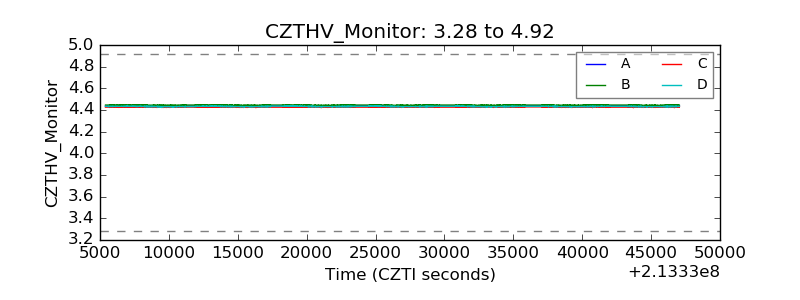 |
| D_VDD |  |
| Temperature 1 | 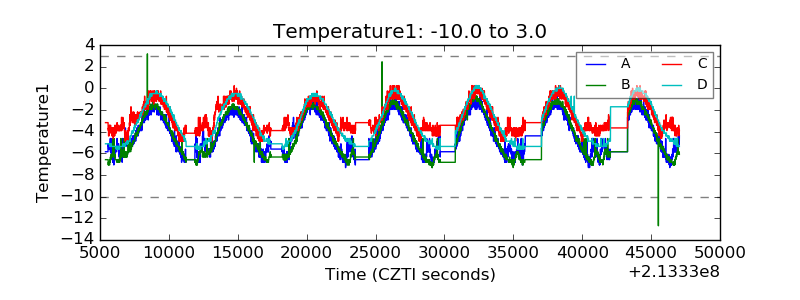 |
| Veto HV Monitor |  |
| Veto LLD |  |
| Alpha Counter |  |
| _CPM_Rate |  |
| CZT Counter |  |
| +2.5 Volts monitor |  |
| +5 Volts monitor |  |
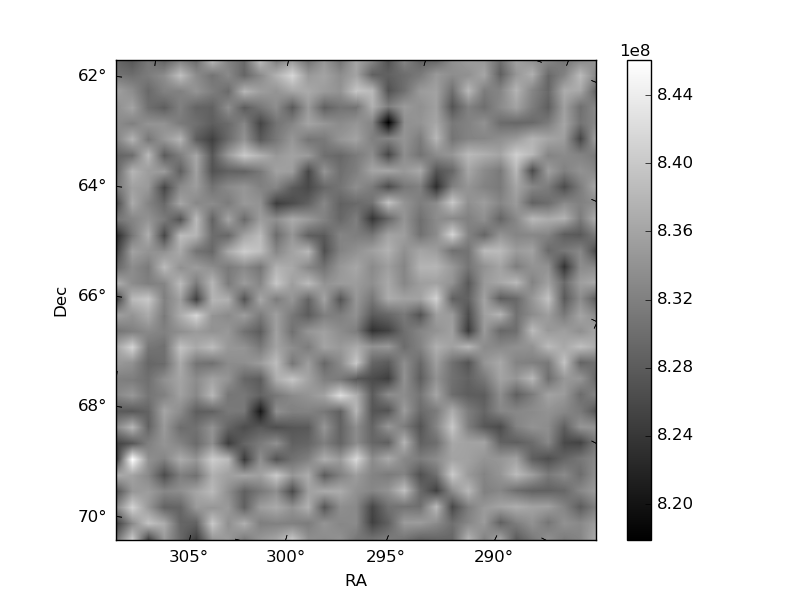
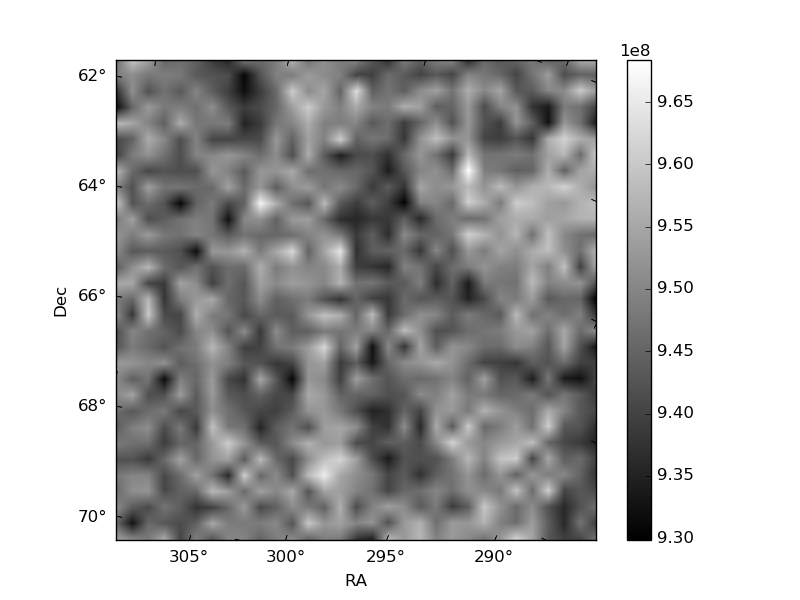
| _ROLL_ROT | 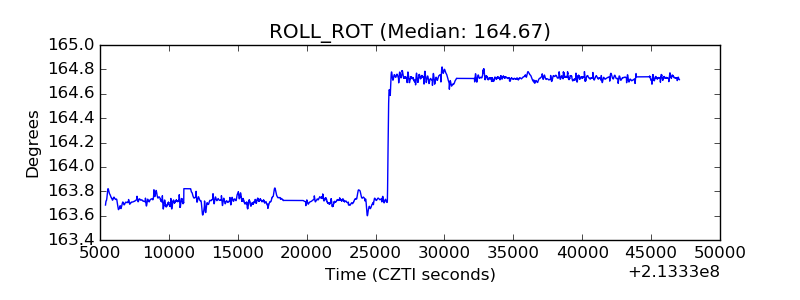 |
| _Roll_DEC |  |
| _Roll_RA |  |
| Veto Counter |  |