| Param | Original file | Final file |
|---|---|---|
| Filename | modeM0/AS1A02_199T01_9000000708_05523cztM0_level2.evt | modeM0/AS1A02_199T01_9000000708_05523cztM0_level2_quad_clean.evt |
| Size (bytes) | 1,160,219,520 | 137,712,960 |
| Size | 1.1 GB | 131.3 MB |
| Events in quadrant A | 5,667,823 | 877,356 |
| Events in quadrant B | 6,756,419 | 877,169 |
| Events in quadrant C | 5,504,866 | 844,410 |
| Events in quadrant D | 16,354,255 | 696,088 |
| Mode M0 | |||
|---|---|---|---|
| Quadrant | BADHDUFLAG | Total packets | Discarded packets |
| A | 0 | 26029 | 100 |
| B | 0 | 28778 | 145 |
| C | 0 | 25771 | 103 |
| D | 0 | 57824 | 649 |
| Mode SS | |||
|---|---|---|---|
| Quadrant | BADHDUFLAG | Total packets | Discarded packets |
| A | 0 | 260 | 2 |
| B | 0 | 260 | 2 |
| C | 0 | 260 | 0 |
| D | 0 | 260 | 4 |
| Mode M9 | |||
|---|---|---|---|
| Quadrant | BADHDUFLAG | Total packets | Discarded packets |
| A | 0 | 16 | 0 |
| B | 0 | 16 | 0 |
| C | 0 | 16 | 0 |
| D | 0 | 16 | 1 |
| Quadrant | Total seconds | Saturated seconds | Saturation percentage |
|---|---|---|---|
| A | 12657 | 110 | 0.869084% |
| B | 12647 | 143 | 1.130703% |
| C | 12654 | 84 | 0.663822% |
| D | 12594 | 3570 | 28.346832% |
Noise dominated data is calculated using 1-second bins in cleaned event files. If a bin has >2000 counts, and if more than 50% of those come from <1% of pixels, then it is considered to be noise-dominated and hence unusable.
| Quadrant | # 1 sec bins | Bins with >0 counts | Bins with >2000 counts | High rate bins dominated by noise | Noise dominated (total time) | Noise dominated (detector-on time) | Marked lightcurve |
|---|---|---|---|---|---|---|---|
| A | 14158 | 12704 | 9 | 9 | 0.06% | 0.07% | 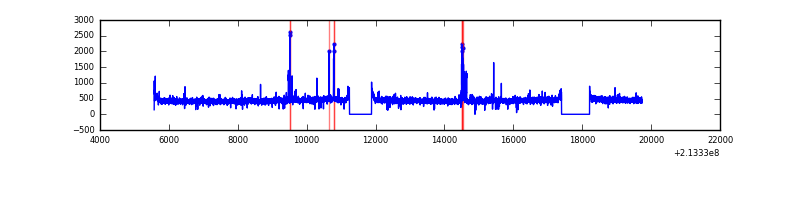 |
| B | 14158 | 12704 | 3 | 3 | 0.02% | 0.02% | 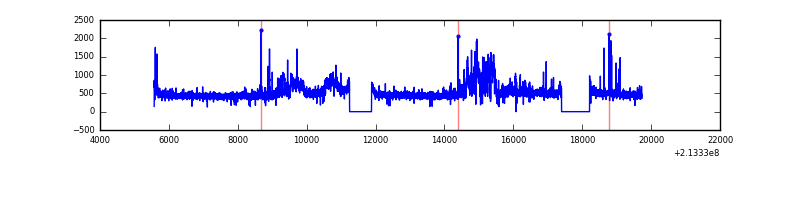 |
| C | 14158 | 12705 | 0 | 0 | 0.00% | 0.00% | 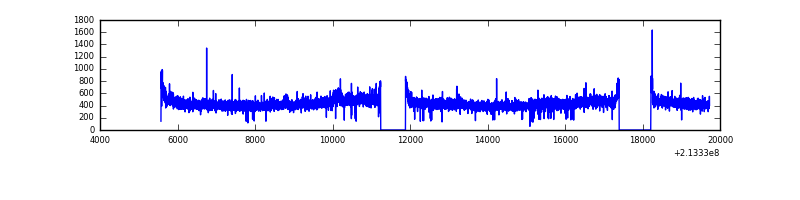 |
| D | 14158 | 12700 | 2884 | 2884 | 20.37% | 22.71% | 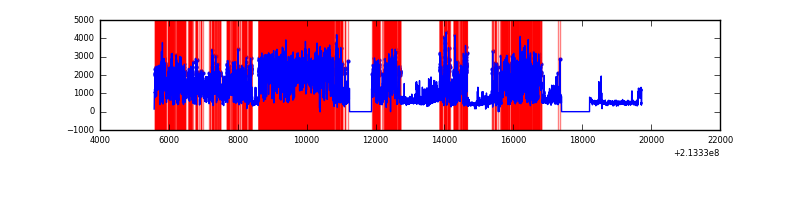 |
Top three noisy pixels from each quadrant. If the there are fewer than three noisy pixels in the level2.evt file, extra rows are filled as -1
| Pixel properties | Quadrant properties | ||||||
|---|---|---|---|---|---|---|---|
| Quadrant | DetID | PixID | Counts | Sigma | Mean | Median | Sigma |
| A | 7 | 16 | 88792 | 299.68 | 1428 | 1393 | 291.6 |
| A | 0 | 50 | 57937 | 193.88 | 1428 | 1393 | 291.6 |
| A | 12 | 194 | 13935 | 43.0 | 1428 | 1393 | 291.6 |
| B | 15 | 255 | 713623 | 2569.71 | 1443 | 1407 | 277.2 |
| B | 15 | 204 | 261817 | 939.57 | 1443 | 1407 | 277.2 |
| B | 10 | 16 | 47260 | 165.44 | 1443 | 1407 | 277.2 |
| C | 1 | 16 | 59098 | 181.75 | 1377 | 1382 | 317.6 |
| C | 8 | 208 | 37975 | 115.23 | 1377 | 1382 | 317.6 |
| C | 9 | 247 | 13955 | 39.59 | 1377 | 1382 | 317.6 |
| D | 2 | 63 | 10751664 | 34931.32 | 1258 | 1216 | 307.8 |
| D | 2 | 152 | 342355 | 1108.46 | 1258 | 1216 | 307.8 |
| D | 2 | 33 | 150261 | 484.29 | 1258 | 1216 | 307.8 |
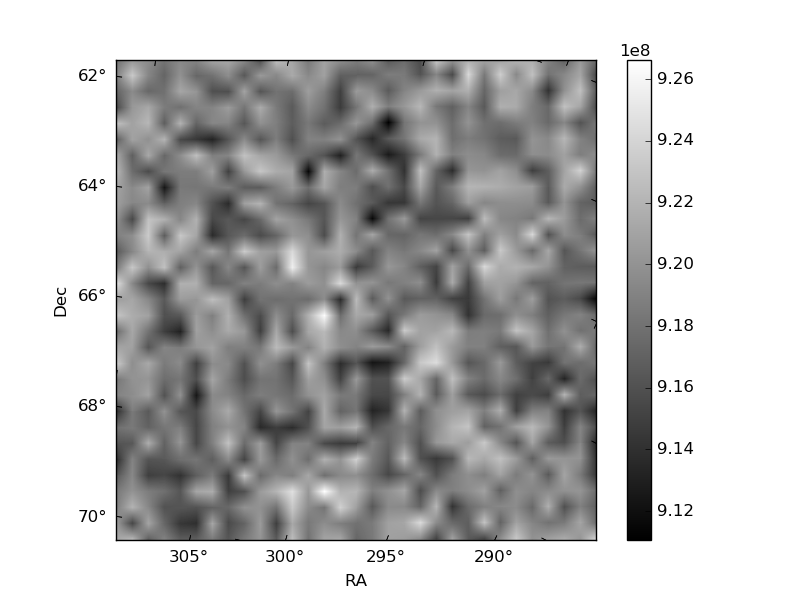
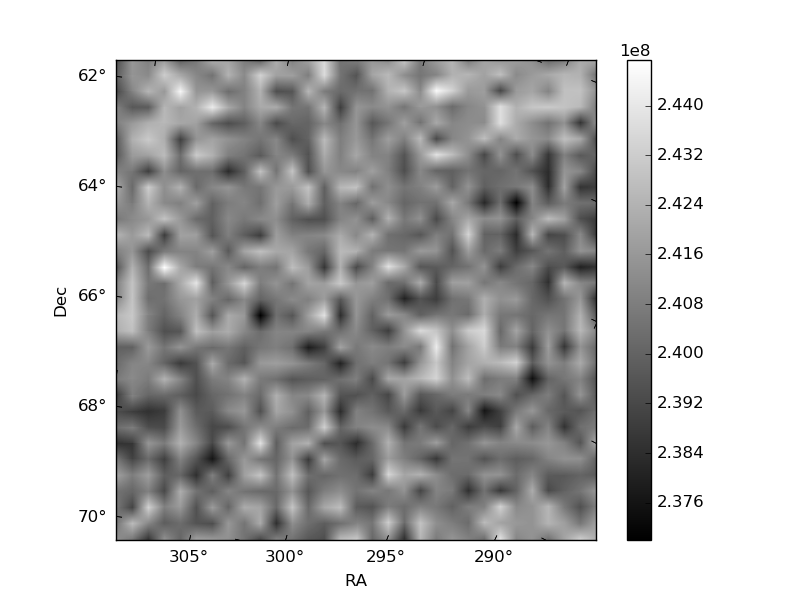
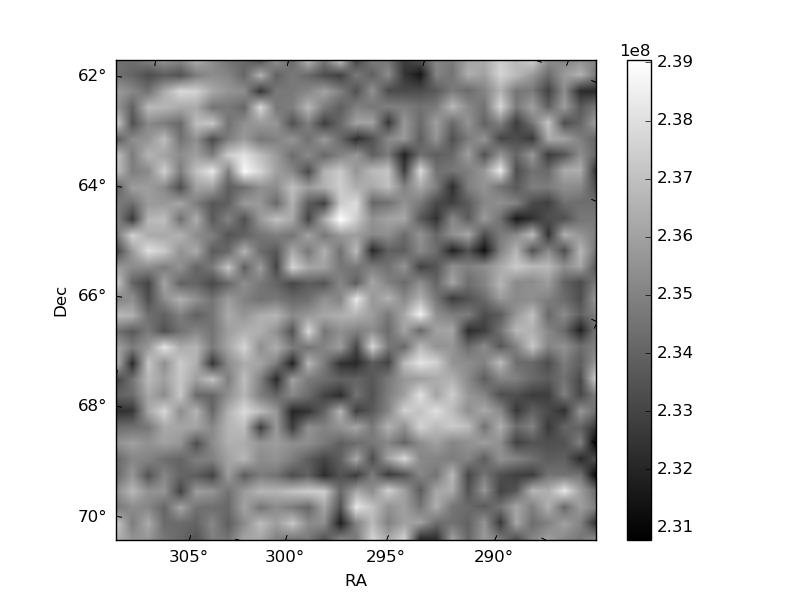
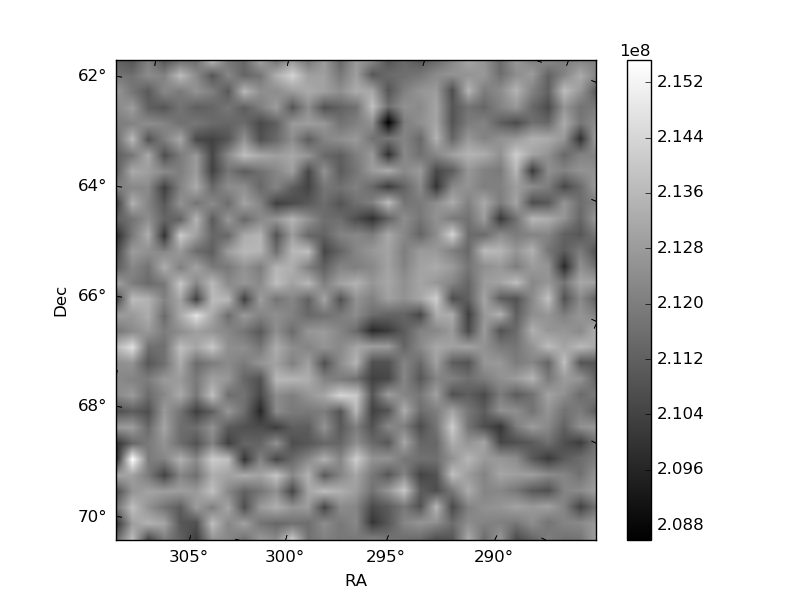
Histogram calculated using DETX and DETY for each event in the final _common_clean file
| Quadrant A | 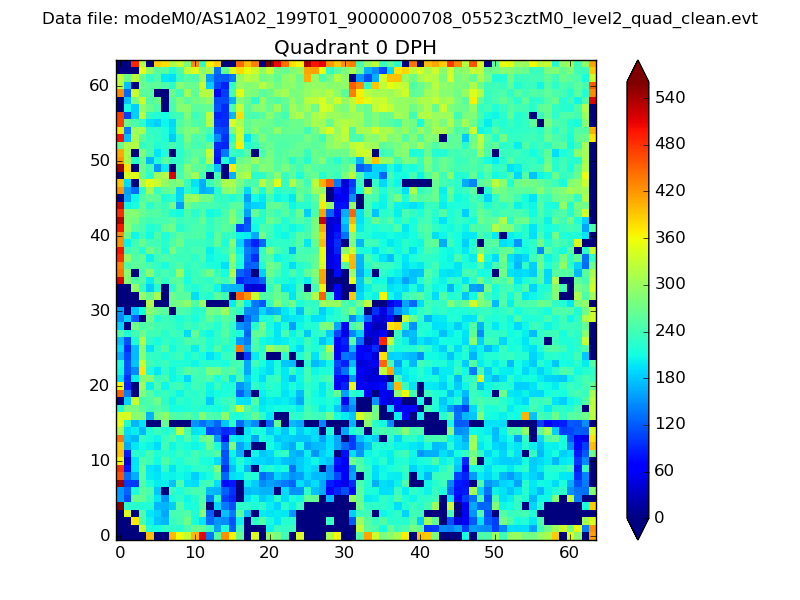 |
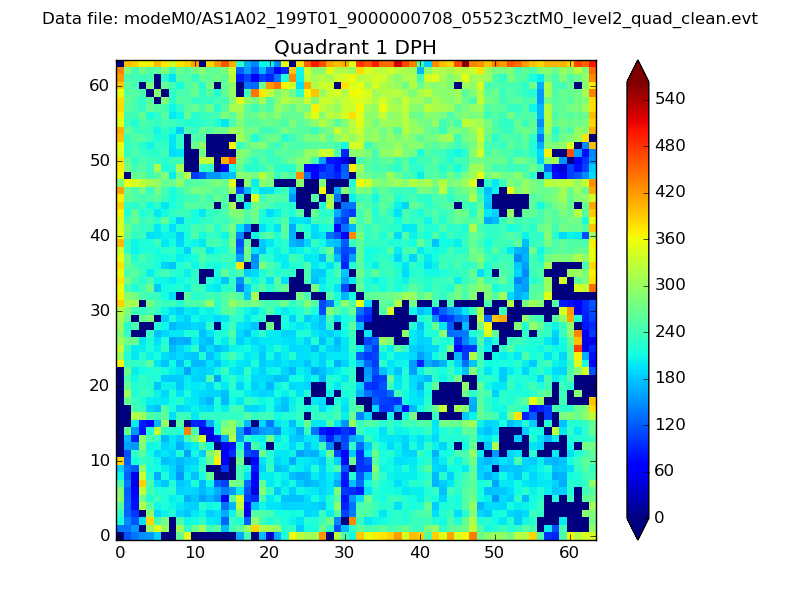 |
Quadrant B |
|---|---|---|---|
| Quadrant D | 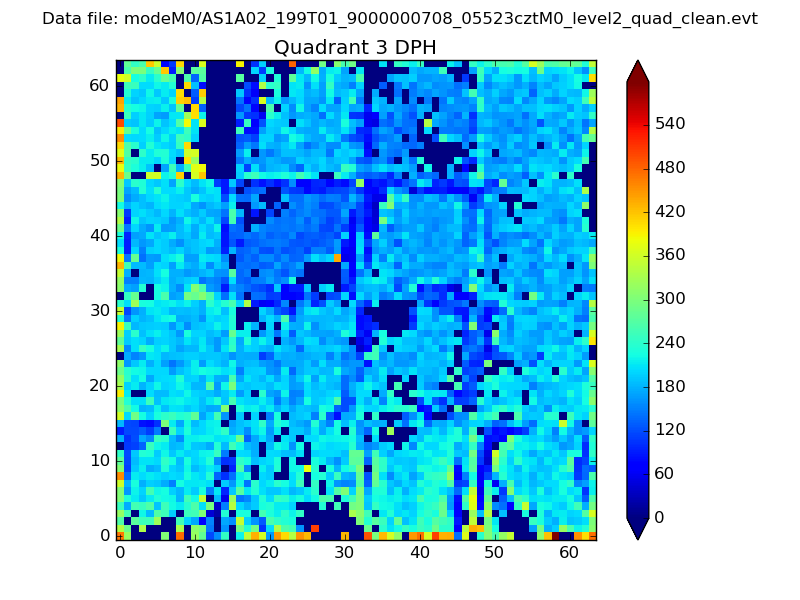 |
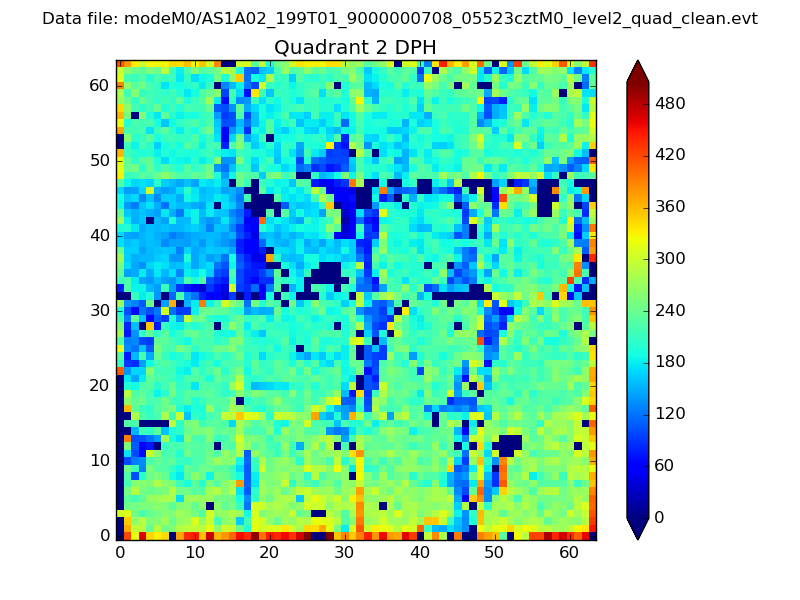 |
Quadrant C |
| Plot type | Count rate plots | Images |
|---|---|---|
| Comparison with Poisson distribution Blue bars denote a histogram of data divided into 1 sec bins. Red curve is a Poisson curve with rate = median count rate of data. |
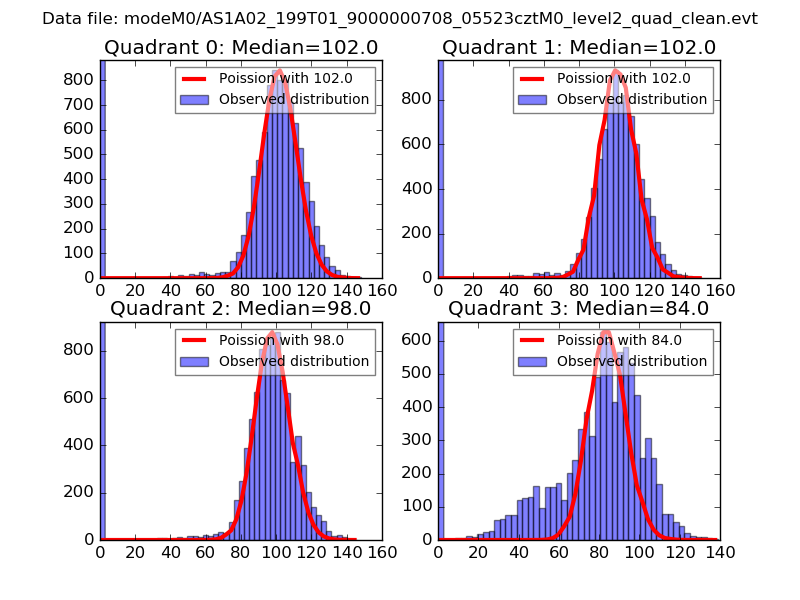 |
 |
| Quadrant-wise count rates Data is divided into 100 sec bins |
 |
|
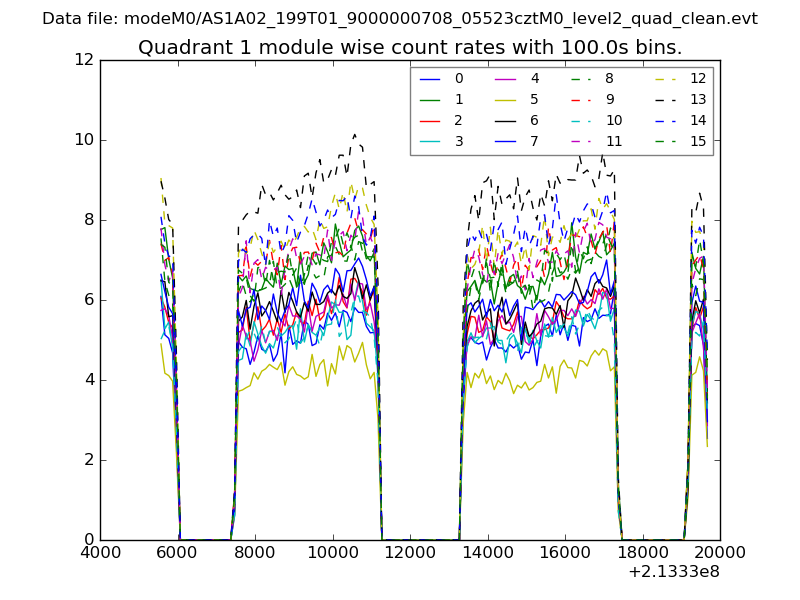
| Module-wise count rates for Quadrant A Data is divided into 100 sec bins |
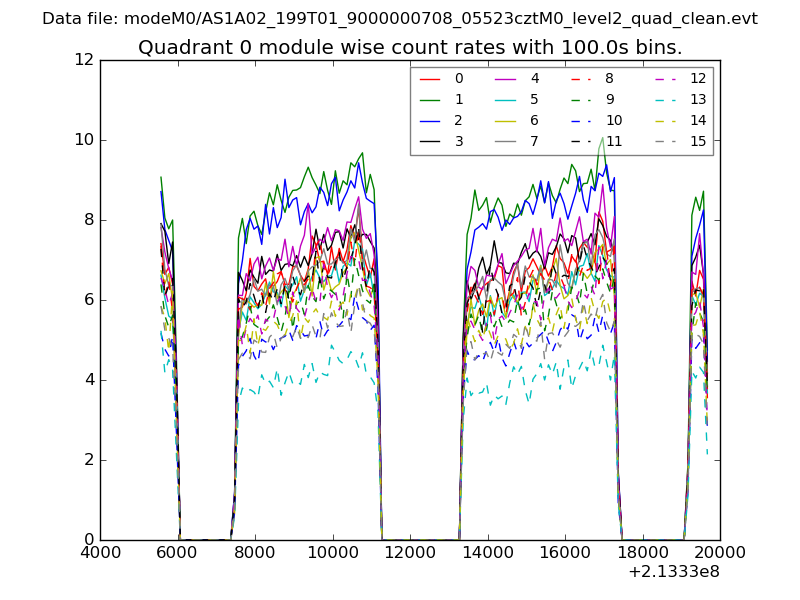 |
 |
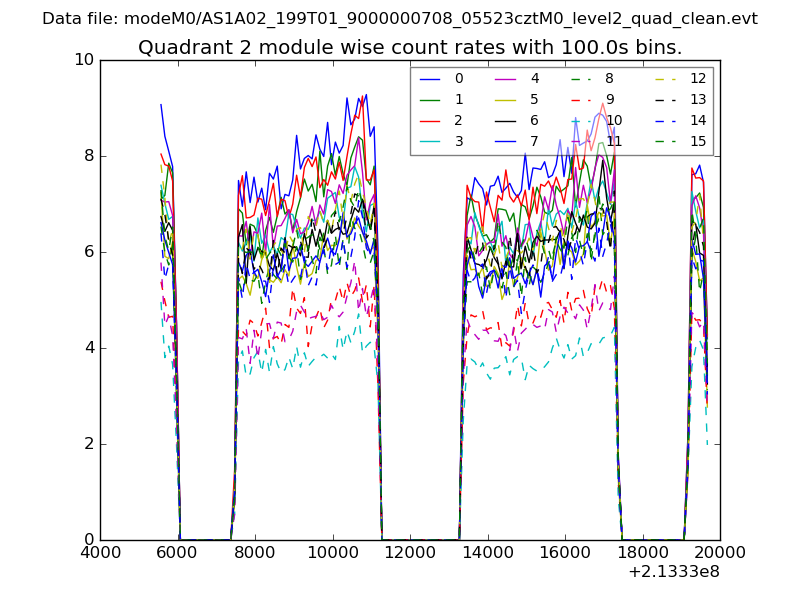
| Module-wise count rates for Quadrant B Data is divided into 100 sec bins |
 |
 |
| Module-wise count rates for Quadrant C Data is divided into 100 sec bins |
 |
 |
| Module-wise count rates for Quadrant D Data is divided into 100 sec bins |
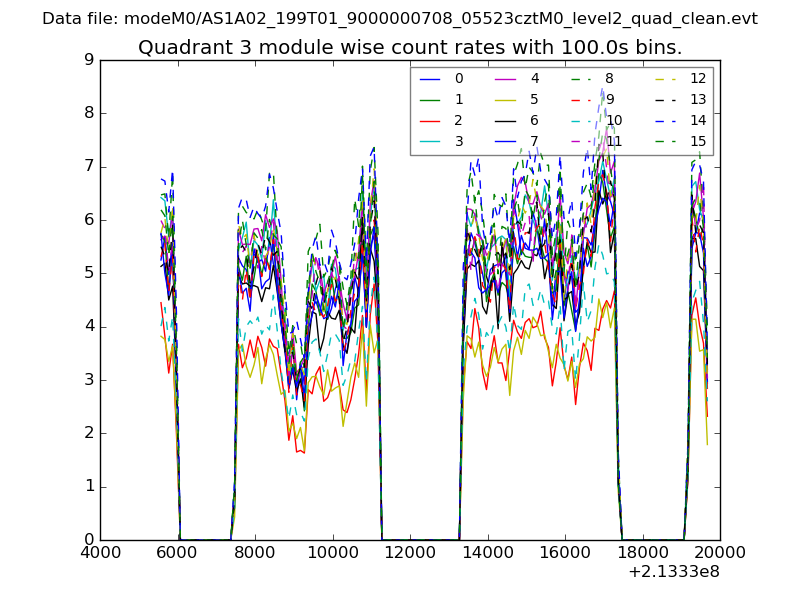 |
 |
| Parameter | Plot |
|---|---|
| CZT HV Monitor | 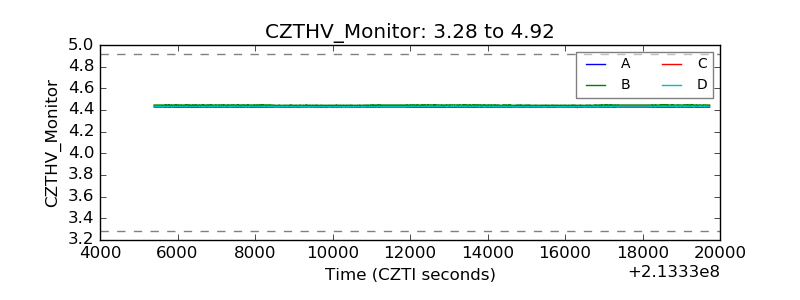 |
| D_VDD | 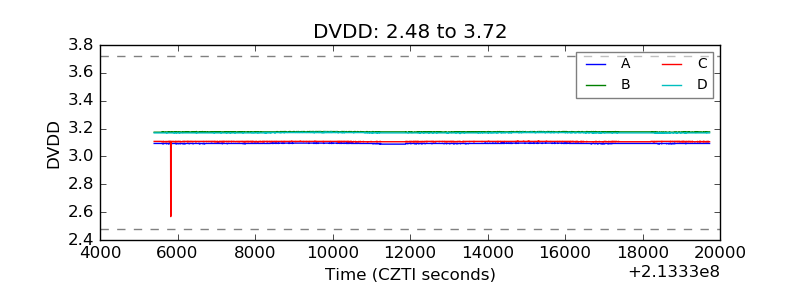 |
| Temperature 1 | 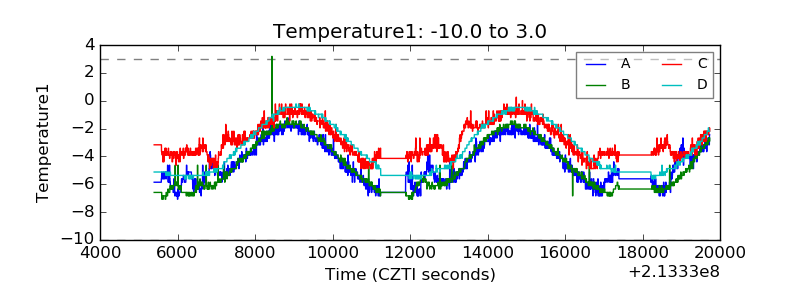 |
| Veto HV Monitor | 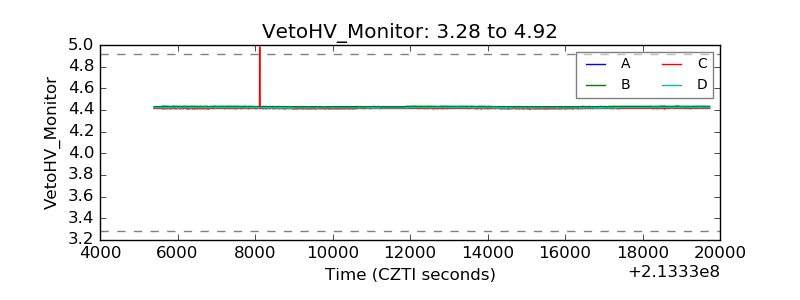 |
| Veto LLD | 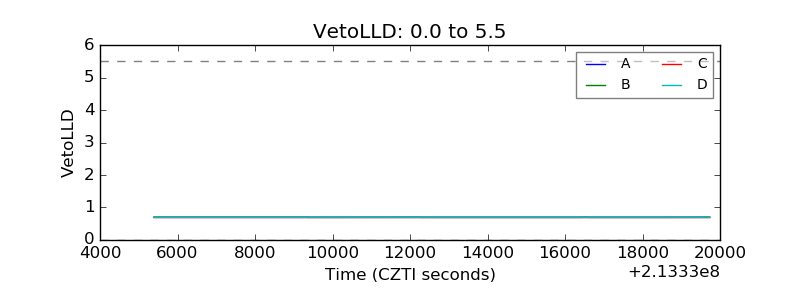 |
| Alpha Counter | 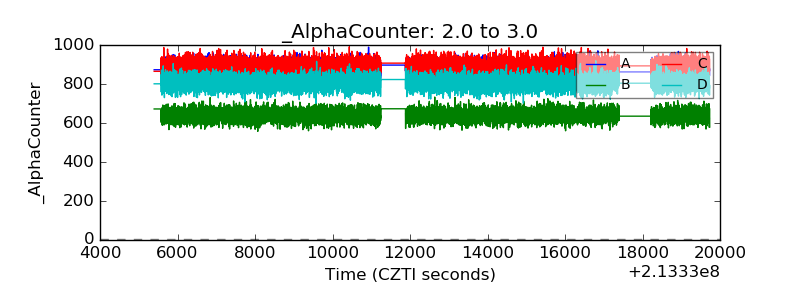 |
| _CPM_Rate | 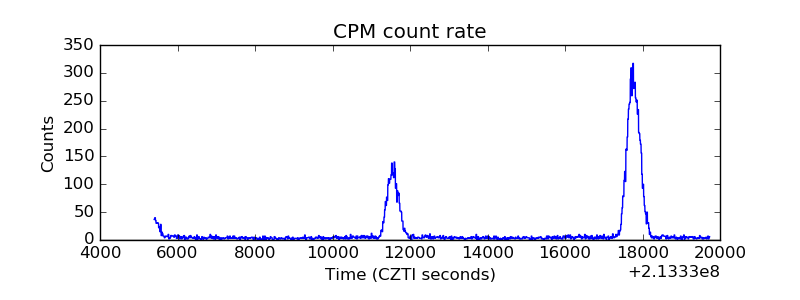 |
| CZT Counter | 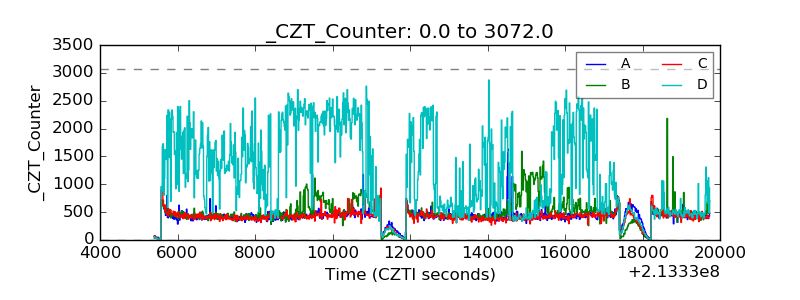 |
| +2.5 Volts monitor | 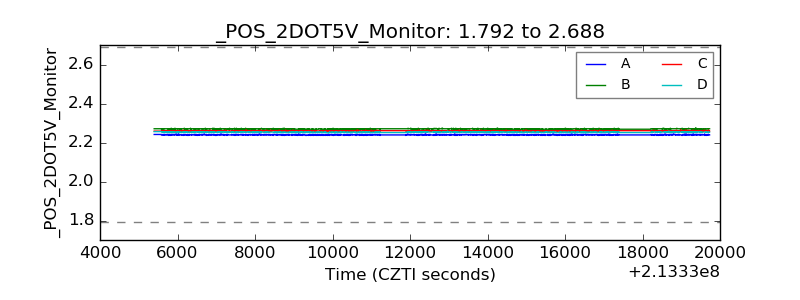 |
| +5 Volts monitor |  |
| _ROLL_ROT | 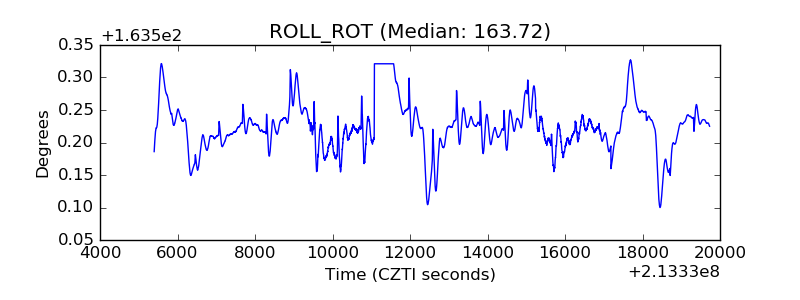 |
| _Roll_DEC | 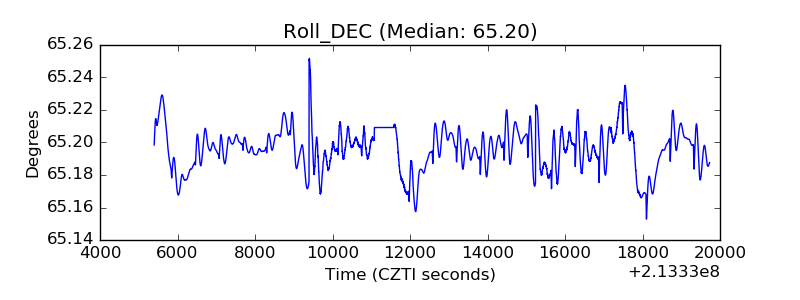 |
| _Roll_RA | 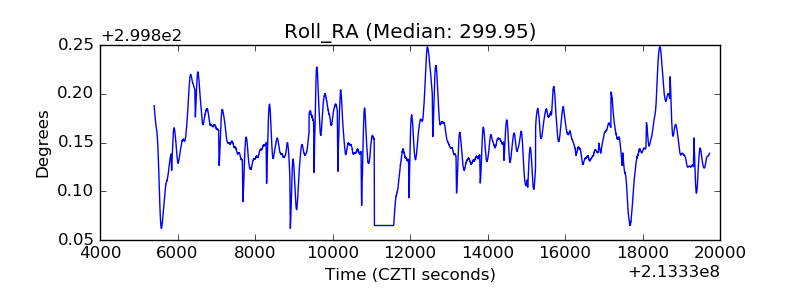 |
| Veto Counter | 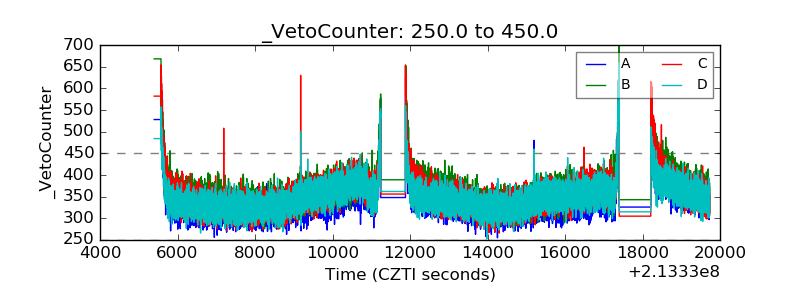 |