| Param | Original file | Final file |
|---|---|---|
| Filename | modeM0/AS1A02_199T01_9000000708_05524cztM0_level2.evt | modeM0/AS1A02_199T01_9000000708_05524cztM0_level2_quad_clean.evt |
| Size (bytes) | 466,649,280 | 83,309,760 |
| Size | 445.0 MB | 79.5 MB |
| Events in quadrant A | 2,967,754 | 532,989 |
| Events in quadrant B | 3,966,534 | 523,578 |
| Events in quadrant C | 3,109,917 | 509,705 |
| Events in quadrant D | 3,634,799 | 490,978 |
| Mode M0 | |||
|---|---|---|---|
| Quadrant | BADHDUFLAG | Total packets | Discarded packets |
| A | 0 | 13533 | 21 |
| B | 0 | 16020 | 39 |
| C | 0 | 14123 | 49 |
| D | 0 | 15286 | 28 |
| Mode SS | |||
|---|---|---|---|
| Quadrant | BADHDUFLAG | Total packets | Discarded packets |
| A | 0 | 134 | 0 |
| B | 0 | 134 | 0 |
| C | 0 | 134 | 2 |
| D | 0 | 134 | 0 |
| Mode M9 | |||
|---|---|---|---|
| Quadrant | BADHDUFLAG | Total packets | Discarded packets |
| A | 0 | 10 | 0 |
| B | 0 | 10 | 0 |
| C | 0 | 10 | 0 |
| D | 0 | 10 | 0 |
| Quadrant | Total seconds | Saturated seconds | Saturation percentage |
|---|---|---|---|
| A | 6690 | 56 | 0.837070% |
| B | 6681 | 183 | 2.739111% |
| C | 6677 | 53 | 0.793770% |
| D | 6686 | 64 | 0.957224% |
Noise dominated data is calculated using 1-second bins in cleaned event files. If a bin has >2000 counts, and if more than 50% of those come from <1% of pixels, then it is considered to be noise-dominated and hence unusable.
| Quadrant | # 1 sec bins | Bins with >0 counts | Bins with >2000 counts | High rate bins dominated by noise | Noise dominated (total time) | Noise dominated (detector-on time) | Marked lightcurve |
|---|---|---|---|---|---|---|---|
| A | 7654 | 6699 | 0 | 0 | 0.00% | 0.00% |  |
| B | 7654 | 6699 | 96 | 96 | 1.25% | 1.43% |  |
| C | 7654 | 6698 | 3 | 3 | 0.04% | 0.04% |  |
| D | 7654 | 6700 | 13 | 13 | 0.17% | 0.19% |  |
Top three noisy pixels from each quadrant. If the there are fewer than three noisy pixels in the level2.evt file, extra rows are filled as -1
| Pixel properties | Quadrant properties | ||||||
|---|---|---|---|---|---|---|---|
| Quadrant | DetID | PixID | Counts | Sigma | Mean | Median | Sigma |
| A | 0 | 226 | 7576 | 43.85 | 768 | 752 | 155.6 |
| A | 12 | 194 | 7542 | 43.63 | 768 | 752 | 155.6 |
| A | 13 | 6 | 4022 | 21.01 | 768 | 752 | 155.6 |
| B | 10 | 16 | 385533 | 2602.23 | 766 | 748 | 147.9 |
| B | 15 | 204 | 373956 | 2523.93 | 766 | 748 | 147.9 |
| B | 15 | 255 | 151368 | 1018.61 | 766 | 748 | 147.9 |
| C | 1 | 241 | 133329 | 779.99 | 733 | 736 | 170.0 |
| C | 9 | 221 | 89752 | 523.65 | 733 | 736 | 170.0 |
| C | 9 | 247 | 9894 | 53.87 | 733 | 736 | 170.0 |
| D | 2 | 63 | 524815 | 2889.3 | 738 | 713 | 181.4 |
| D | 2 | 152 | 179315 | 984.6 | 738 | 713 | 181.4 |
| D | 8 | 195 | 51013 | 277.29 | 738 | 713 | 181.4 |
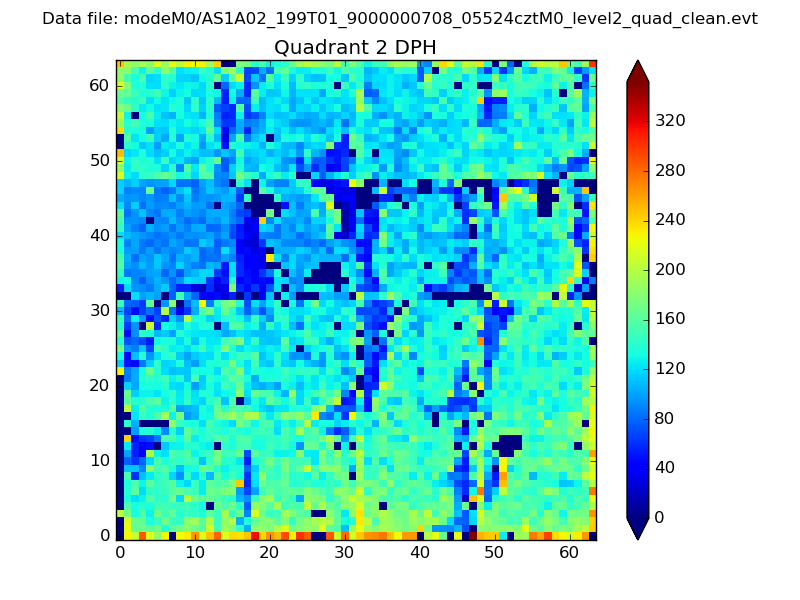
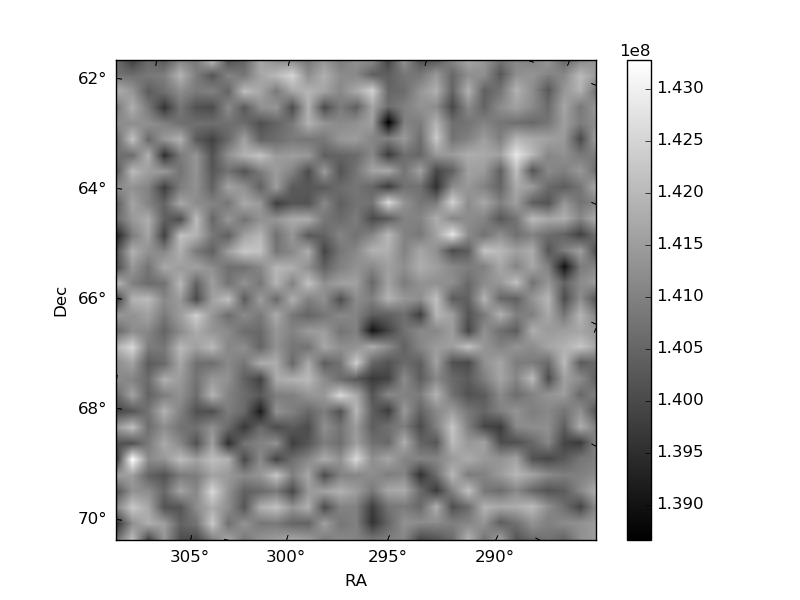
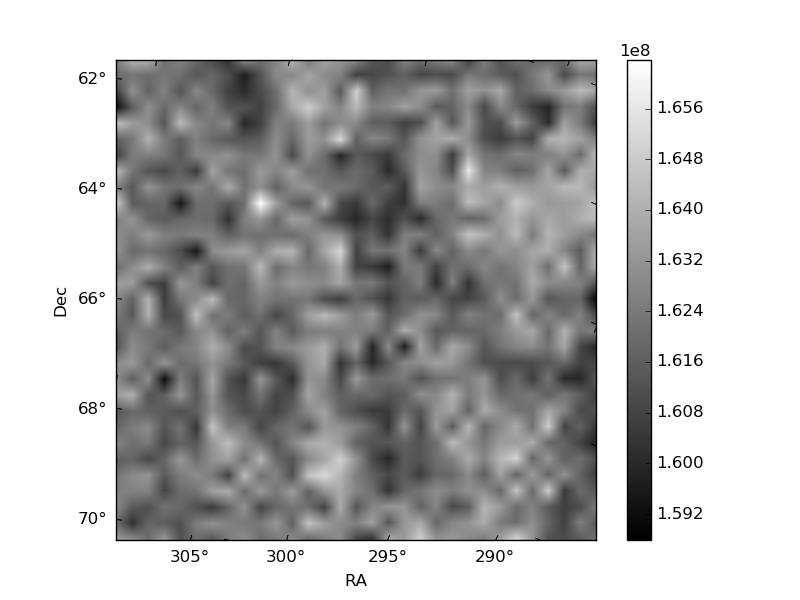
Histogram calculated using DETX and DETY for each event in the final _common_clean file
| Quadrant A | 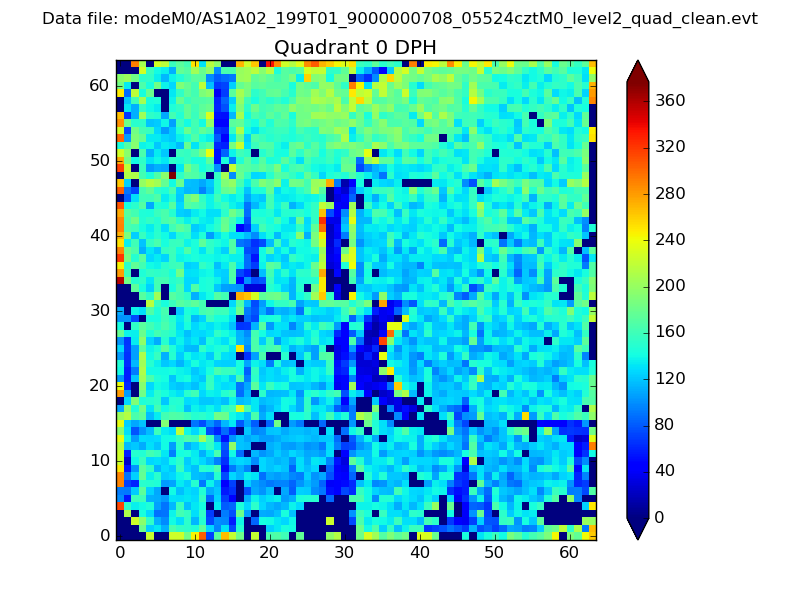 |
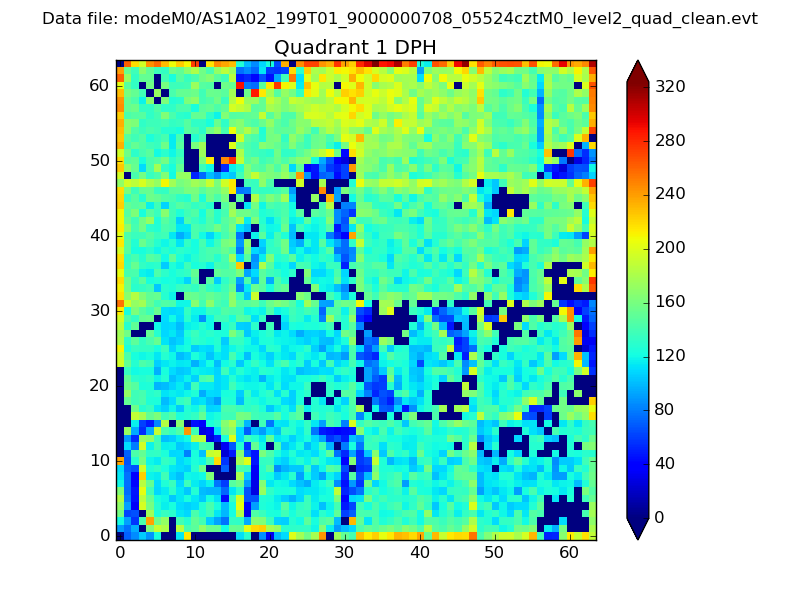 |
Quadrant B |
|---|---|---|---|
| Quadrant D | 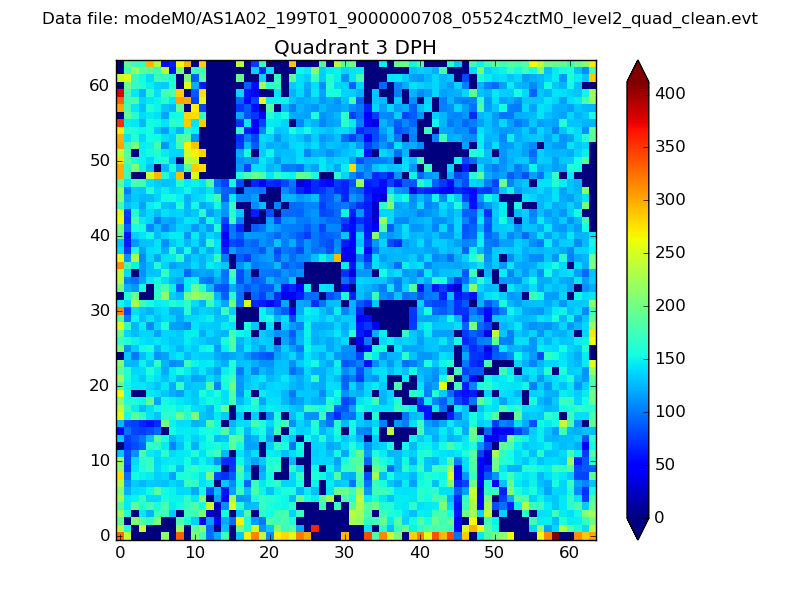 |
 |
Quadrant C |
| Plot type | Count rate plots | Images |
|---|---|---|
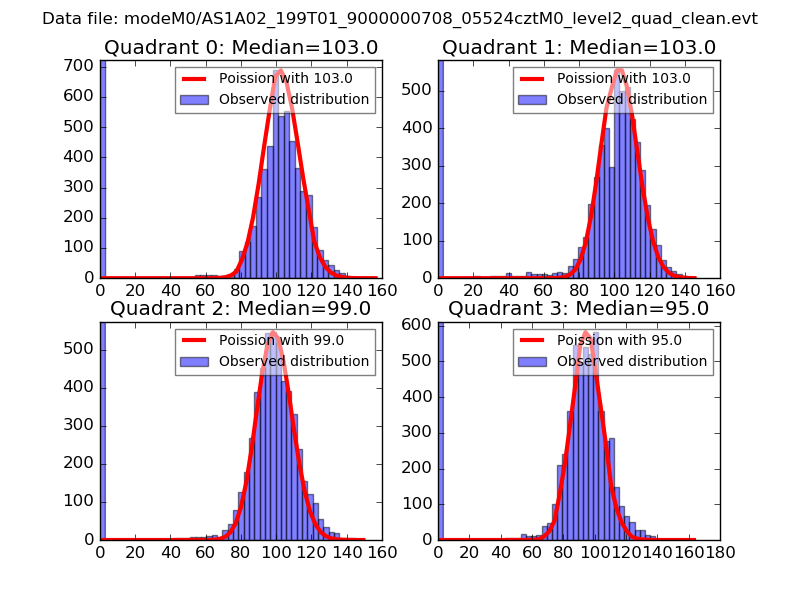
| Comparison with Poisson distribution Blue bars denote a histogram of data divided into 1 sec bins. Red curve is a Poisson curve with rate = median count rate of data. |
 |
 |
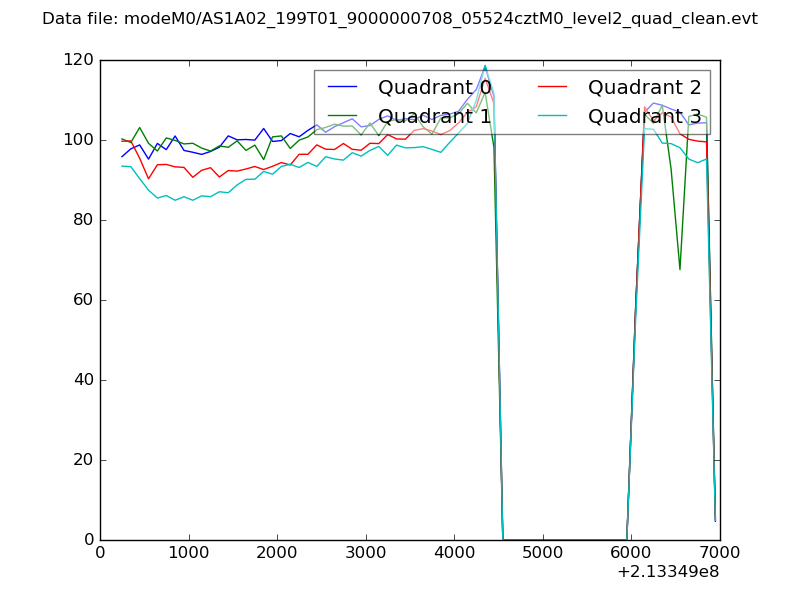
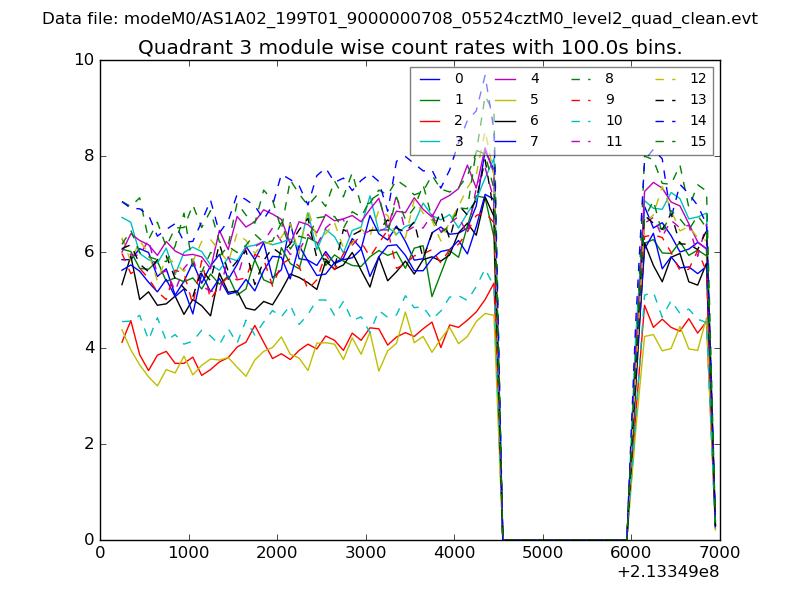
| Quadrant-wise count rates Data is divided into 100 sec bins |
 |
|
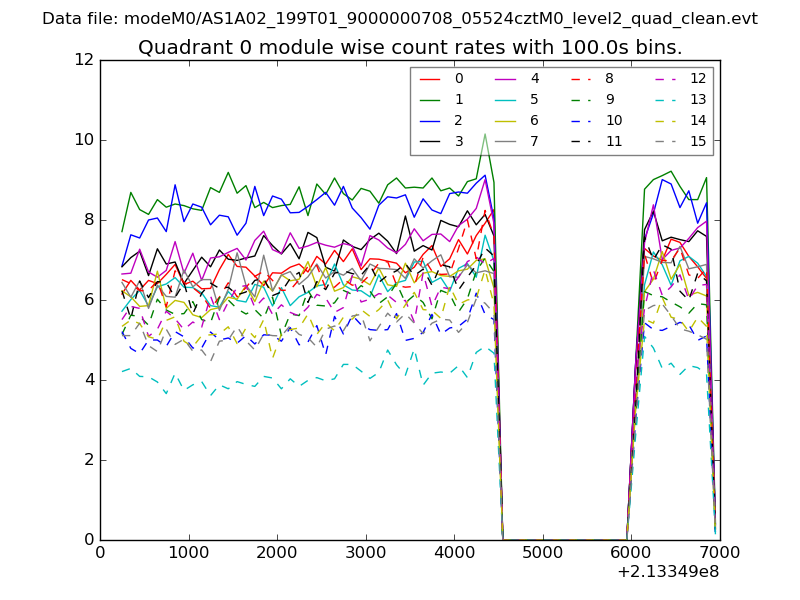
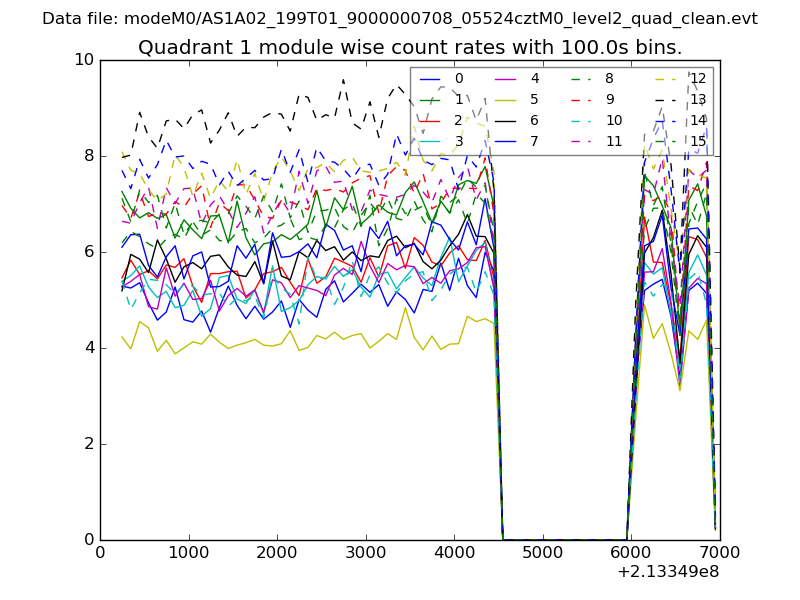
| Module-wise count rates for Quadrant A Data is divided into 100 sec bins |
 |
 |
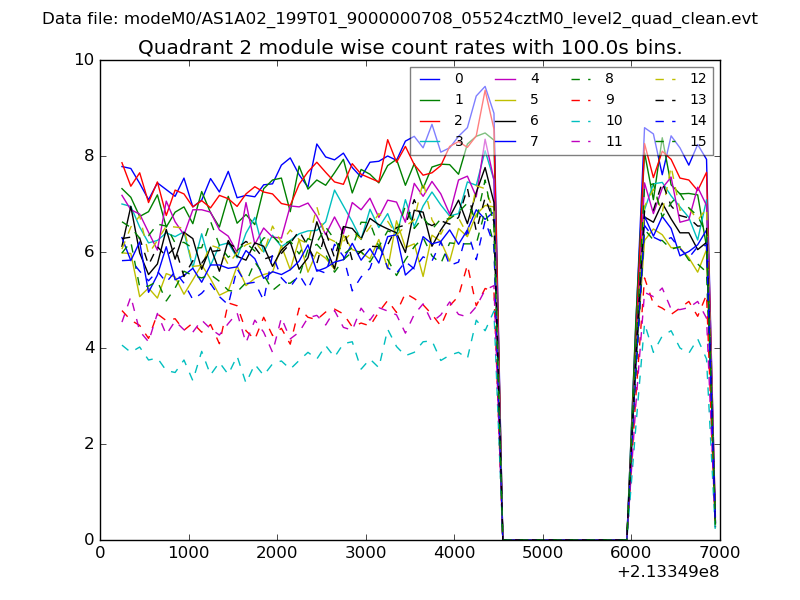
| Module-wise count rates for Quadrant B Data is divided into 100 sec bins |
 |
 |
| Module-wise count rates for Quadrant C Data is divided into 100 sec bins |
 |
 |
| Module-wise count rates for Quadrant D Data is divided into 100 sec bins |
 |
 |
| Parameter | Plot |
|---|---|
| CZT HV Monitor | 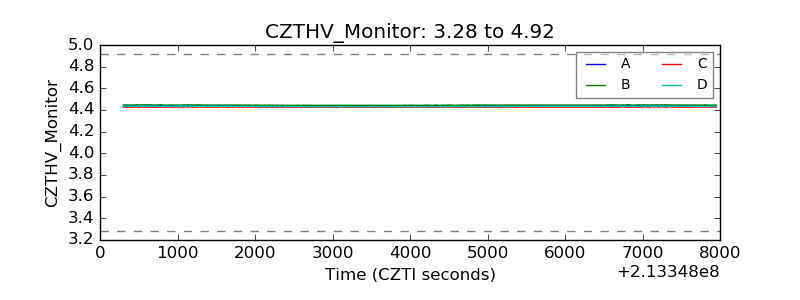 |
| D_VDD | 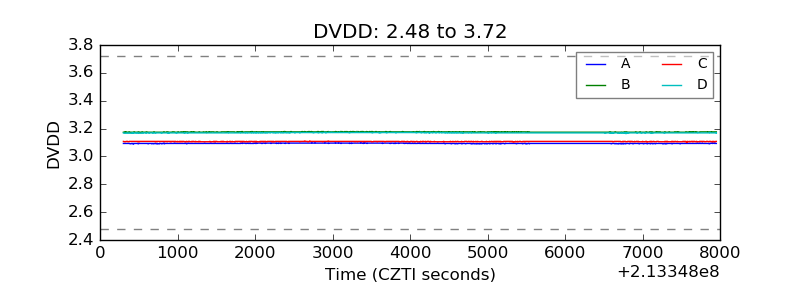 |
| Temperature 1 | 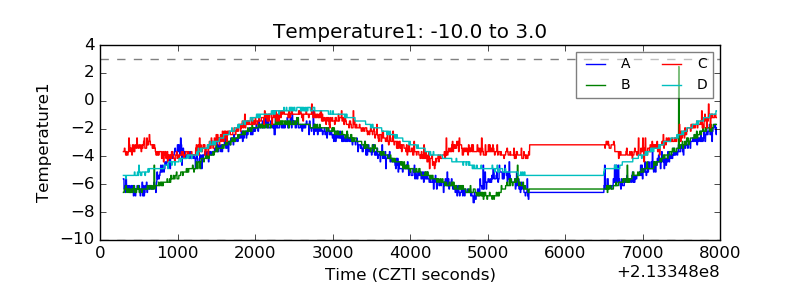 |
| Veto HV Monitor | 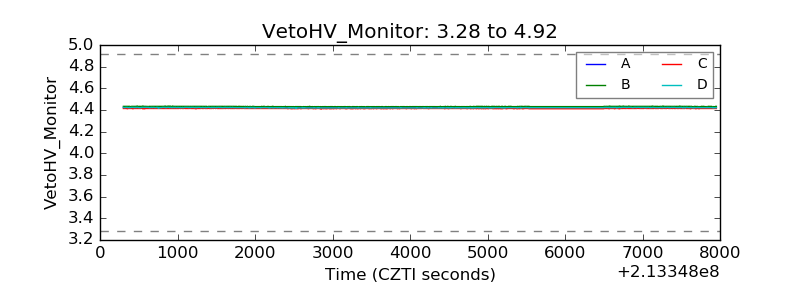 |
| Veto LLD | 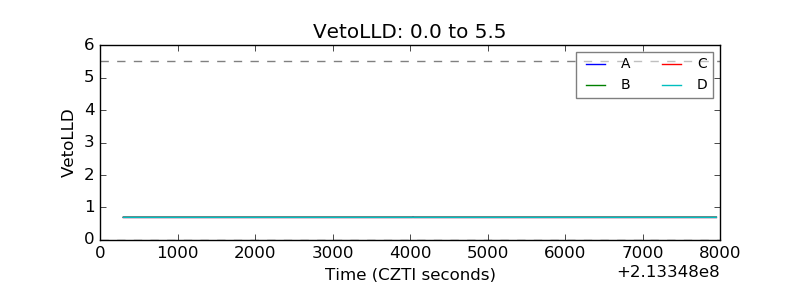 |
| Alpha Counter | 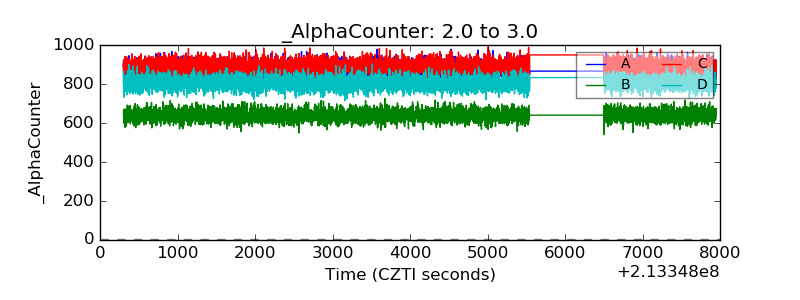 |
| _CPM_Rate | 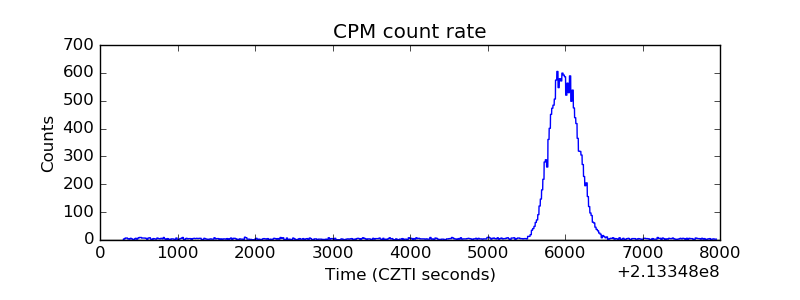 |
| CZT Counter | 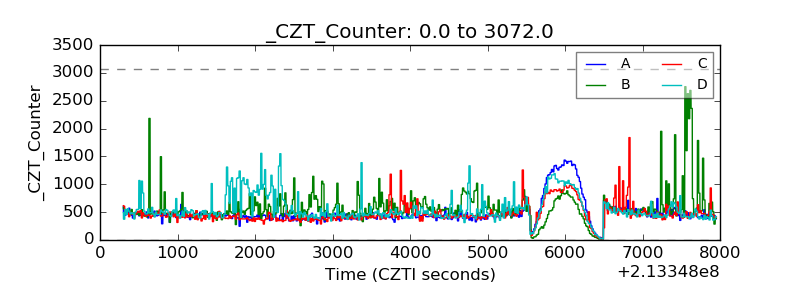 |
| +2.5 Volts monitor | 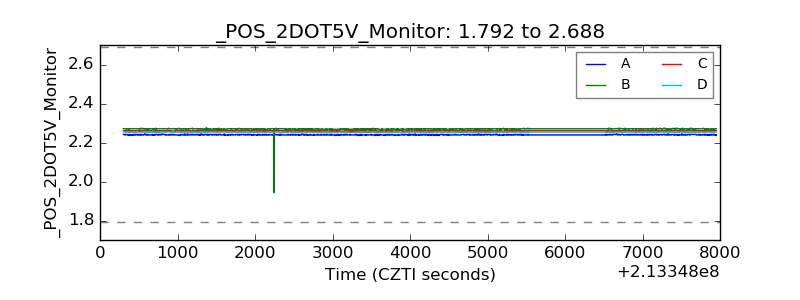 |
| +5 Volts monitor |  |
| _ROLL_ROT | 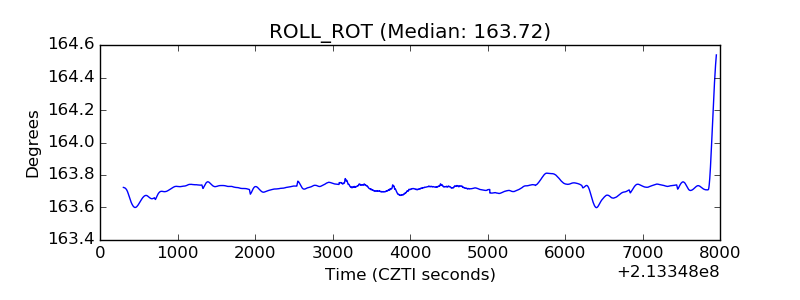 |
| _Roll_DEC | 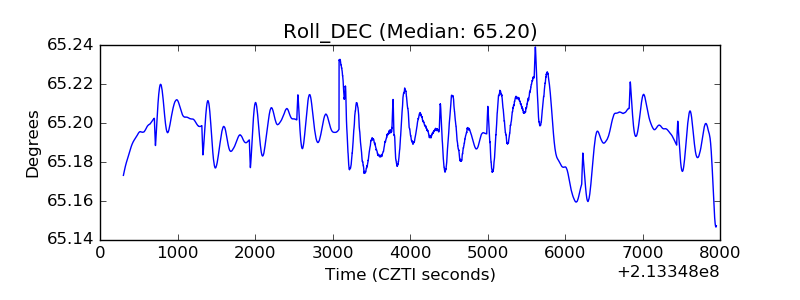 |
| _Roll_RA | 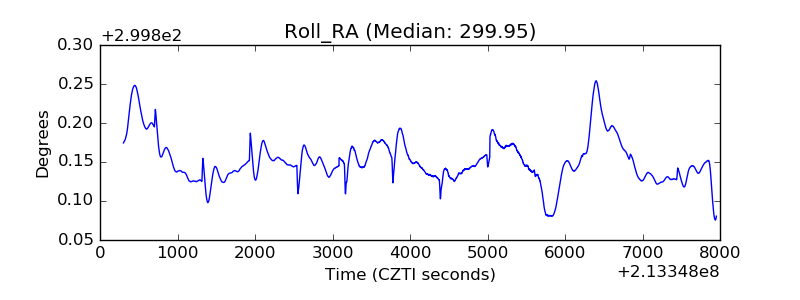 |
| Veto Counter | 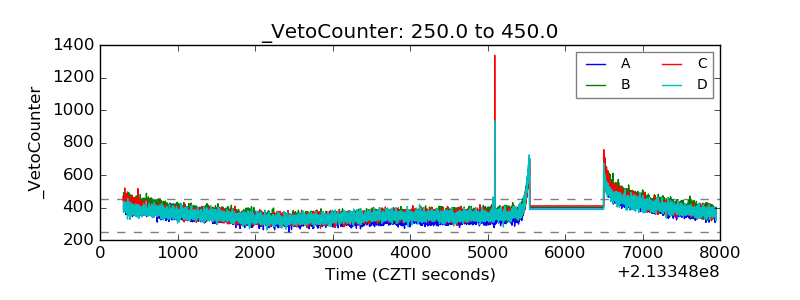 |