| Param | Original file | Final file |
|---|---|---|
| Filename | modeM0/AS1A02_199T01_9000000708_05527cztM0_level2.evt | modeM0/AS1A02_199T01_9000000708_05527cztM0_level2_quad_clean.evt |
| Size (bytes) | 447,946,560 | 101,963,520 |
| Size | 427.2 MB | 97.2 MB |
| Events in quadrant A | 3,078,924 | 683,035 |
| Events in quadrant B | 3,616,836 | 676,891 |
| Events in quadrant C | 3,133,981 | 644,320 |
| Events in quadrant D | 3,288,475 | 624,346 |
| Mode M0 | |||
|---|---|---|---|
| Quadrant | BADHDUFLAG | Total packets | Discarded packets |
| A | 0 | 13594 | 2 |
| B | 0 | 15026 | 1 |
| C | 0 | 13841 | 1 |
| D | 0 | 14331 | 1 |
| Mode SS | |||
|---|---|---|---|
| Quadrant | BADHDUFLAG | Total packets | Discarded packets |
| A | 0 | 134 | 0 |
| B | 0 | 134 | 0 |
| C | 0 | 134 | 0 |
| D | 0 | 134 | 0 |
| Mode M9 | |||
|---|---|---|---|
| Quadrant | BADHDUFLAG | Total packets | Discarded packets |
| A | 0 | 12 | 0 |
| B | 0 | 12 | 0 |
| C | 0 | 12 | 0 |
| D | 0 | 12 | 0 |
| Quadrant | Total seconds | Saturated seconds | Saturation percentage |
|---|---|---|---|
| A | 6588 | 74 | 1.123254% |
| B | 6588 | 88 | 1.335762% |
| C | 6588 | 46 | 0.698239% |
| D | 6588 | 76 | 1.153613% |
Noise dominated data is calculated using 1-second bins in cleaned event files. If a bin has >2000 counts, and if more than 50% of those come from <1% of pixels, then it is considered to be noise-dominated and hence unusable.
| Quadrant | # 1 sec bins | Bins with >0 counts | Bins with >2000 counts | High rate bins dominated by noise | Noise dominated (total time) | Noise dominated (detector-on time) | Marked lightcurve |
|---|---|---|---|---|---|---|---|
| A | 7763 | 6589 | 4 | 4 | 0.05% | 0.06% | 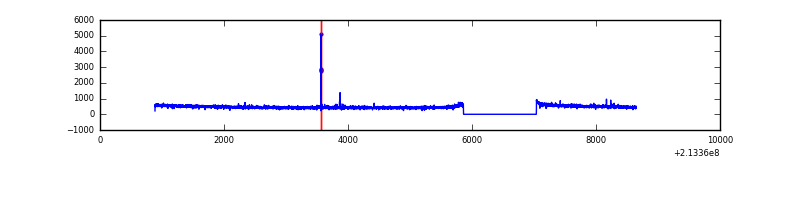 |
| B | 7763 | 6589 | 23 | 23 | 0.30% | 0.35% | 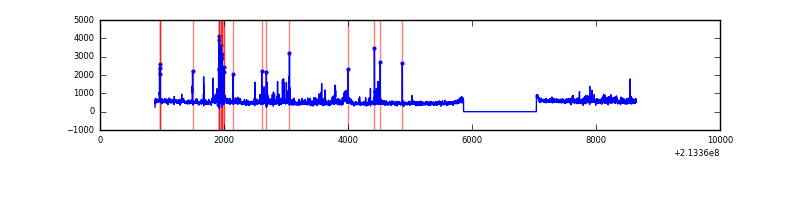 |
| C | 7763 | 6589 | 1 | 1 | 0.01% | 0.02% |  |
| D | 7763 | 6589 | 20 | 20 | 0.26% | 0.30% | 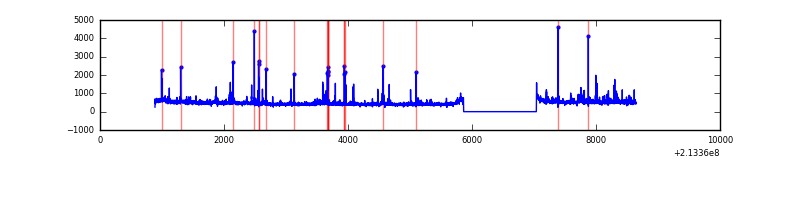 |
Top three noisy pixels from each quadrant. If the there are fewer than three noisy pixels in the level2.evt file, extra rows are filled as -1
| Pixel properties | Quadrant properties | ||||||
|---|---|---|---|---|---|---|---|
| Quadrant | DetID | PixID | Counts | Sigma | Mean | Median | Sigma |
| A | 0 | 50 | 22215 | 135.8 | 789 | 773 | 157.9 |
| A | 0 | 226 | 7961 | 45.52 | 789 | 773 | 157.9 |
| A | 12 | 194 | 7785 | 44.41 | 789 | 773 | 157.9 |
| B | 15 | 204 | 223872 | 1507.02 | 786 | 771 | 148.0 |
| B | 10 | 16 | 136414 | 916.25 | 786 | 771 | 148.0 |
| B | 4 | 48 | 47631 | 316.53 | 786 | 771 | 148.0 |
| C | 1 | 241 | 151865 | 877.72 | 753 | 755 | 172.2 |
| C | 1 | 16 | 26008 | 146.68 | 753 | 755 | 172.2 |
| C | 13 | 250 | 10268 | 55.25 | 753 | 755 | 172.2 |
| D | 2 | 152 | 147593 | 803.71 | 759 | 734 | 182.7 |
| D | 2 | 63 | 92713 | 503.37 | 759 | 734 | 182.7 |
| D | 2 | 14 | 40528 | 217.78 | 759 | 734 | 182.7 |
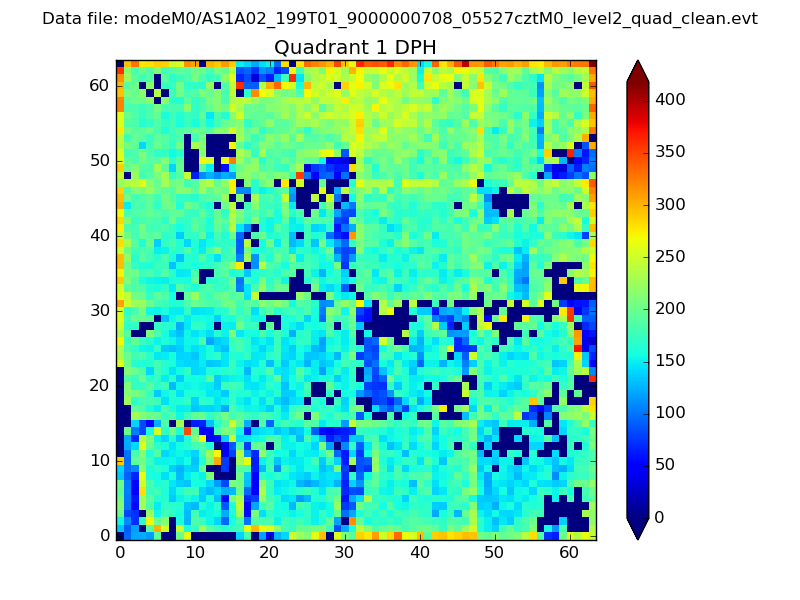
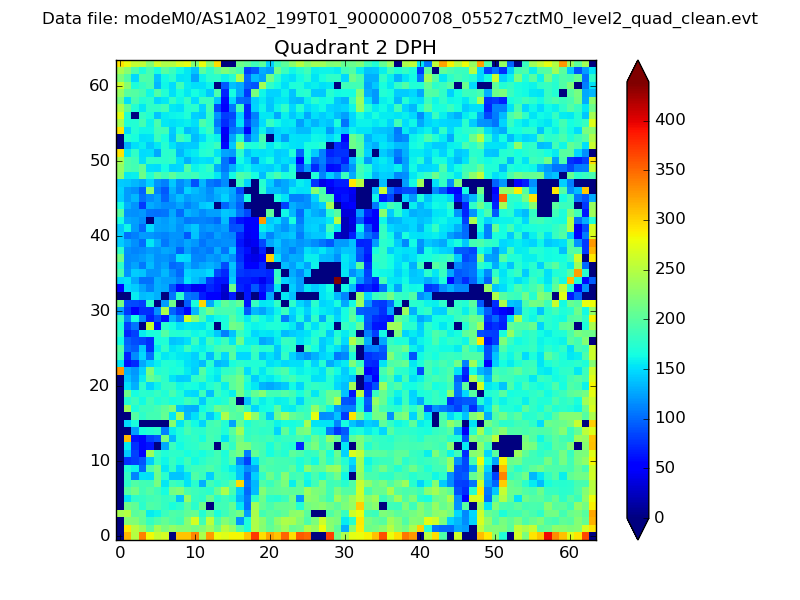
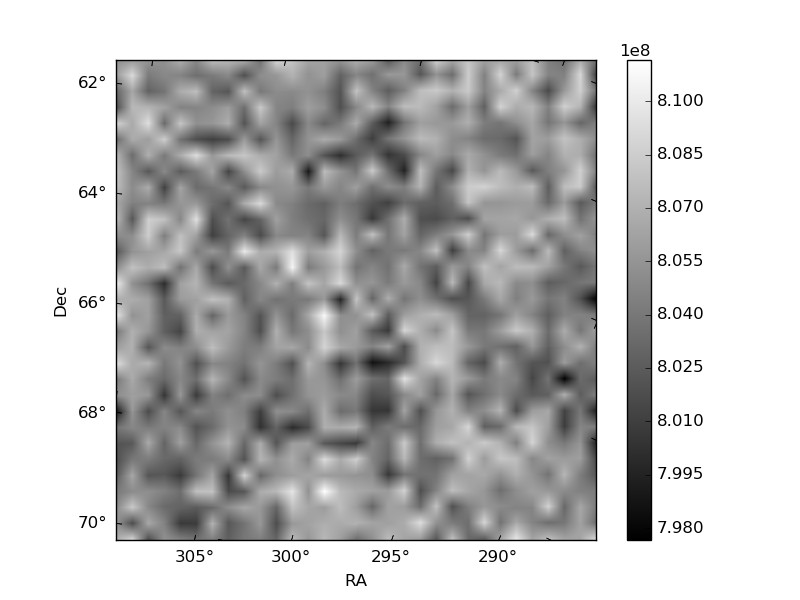
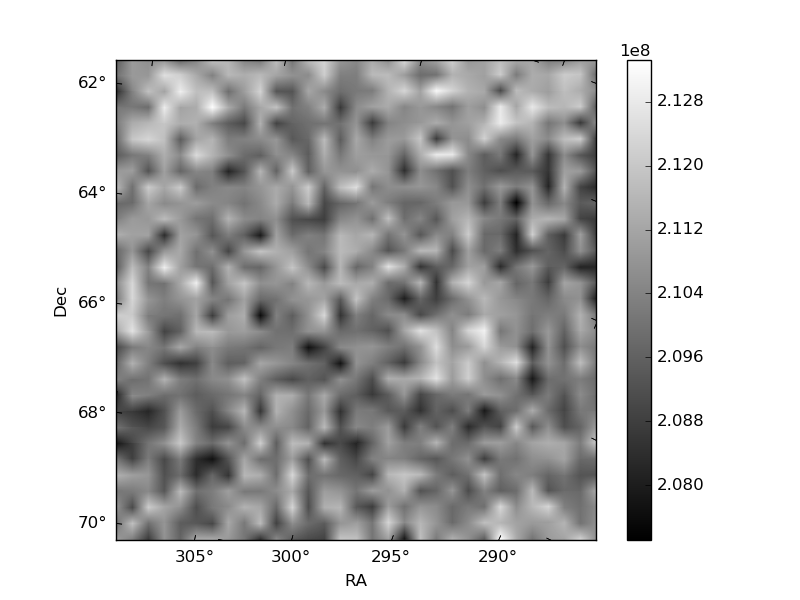
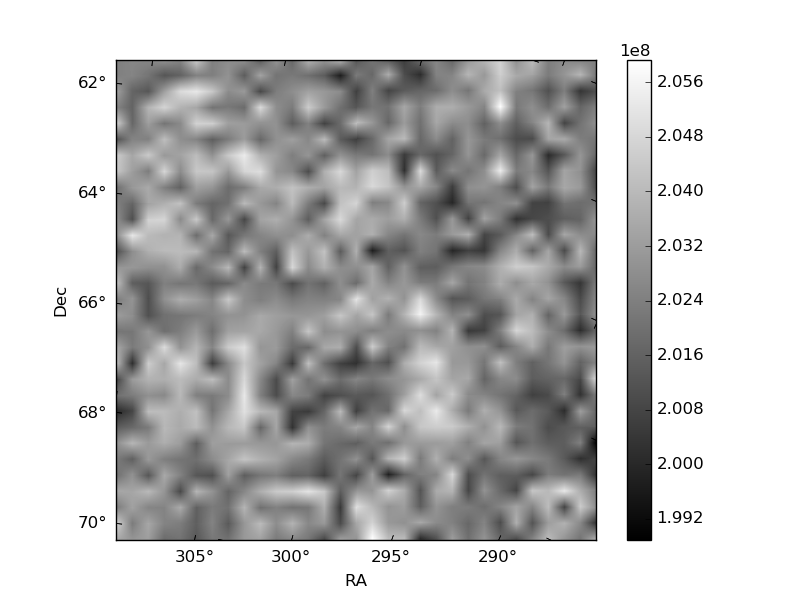
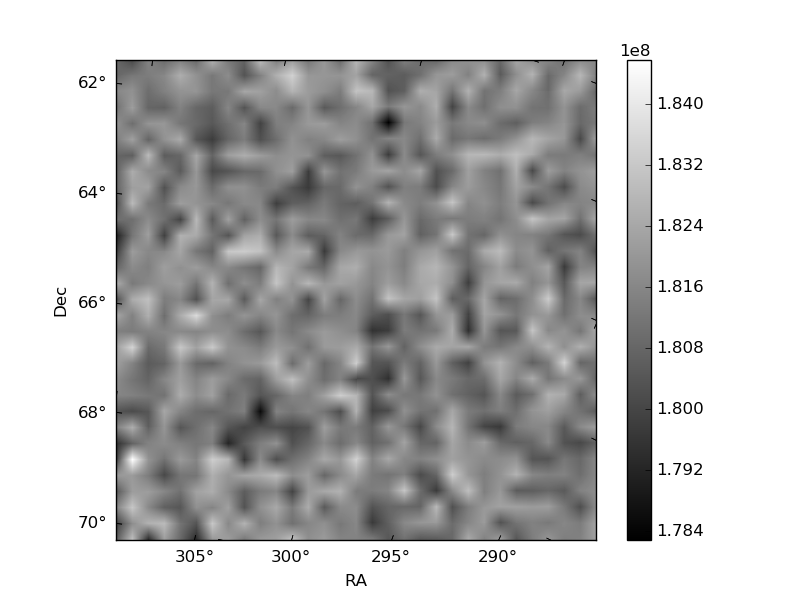
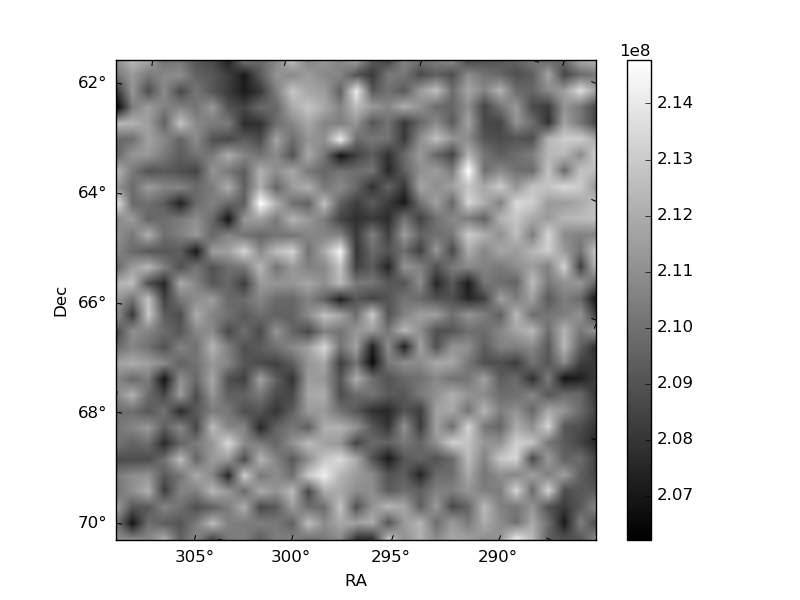
Histogram calculated using DETX and DETY for each event in the final _common_clean file
| Quadrant A | 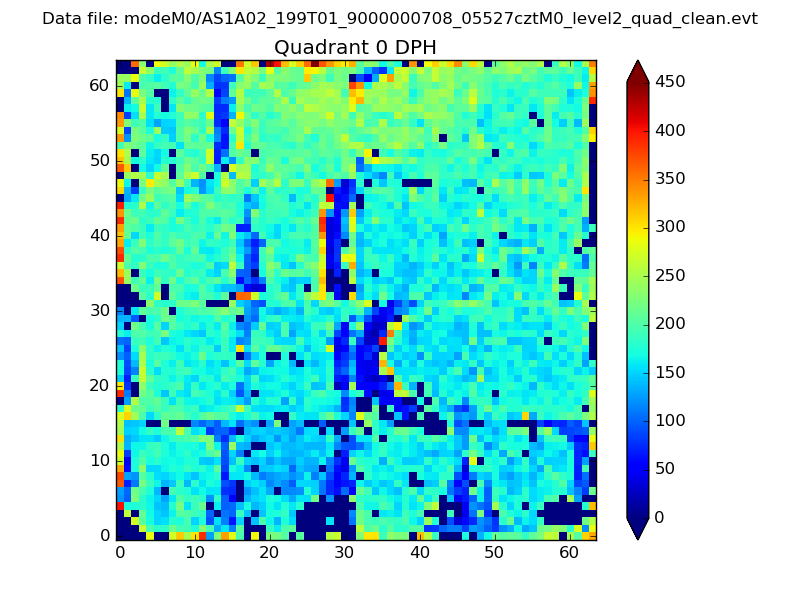 |
 |
Quadrant B |
|---|---|---|---|
| Quadrant D | 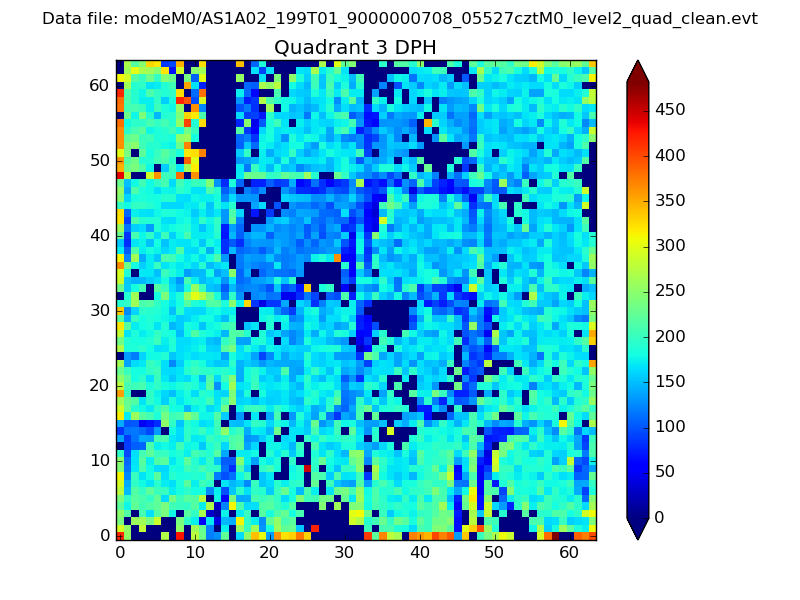 |
 |
Quadrant C |
| Plot type | Count rate plots | Images |
|---|---|---|
| Comparison with Poisson distribution Blue bars denote a histogram of data divided into 1 sec bins. Red curve is a Poisson curve with rate = median count rate of data. |
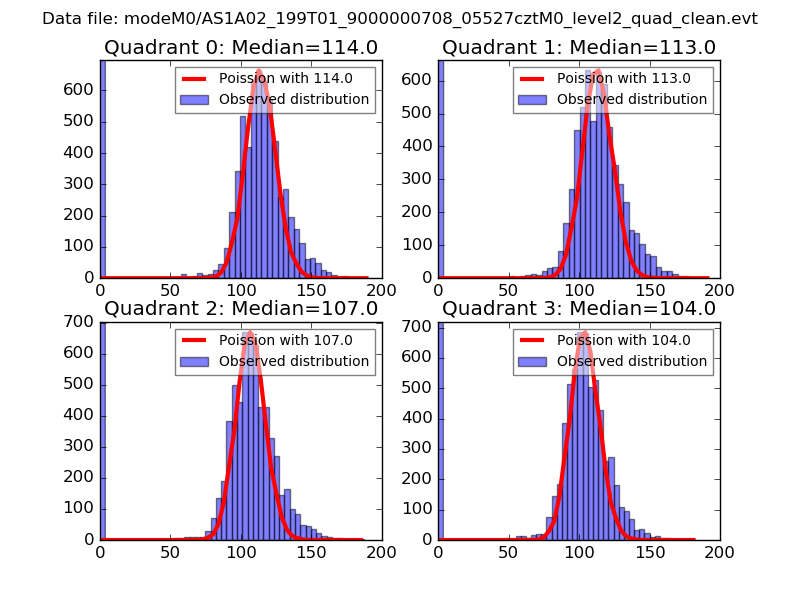 |
 |
| Quadrant-wise count rates Data is divided into 100 sec bins |
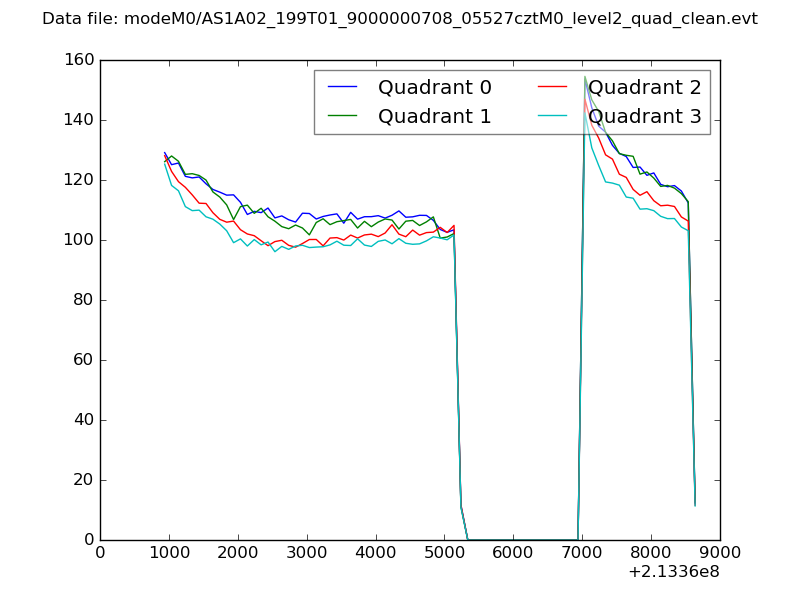 |
|
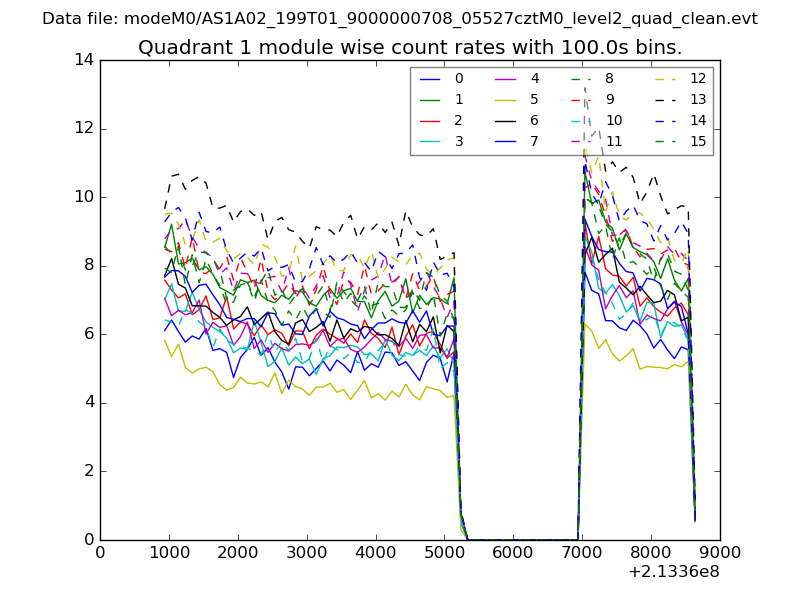
| Module-wise count rates for Quadrant A Data is divided into 100 sec bins |
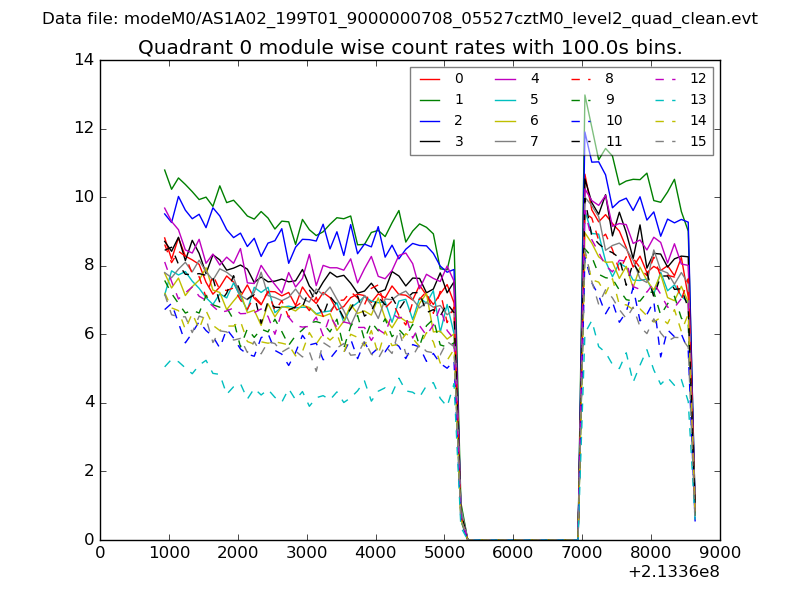 |
 |
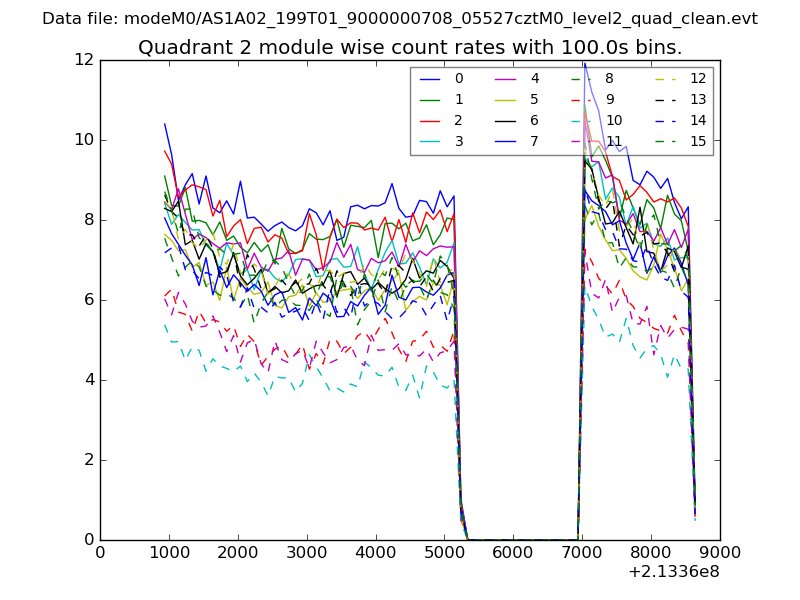
| Module-wise count rates for Quadrant B Data is divided into 100 sec bins |
 |
 |
| Module-wise count rates for Quadrant C Data is divided into 100 sec bins |
 |
 |
| Module-wise count rates for Quadrant D Data is divided into 100 sec bins |
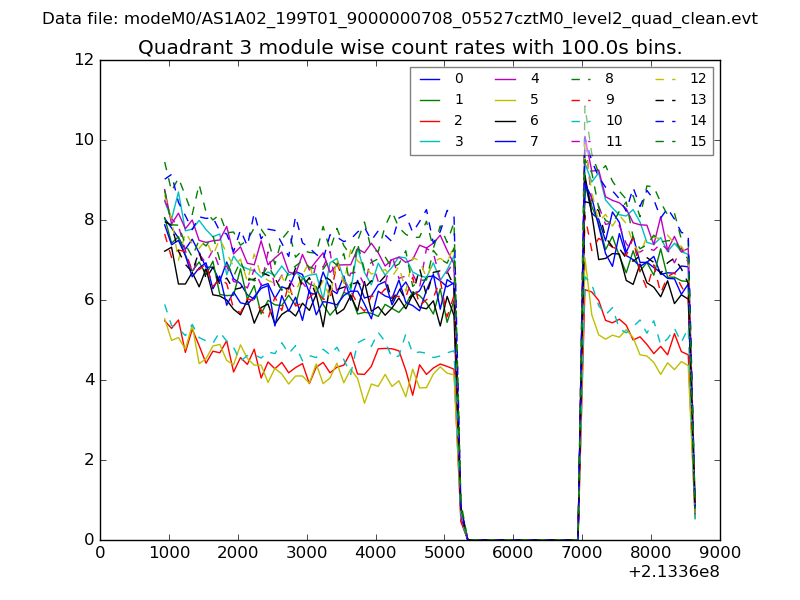 |
 |
| Parameter | Plot |
|---|---|
| CZT HV Monitor | 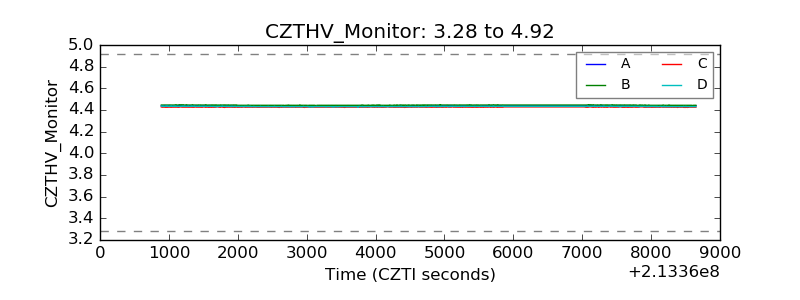 |
| D_VDD | 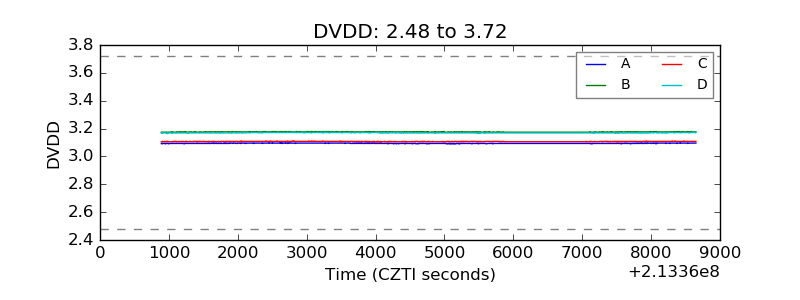 |
| Temperature 1 | 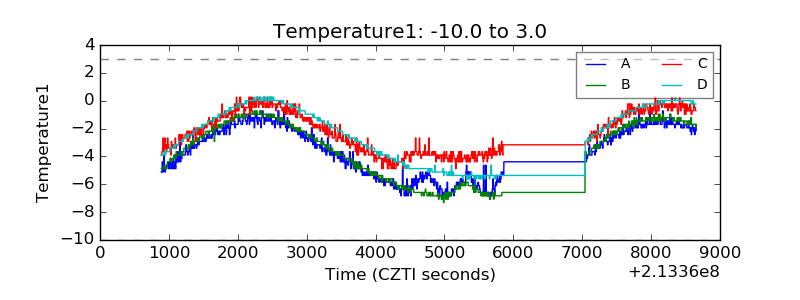 |
| Veto HV Monitor |  |
| Veto LLD | 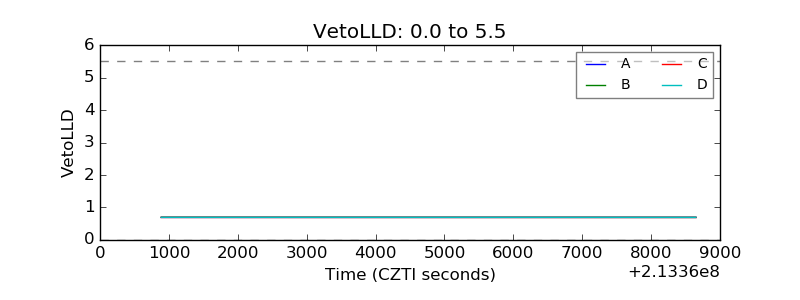 |
| Alpha Counter | 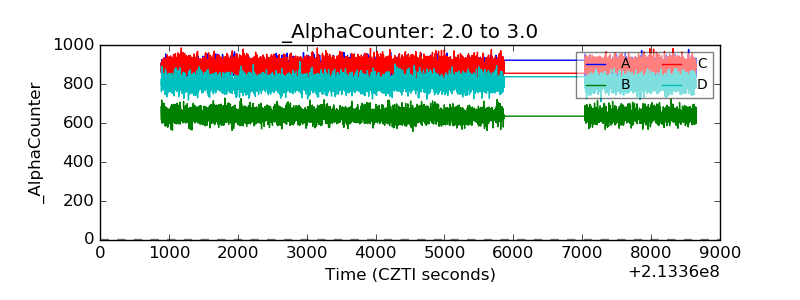 |
| _CPM_Rate | 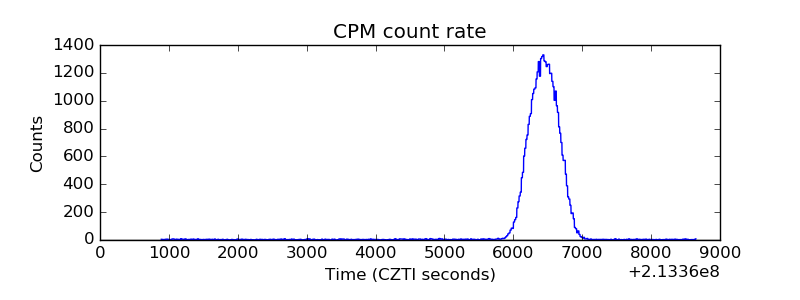 |
| CZT Counter | 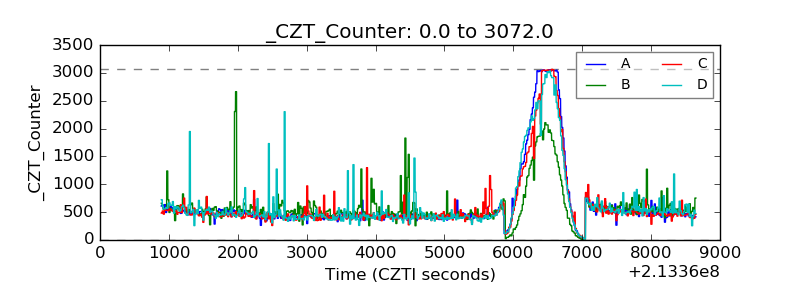 |
| +2.5 Volts monitor | 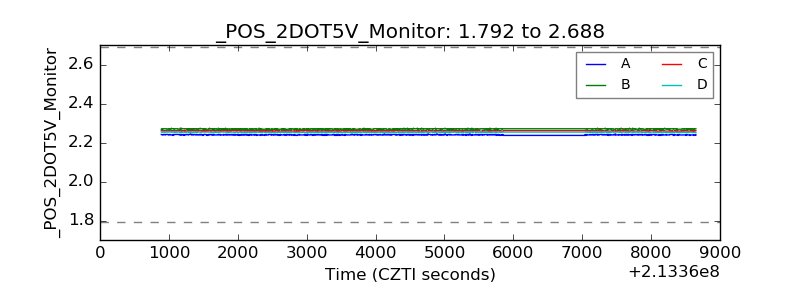 |
| +5 Volts monitor |  |
| _ROLL_ROT | 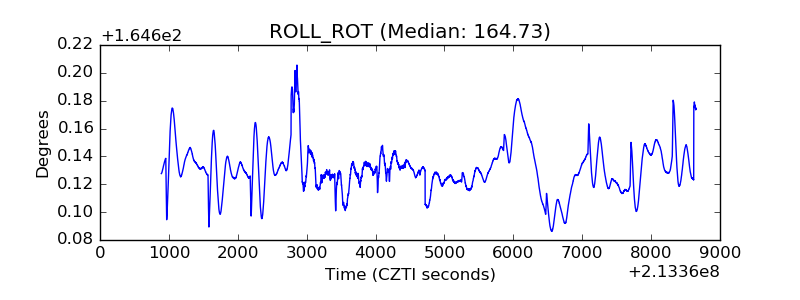 |
| _Roll_DEC | 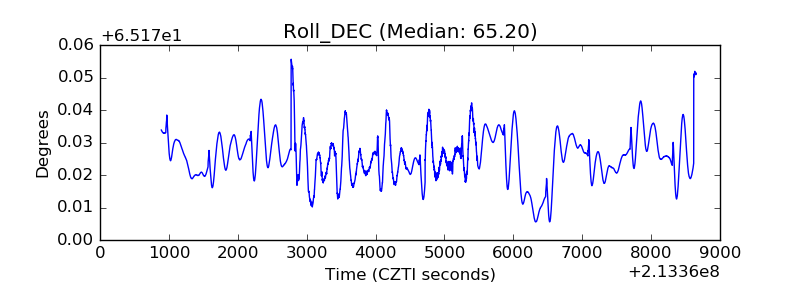 |
| _Roll_RA | 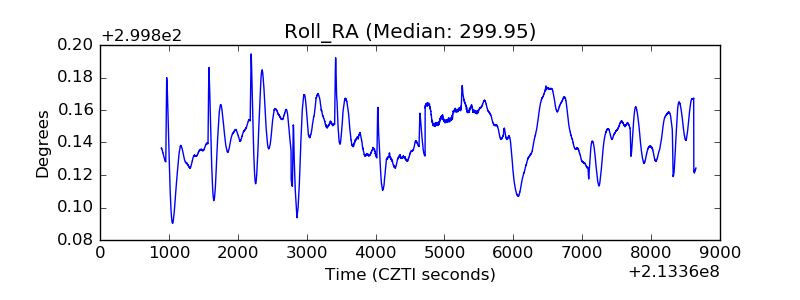 |
| Veto Counter | 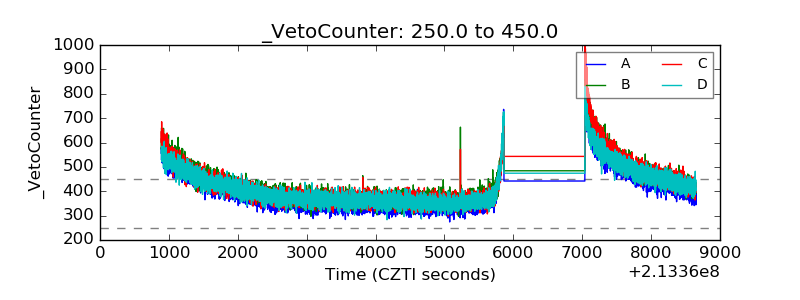 |