| Param | Original file | Final file |
|---|---|---|
| Filename | modeM0/AS1A02_199T01_9000000708_05528cztM0_level2.evt | modeM0/AS1A02_199T01_9000000708_05528cztM0_level2_quad_clean.evt |
| Size (bytes) | 404,994,240 | 86,336,640 |
| Size | 386.2 MB | 82.3 MB |
| Events in quadrant A | 2,829,204 | 569,446 |
| Events in quadrant B | 3,188,208 | 568,727 |
| Events in quadrant C | 2,703,803 | 544,946 |
| Events in quadrant D | 3,146,623 | 523,153 |
| Mode M0 | |||
|---|---|---|---|
| Quadrant | BADHDUFLAG | Total packets | Discarded packets |
| A | 0 | 12410 | 2 |
| B | 0 | 13363 | 1 |
| C | 0 | 12057 | 1 |
| D | 0 | 13283 | 1 |
| Mode SS | |||
|---|---|---|---|
| Quadrant | BADHDUFLAG | Total packets | Discarded packets |
| A | 0 | 120 | 0 |
| B | 0 | 120 | 0 |
| C | 0 | 120 | 0 |
| D | 0 | 120 | 0 |
| Mode M9 | |||
|---|---|---|---|
| Quadrant | BADHDUFLAG | Total packets | Discarded packets |
| A | 0 | 12 | 0 |
| B | 0 | 12 | 0 |
| C | 0 | 12 | 0 |
| D | 0 | 12 | 0 |
| Quadrant | Total seconds | Saturated seconds | Saturation percentage |
|---|---|---|---|
| A | 5838 | 104 | 1.781432% |
| B | 5838 | 50 | 0.856458% |
| C | 5838 | 51 | 0.873587% |
| D | 5838 | 101 | 1.730045% |
Noise dominated data is calculated using 1-second bins in cleaned event files. If a bin has >2000 counts, and if more than 50% of those come from <1% of pixels, then it is considered to be noise-dominated and hence unusable.
| Quadrant | # 1 sec bins | Bins with >0 counts | Bins with >2000 counts | High rate bins dominated by noise | Noise dominated (total time) | Noise dominated (detector-on time) | Marked lightcurve |
|---|---|---|---|---|---|---|---|
| A | 7073 | 5839 | 41 | 41 | 0.58% | 0.70% | 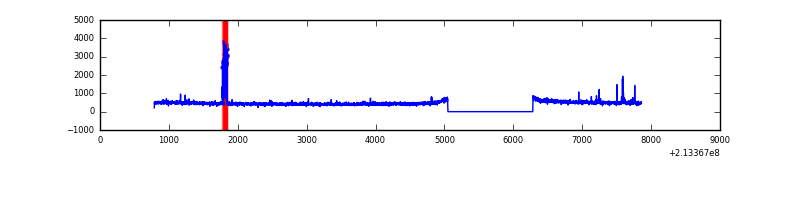 |
| B | 7073 | 5839 | 4 | 4 | 0.06% | 0.07% | 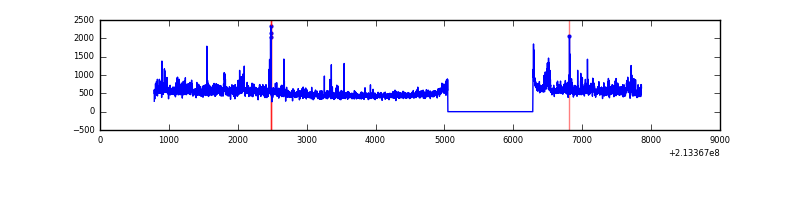 |
| C | 7073 | 5839 | 1 | 1 | 0.01% | 0.02% | 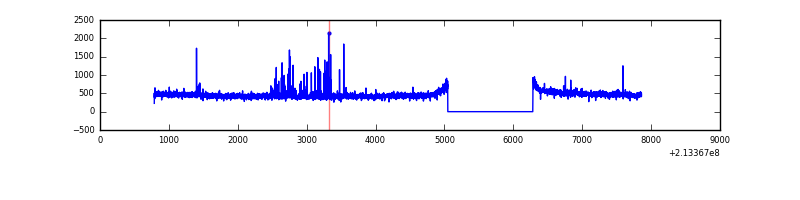 |
| D | 7073 | 5839 | 29 | 29 | 0.41% | 0.50% | 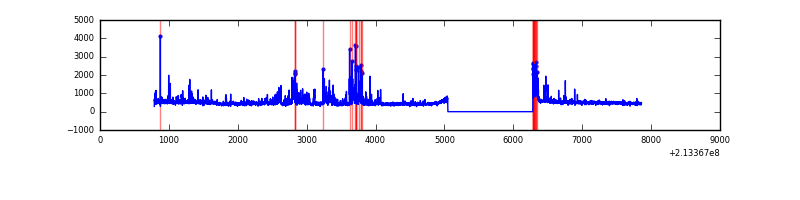 |
Top three noisy pixels from each quadrant. If the there are fewer than three noisy pixels in the level2.evt file, extra rows are filled as -1
| Pixel properties | Quadrant properties | ||||||
|---|---|---|---|---|---|---|---|
| Quadrant | DetID | PixID | Counts | Sigma | Mean | Median | Sigma |
| A | 0 | 50 | 133622 | 958.19 | 690 | 676 | 138.7 |
| A | 15 | 174 | 15547 | 107.18 | 690 | 676 | 138.7 |
| A | 4 | 2 | 10406 | 70.13 | 690 | 676 | 138.7 |
| B | 15 | 204 | 332978 | 2580.7 | 694 | 679 | 128.8 |
| B | 11 | 51 | 57913 | 444.49 | 694 | 679 | 128.8 |
| B | 4 | 48 | 35085 | 267.2 | 694 | 679 | 128.8 |
| C | 1 | 241 | 51220 | 325.74 | 673 | 677 | 155.2 |
| C | 1 | 16 | 22351 | 139.68 | 673 | 677 | 155.2 |
| C | 13 | 61 | 5459 | 30.82 | 673 | 677 | 155.2 |
| D | 12 | 233 | 202300 | 1245.47 | 672 | 653 | 161.9 |
| D | 12 | 79 | 168361 | 1035.85 | 672 | 653 | 161.9 |
| D | 2 | 152 | 102005 | 626.0 | 672 | 653 | 161.9 |
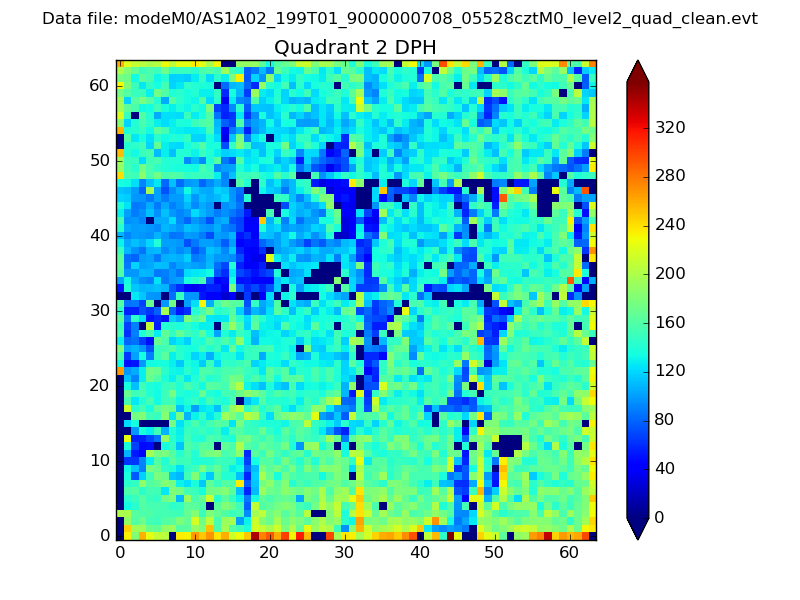
Histogram calculated using DETX and DETY for each event in the final _common_clean file
| Quadrant A | 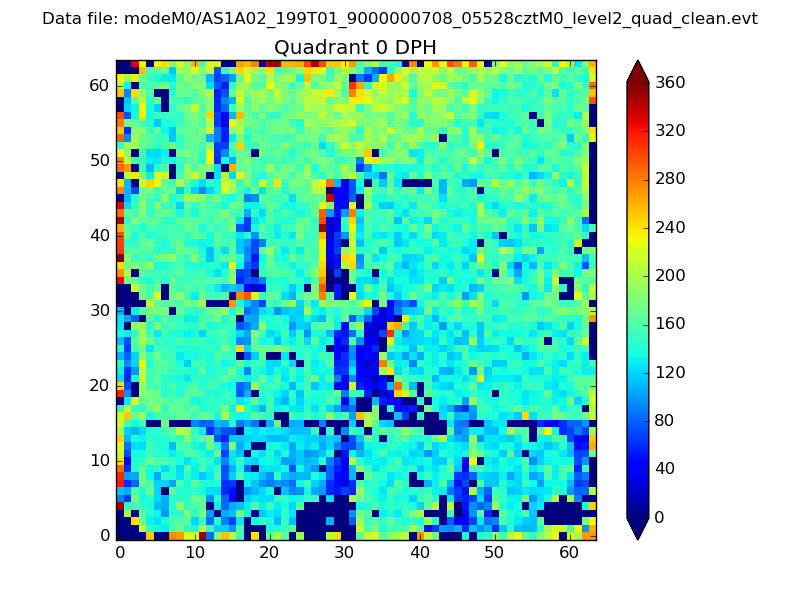 |
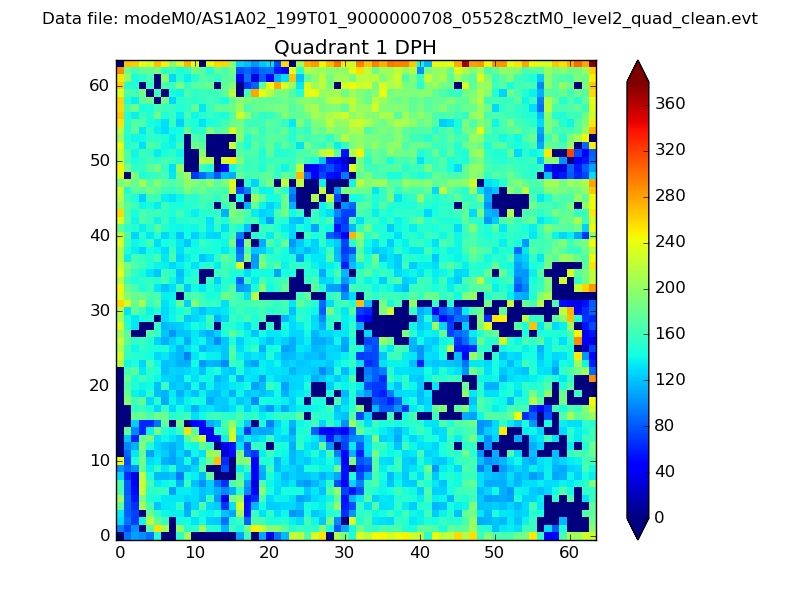 |
Quadrant B |
|---|---|---|---|
| Quadrant D | 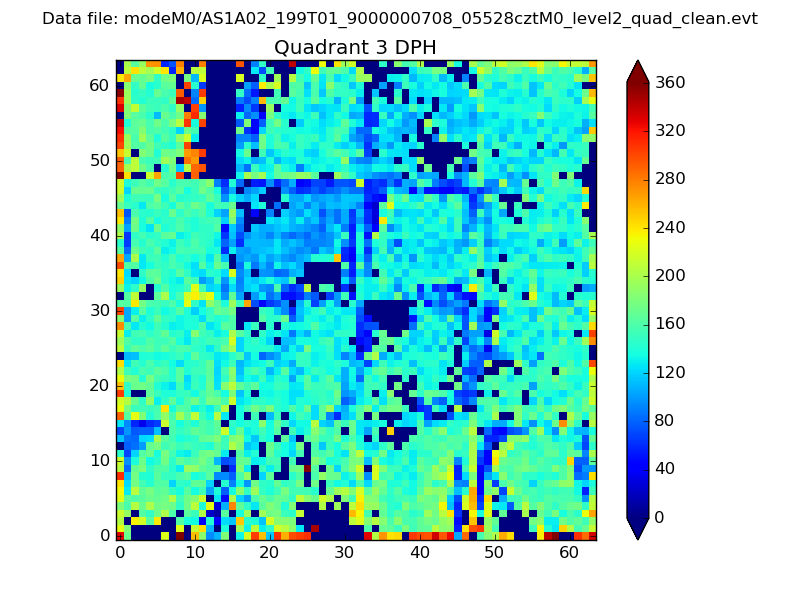 |
 |
Quadrant C |
| Plot type | Count rate plots | Images |
|---|---|---|
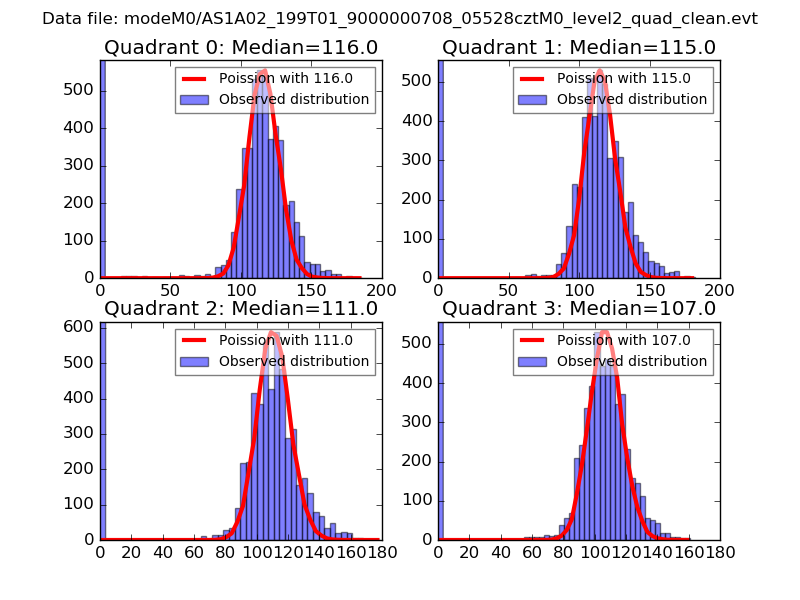
| Comparison with Poisson distribution Blue bars denote a histogram of data divided into 1 sec bins. Red curve is a Poisson curve with rate = median count rate of data. |
 |
 |
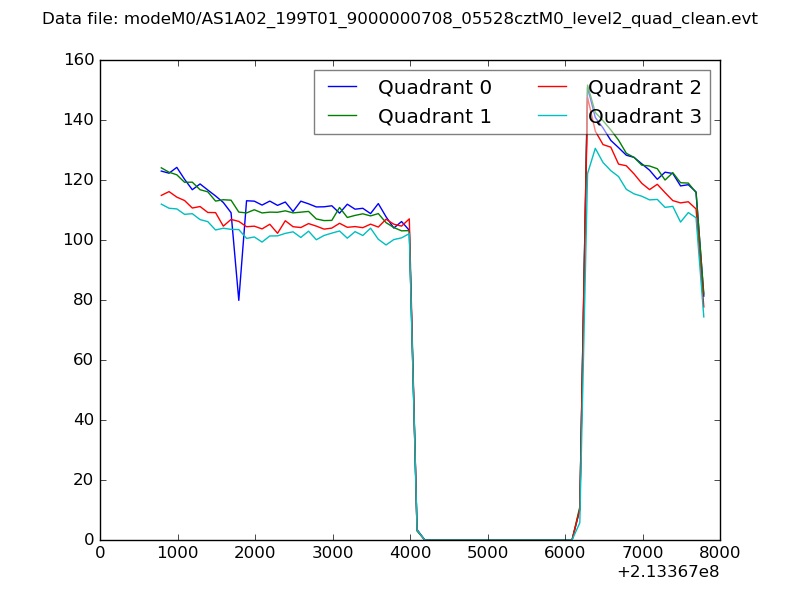
| Quadrant-wise count rates Data is divided into 100 sec bins |
 |
|
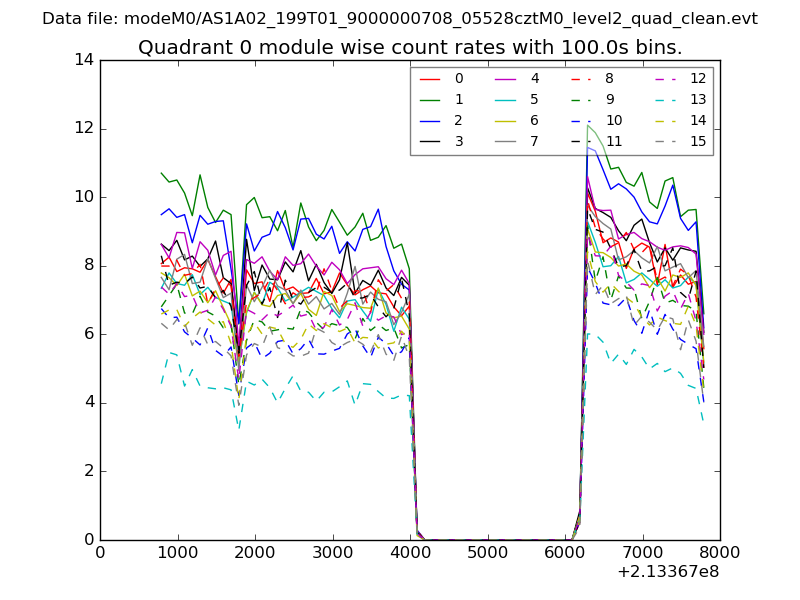
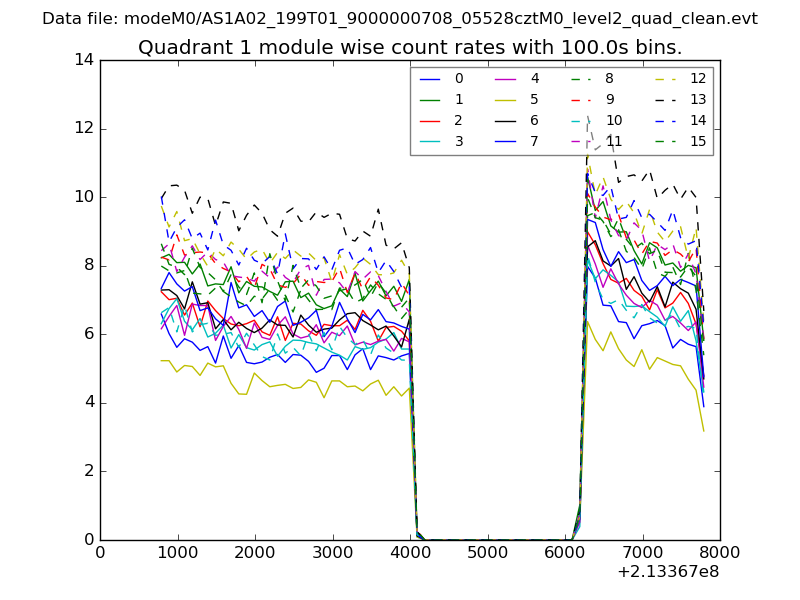
| Module-wise count rates for Quadrant A Data is divided into 100 sec bins |
 |
 |
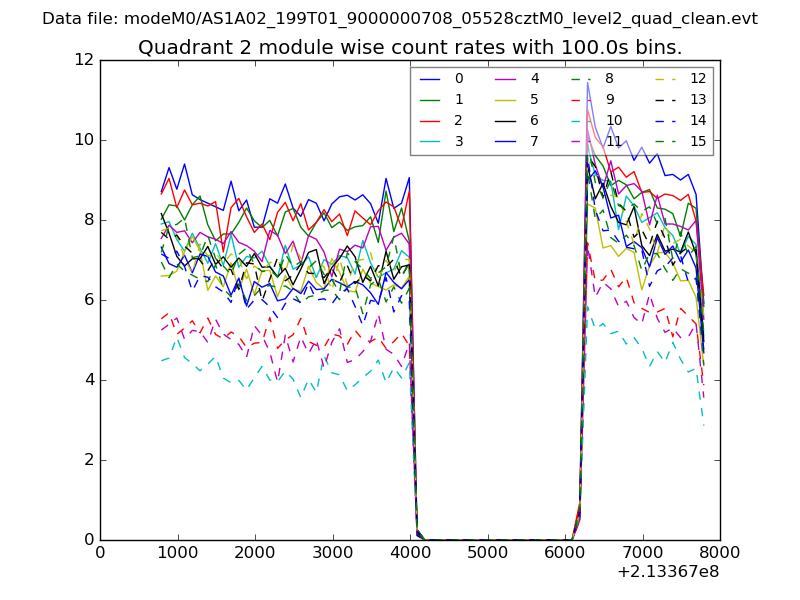
| Module-wise count rates for Quadrant B Data is divided into 100 sec bins |
 |
 |
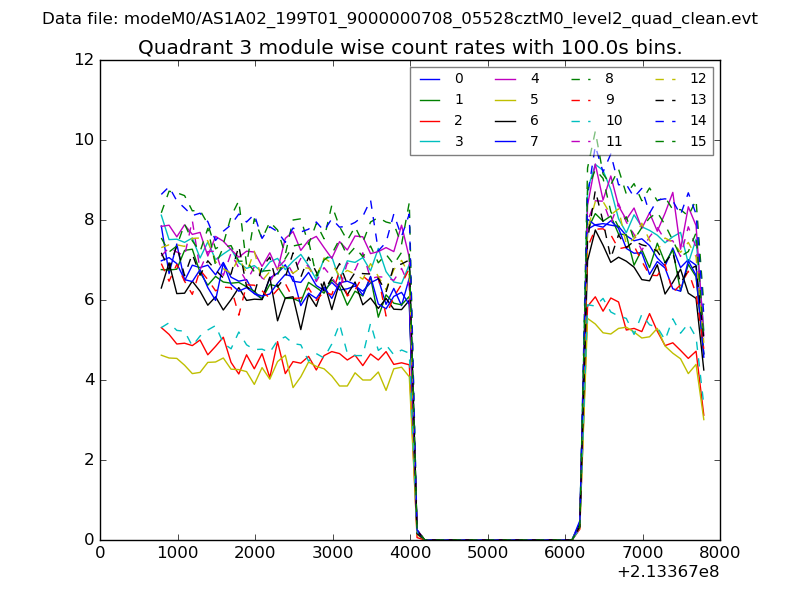
| Module-wise count rates for Quadrant C Data is divided into 100 sec bins |
 |
 |
| Module-wise count rates for Quadrant D Data is divided into 100 sec bins |
 |
 |
| Parameter | Plot |
|---|---|
| CZT HV Monitor | 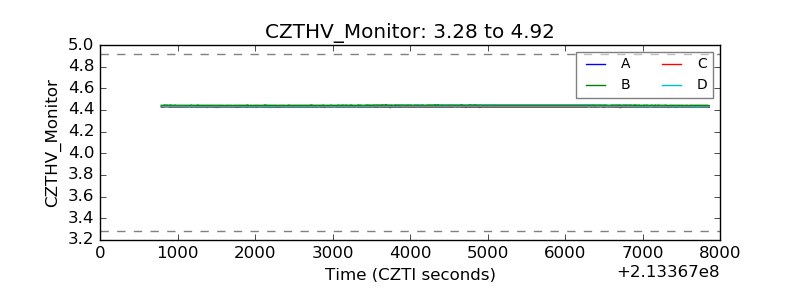 |
| D_VDD | 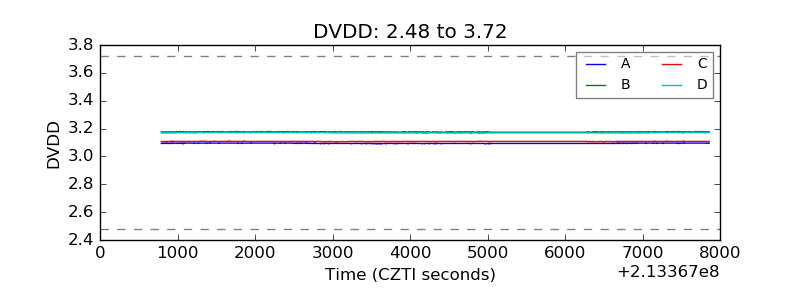 |
| Temperature 1 | 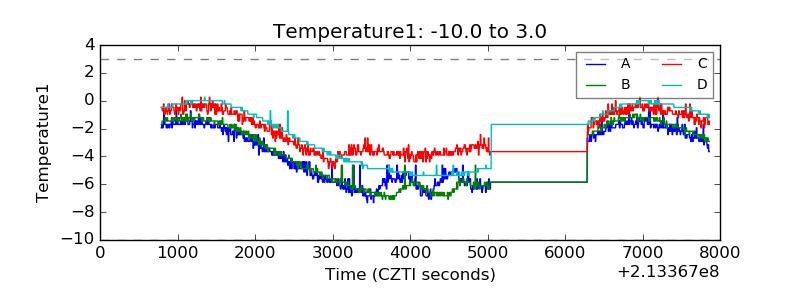 |
| Veto HV Monitor | 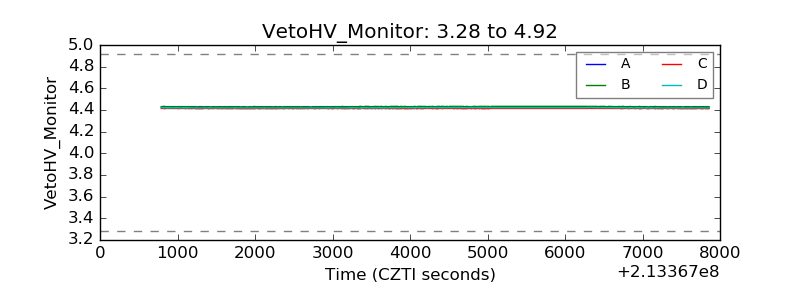 |
| Veto LLD | 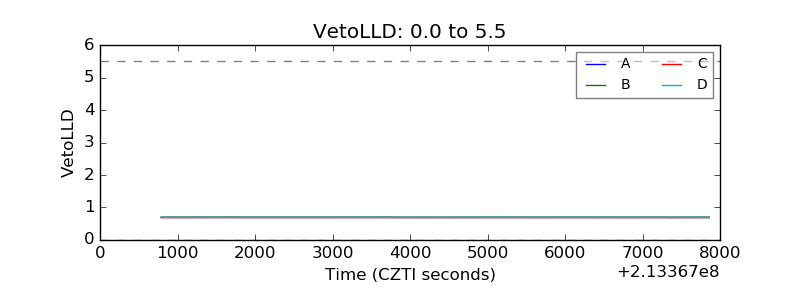 |
| Alpha Counter | 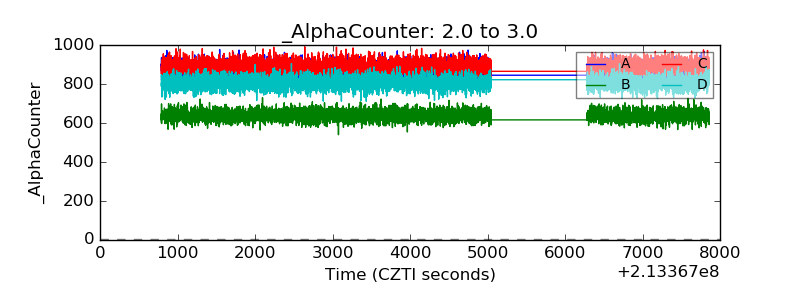 |
| _CPM_Rate | 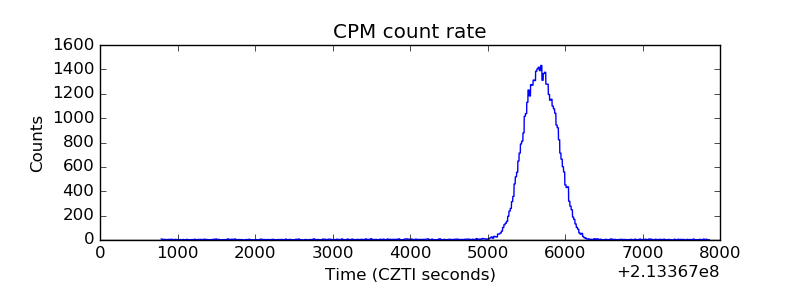 |
| CZT Counter | 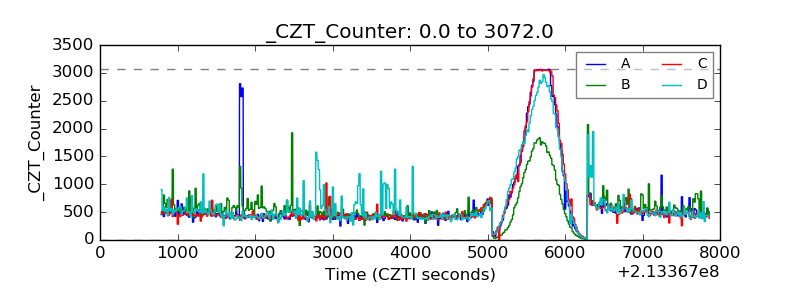 |
| +2.5 Volts monitor |  |
| +5 Volts monitor | 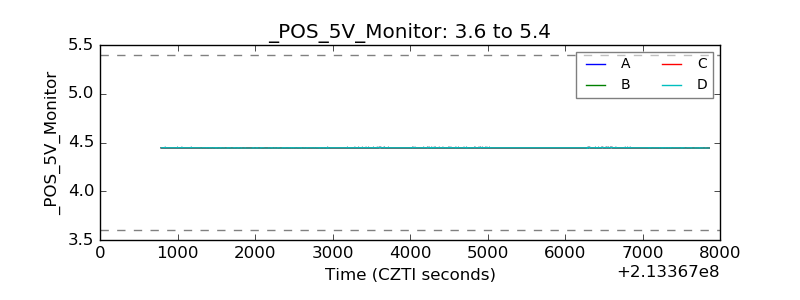 |
| _ROLL_ROT | 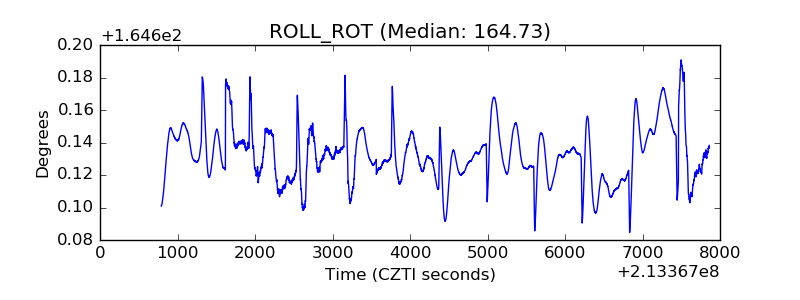 |
| _Roll_DEC | 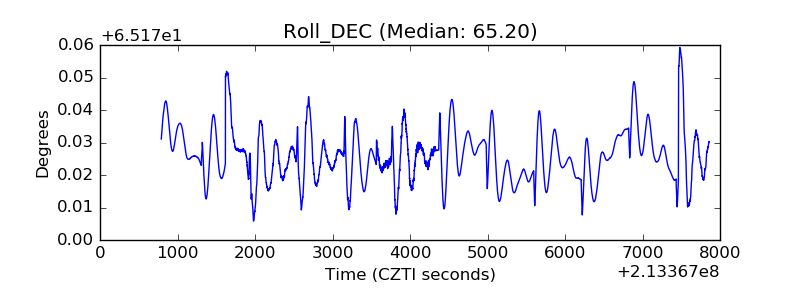 |
| _Roll_RA | 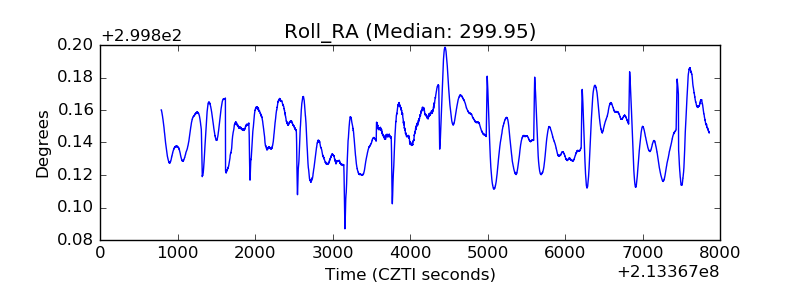 |
| Veto Counter | 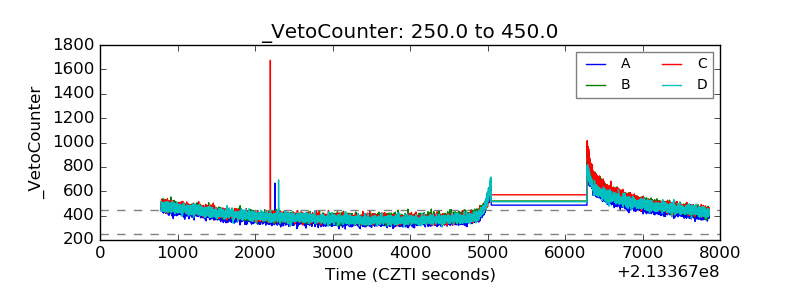 |