| Param | Original file | Final file |
|---|---|---|
| Filename | modeM0/AS1A02_199T01_9000000708_05530cztM0_level2.evt | modeM0/AS1A02_199T01_9000000708_05530cztM0_level2_quad_clean.evt |
| Size (bytes) | 196,424,640 | 51,505,920 |
| Size | 187.3 MB | 49.1 MB |
| Events in quadrant A | 1,397,649 | 344,215 |
| Events in quadrant B | 1,586,268 | 342,249 |
| Events in quadrant C | 1,353,983 | 329,189 |
| Events in quadrant D | 1,395,139 | 320,460 |
| Mode M0 | |||
|---|---|---|---|
| Quadrant | BADHDUFLAG | Total packets | Discarded packets |
| A | 0 | 6403 | 0 |
| B | 0 | 6890 | 0 |
| C | 0 | 6305 | 0 |
| D | 0 | 6432 | 0 |
| Mode SS | |||
|---|---|---|---|
| Quadrant | BADHDUFLAG | Total packets | Discarded packets |
| A | 0 | 62 | 0 |
| B | 0 | 62 | 0 |
| C | 0 | 62 | 0 |
| D | 0 | 62 | 0 |
| Quadrant | Total seconds | Saturated seconds | Saturation percentage |
|---|---|---|---|
| A | 3144 | 4 | 0.127226% |
| B | 3144 | 13 | 0.413486% |
| C | 3144 | 3 | 0.095420% |
| D | 3144 | 1 | 0.031807% |
Noise dominated data is calculated using 1-second bins in cleaned event files. If a bin has >2000 counts, and if more than 50% of those come from <1% of pixels, then it is considered to be noise-dominated and hence unusable.
| Quadrant | # 1 sec bins | Bins with >0 counts | Bins with >2000 counts | High rate bins dominated by noise | Noise dominated (total time) | Noise dominated (detector-on time) | Marked lightcurve |
|---|---|---|---|---|---|---|---|
| A | 3144 | 3144 | 0 | 0 | 0.00% | 0.00% | 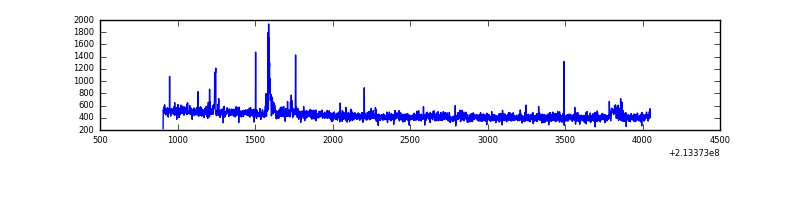 |
| B | 3144 | 3144 | 8 | 8 | 0.25% | 0.25% | 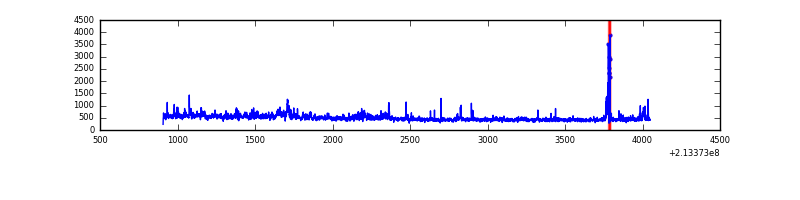 |
| C | 3144 | 3144 | 1 | 1 | 0.03% | 0.03% | 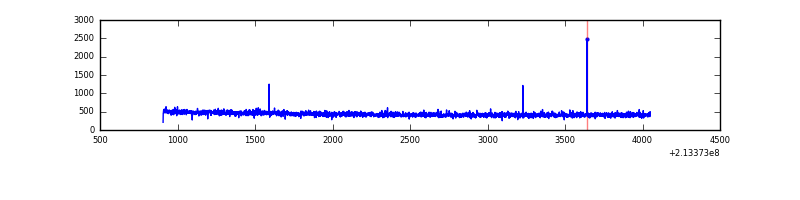 |
| D | 3144 | 3144 | 1 | 1 | 0.03% | 0.03% | 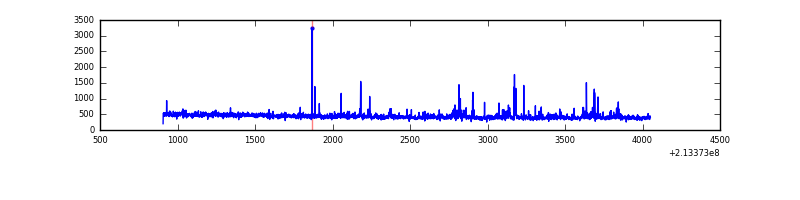 |
Top three noisy pixels from each quadrant. If the there are fewer than three noisy pixels in the level2.evt file, extra rows are filled as -1
| Pixel properties | Quadrant properties | ||||||
|---|---|---|---|---|---|---|---|
| Quadrant | DetID | PixID | Counts | Sigma | Mean | Median | Sigma |
| A | 15 | 174 | 15605 | 212.86 | 349 | 343 | 71.7 |
| A | 0 | 247 | 15422 | 210.31 | 349 | 343 | 71.7 |
| A | 0 | 50 | 8933 | 119.81 | 349 | 343 | 71.7 |
| B | 15 | 204 | 128315 | 1927.29 | 350 | 344 | 66.4 |
| B | 10 | 246 | 48416 | 723.98 | 350 | 344 | 66.4 |
| B | 4 | 48 | 17724 | 261.75 | 350 | 344 | 66.4 |
| C | 1 | 16 | 9742 | 117.84 | 343 | 345 | 79.7 |
| C | 9 | 16 | 3188 | 35.65 | 343 | 345 | 79.7 |
| C | 13 | 61 | 2853 | 31.45 | 343 | 345 | 79.7 |
| D | 2 | 152 | 63283 | 752.89 | 342 | 332 | 83.6 |
| D | 4 | 228 | 11360 | 131.89 | 342 | 332 | 83.6 |
| D | 13 | 238 | 8622 | 99.15 | 342 | 332 | 83.6 |
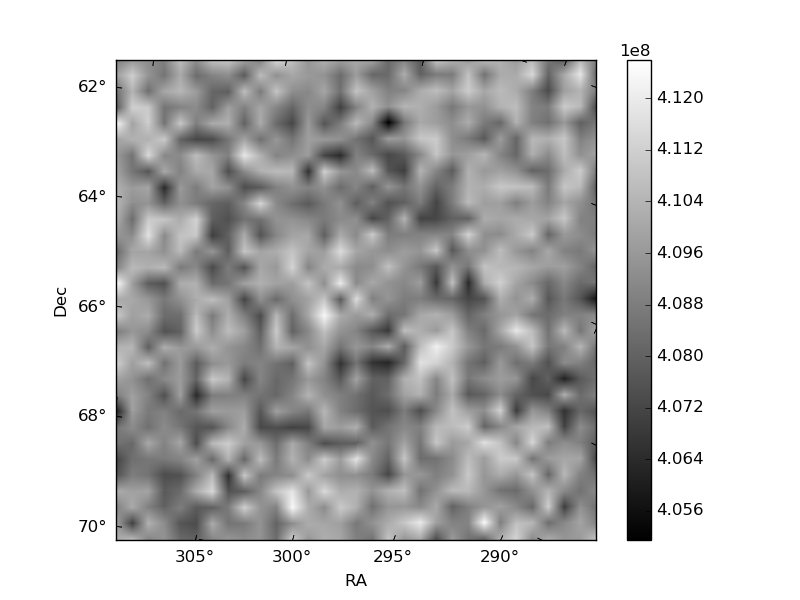
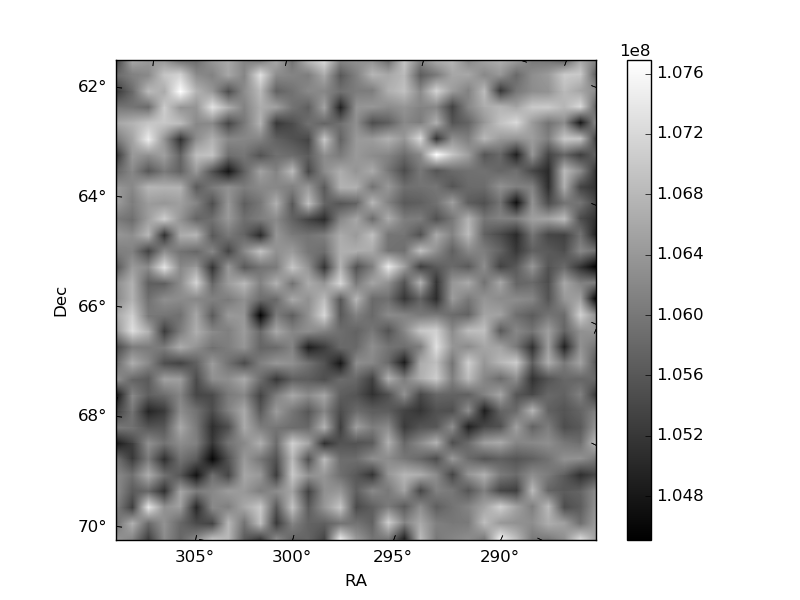
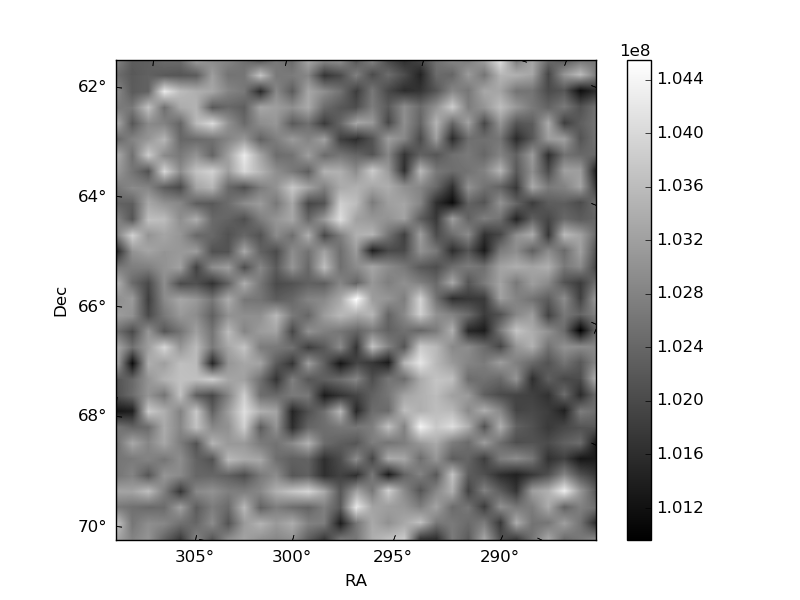
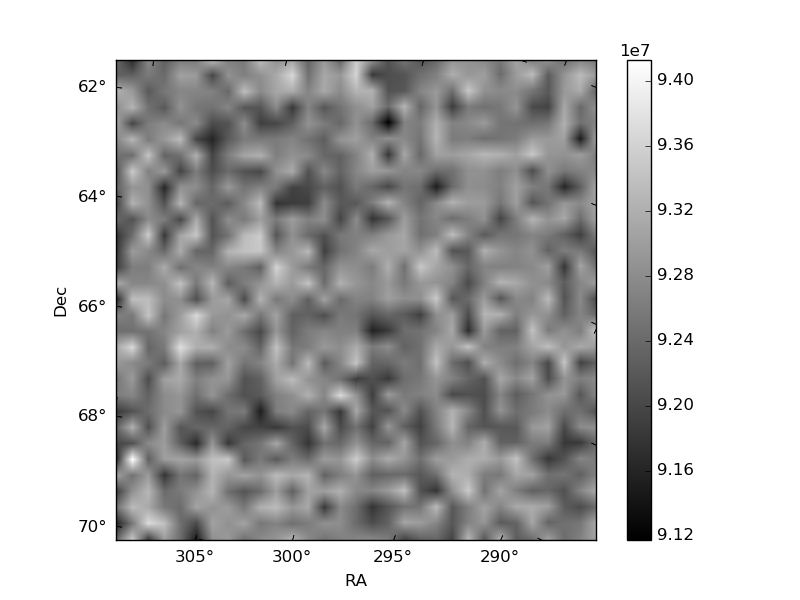
Histogram calculated using DETX and DETY for each event in the final _common_clean file
| Quadrant A | 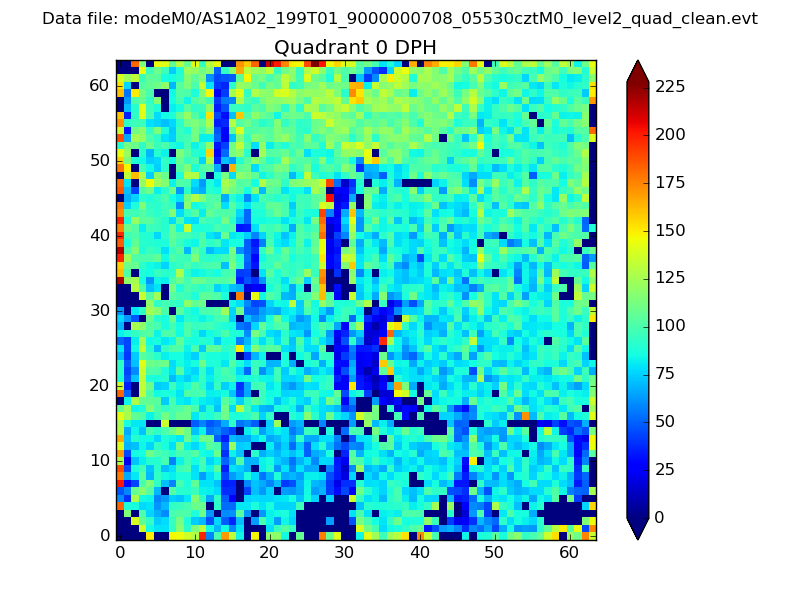 |
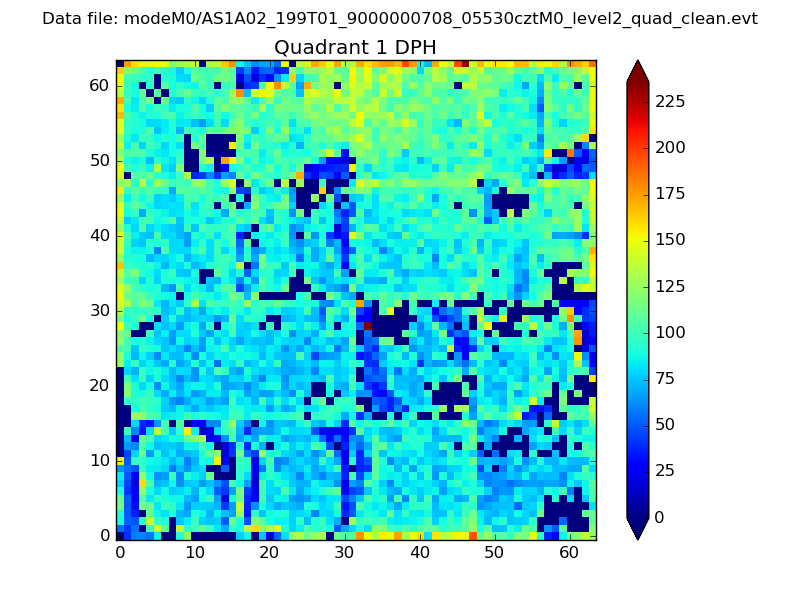 |
Quadrant B |
|---|---|---|---|
| Quadrant D | 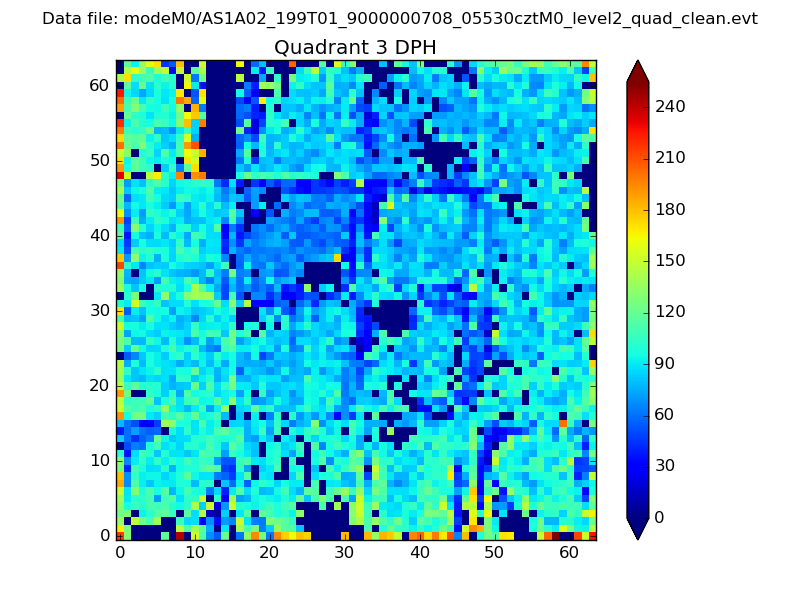 |
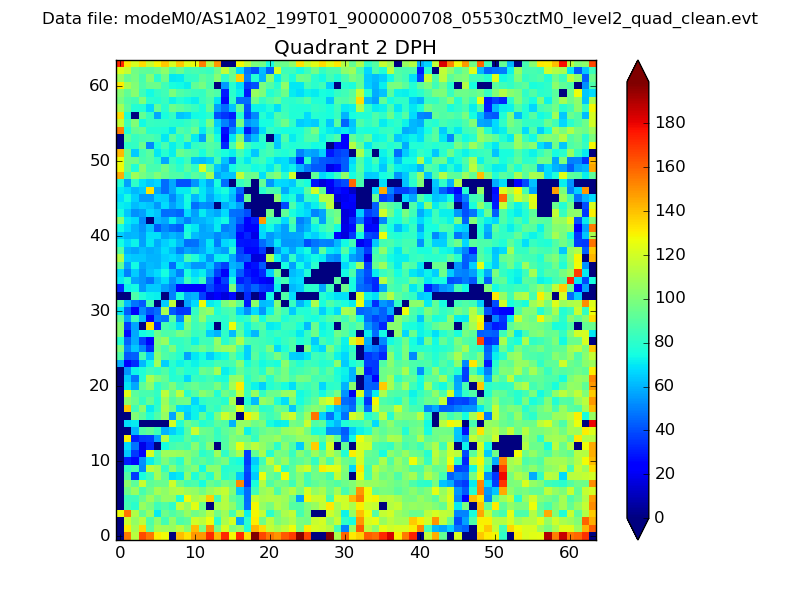 |
Quadrant C |
| Plot type | Count rate plots | Images |
|---|---|---|
| Comparison with Poisson distribution Blue bars denote a histogram of data divided into 1 sec bins. Red curve is a Poisson curve with rate = median count rate of data. |
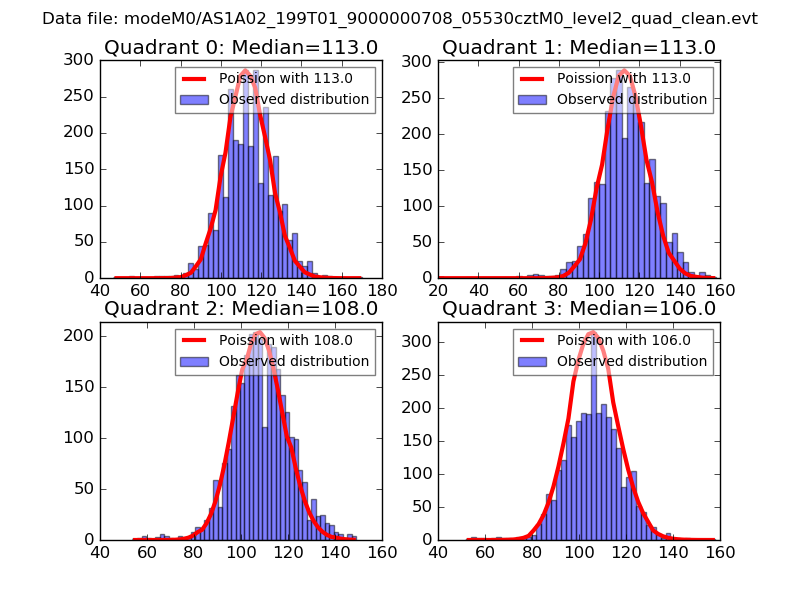 |
 |
| Quadrant-wise count rates Data is divided into 100 sec bins |
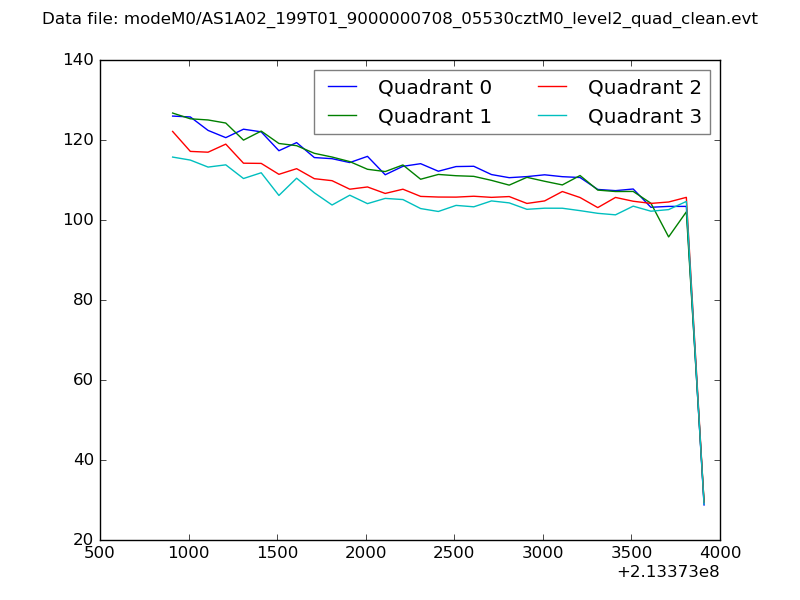 |
|
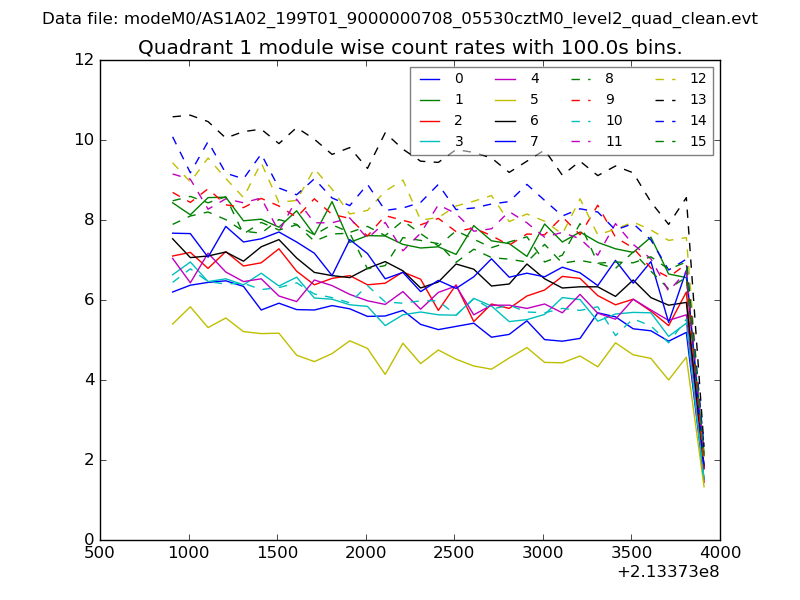
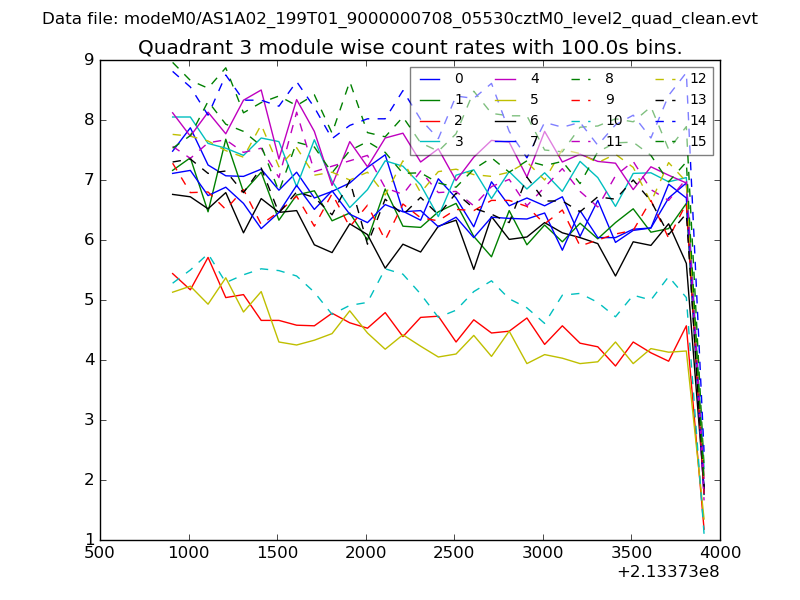
| Module-wise count rates for Quadrant A Data is divided into 100 sec bins |
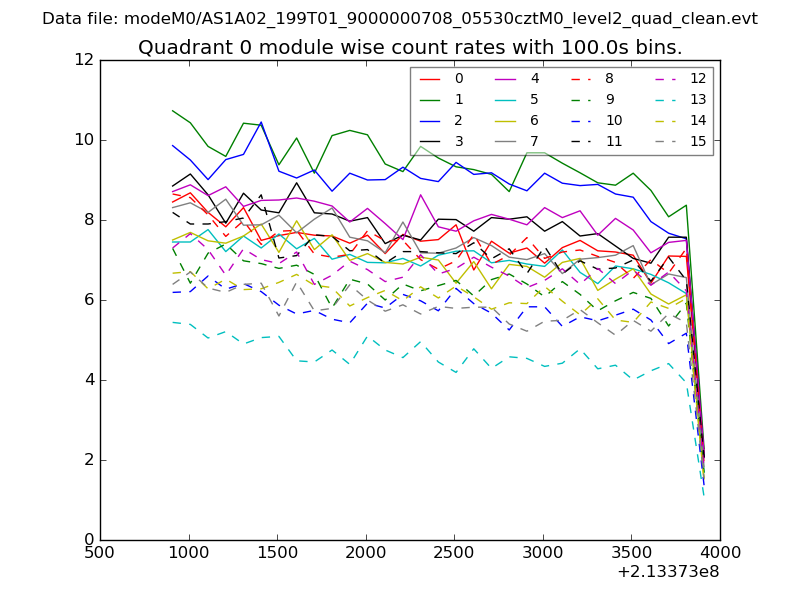 |
 |
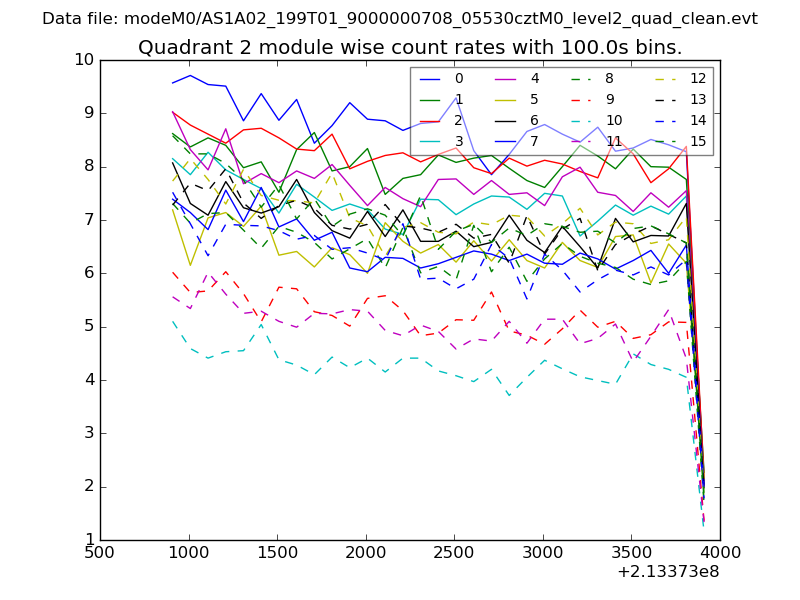
| Module-wise count rates for Quadrant B Data is divided into 100 sec bins |
 |
 |
| Module-wise count rates for Quadrant C Data is divided into 100 sec bins |
 |
 |
| Module-wise count rates for Quadrant D Data is divided into 100 sec bins |
 |
 |
| Parameter | Plot |
|---|---|
| CZT HV Monitor | 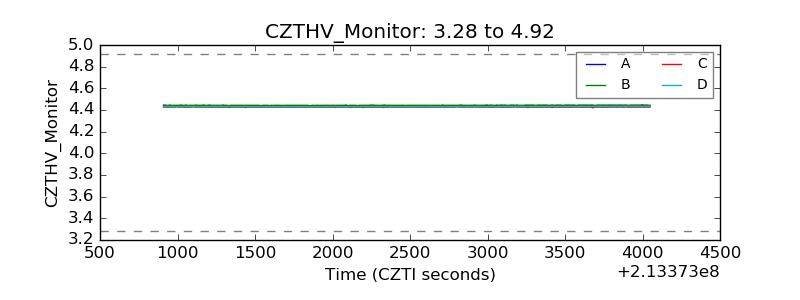 |
| D_VDD | 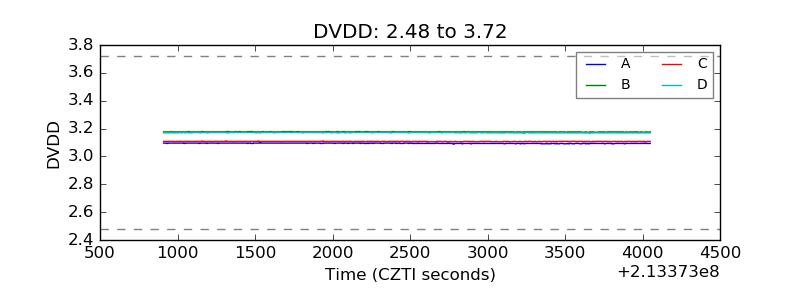 |
| Temperature 1 | 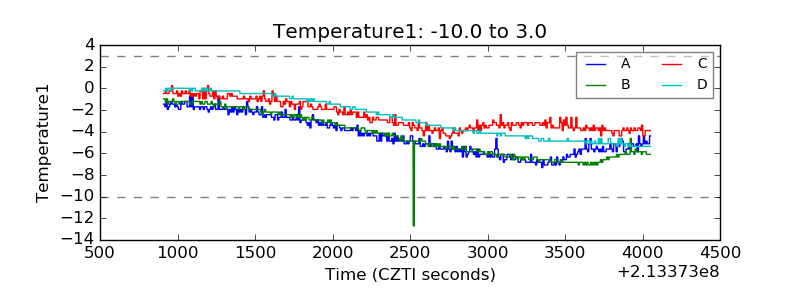 |
| Veto HV Monitor | 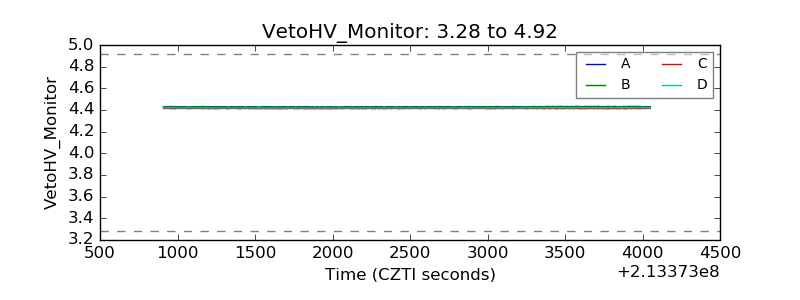 |
| Veto LLD | 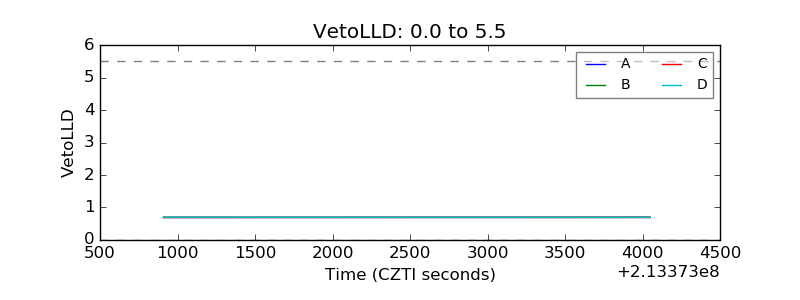 |
| Alpha Counter |  |
| _CPM_Rate | 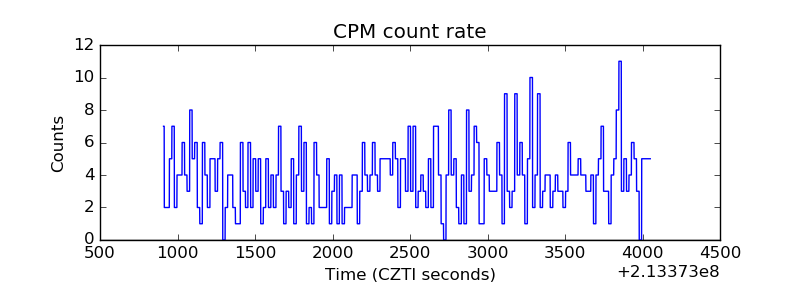 |
| CZT Counter | 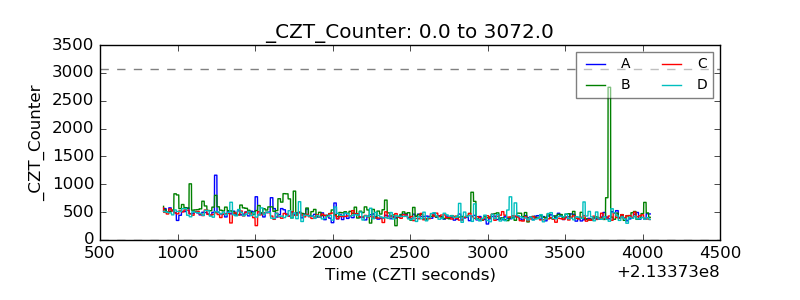 |
| +2.5 Volts monitor |  |
| +5 Volts monitor |  |
| _ROLL_ROT | 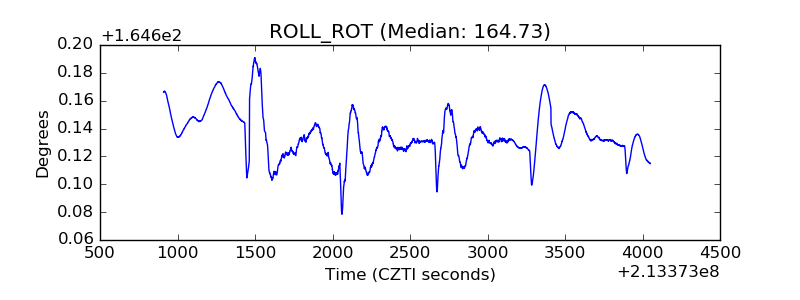 |
| _Roll_DEC | 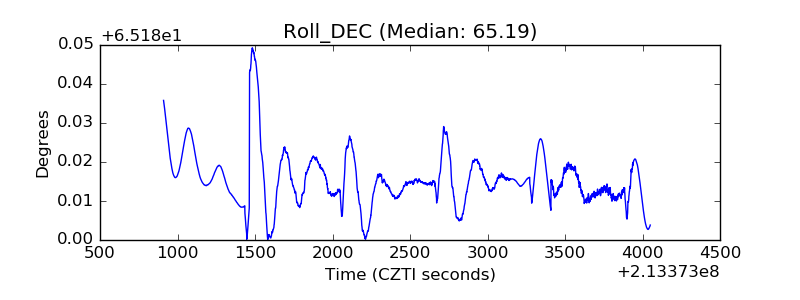 |
| _Roll_RA | 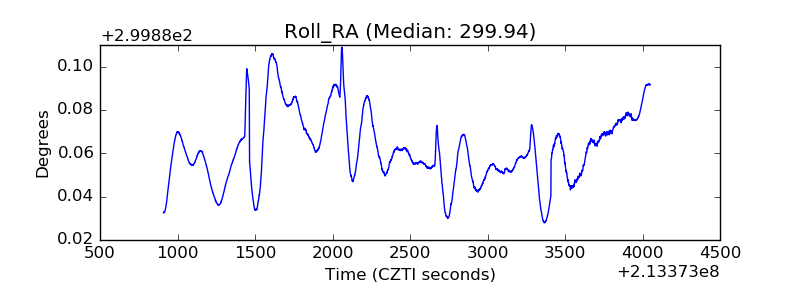 |
| Veto Counter | 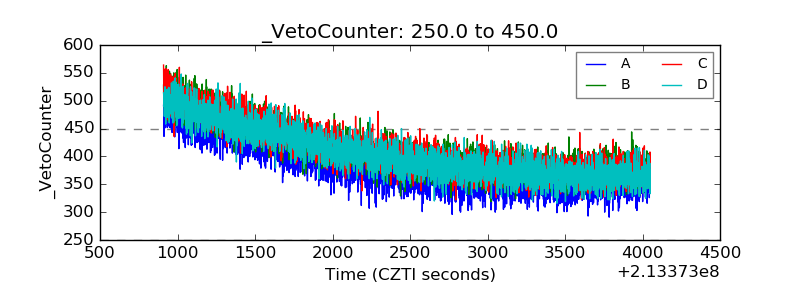 |