| Param | Original file | Final file |
|---|---|---|
| Filename | modeM0/AS1G06_084T01_9000000710cztM0_level2.fits | modeM0/AS1G06_084T01_9000000710cztM0_level2_quad_clean.evt |
| Size (bytes) | 573,672,960 | 561,677,760 |
| Size | 547.1 MB | 535.7 MB |
| Events in quadrant A | 4,001,152 | 3,883,710 |
| Events in quadrant B | 3,836,777 | 3,849,539 |
| Events in quadrant C | 3,879,133 | 3,725,277 |
| Events in quadrant D | 1,415,756 | 1,314,913 |
| Mode M0 | |||
|---|---|---|---|
| Quadrant | BADHDUFLAG | Total packets | Discarded packets |
| A | 0 | 147058 | 0 |
| B | 0 | 163956 | 0 |
| C | 0 | 154844 | 0 |
| D | 0 | 80907 | 0 |
| Mode M9 | |||
|---|---|---|---|
| Quadrant | BADHDUFLAG | Total packets | Discarded packets |
| A | 0 | 135 | 0 |
| B | 0 | 135 | 0 |
| C | 0 | 134 | 0 |
| D | 0 | 134 | 0 |
| Mode SS | |||
|---|---|---|---|
| Quadrant | BADHDUFLAG | Total packets | Discarded packets |
| A | 0 | 1514 | 0 |
| B | 0 | 1488 | 0 |
| C | 0 | 1526 | 0 |
| D | 0 | 1478 | 0 |
| Quadrant | Total seconds | Saturated seconds | Saturation percentage |
|---|---|---|---|
| A | 71046 | 894 | 1.258340% |
| B | 71074 | 1420 | 1.997918% |
| C | 70931 | 1469 | 2.071027% |
| D | 30672 | 1036 | 3.377673% |
Noise dominated data is calculated using 1-second bins in cleaned event files. If a bin has >2000 counts, and if more than 50% of those come from <1% of pixels, then it is considered to be noise-dominated and hence unusable.
| Quadrant | # 1 sec bins | Bins with >0 counts | Bins with >2000 counts | High rate bins dominated by noise | Noise dominated (total time) | Noise dominated (detector-on time) | Marked lightcurve |
|---|---|---|---|---|---|---|---|
| A | 97580 | 73630 | 0 | 0 | 0.00% | 0.00% | 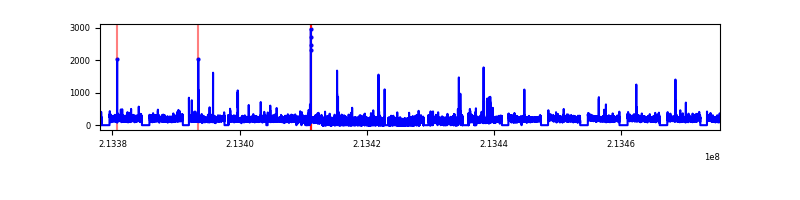 |
| B | 97580 | 73674 | 0 | 0 | 0.00% | 0.00% | 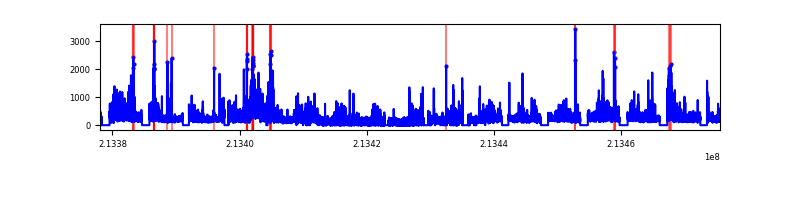 |
| C | 97580 | 73531 | 0 | 0 | 0.00% | 0.00% | 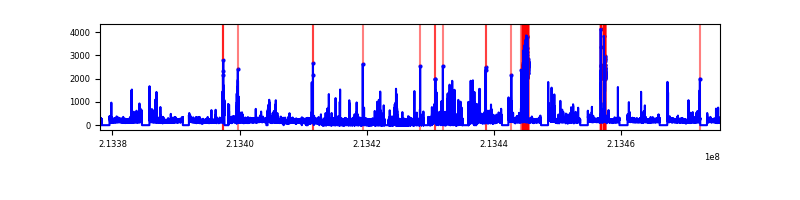 |
| D | 37992 | 31249 | 0 | 0 | 0.00% | 0.00% | 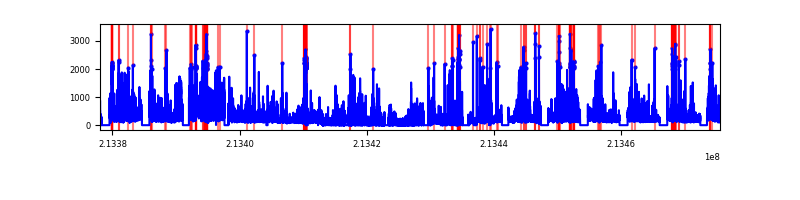 |
Top three noisy pixels from each quadrant. If the there are fewer than three noisy pixels in the level2.evt file, extra rows are filled as -1
| Pixel properties | Quadrant properties | ||||||
|---|---|---|---|---|---|---|---|
| Quadrant | DetID | PixID | Counts | Sigma | Mean | Median | Sigma |
| A | 0 | 29 | 3853 | 10.99 | 1036 | 964 | 262.8 |
| A | 7 | 110 | 3463 | 9.51 | 1036 | 964 | 262.8 |
| A | 0 | 30 | 3098 | 8.12 | 1036 | 964 | 262.8 |
| B | 2 | 9 | 3333 | 11.55 | 1012 | 960 | 205.5 |
| B | 12 | 226 | 2716 | 8.55 | 1012 | 960 | 205.5 |
| B | 14 | 254 | 2650 | 8.23 | 1012 | 960 | 205.5 |
| C | 12 | 241 | 2782 | 6.78 | 1023 | 948 | 270.6 |
| C | 1 | 81 | 2780 | 6.77 | 1023 | 948 | 270.6 |
| C | 1 | 80 | 2740 | 6.62 | 1023 | 948 | 270.6 |
| D | 11 | 82 | 1105 | 6.67 | 403 | 365 | 111.0 |
| D | 1 | 3 | 1061 | 6.27 | 403 | 365 | 111.0 |
| D | 4 | 160 | 1040 | 6.08 | 403 | 365 | 111.0 |
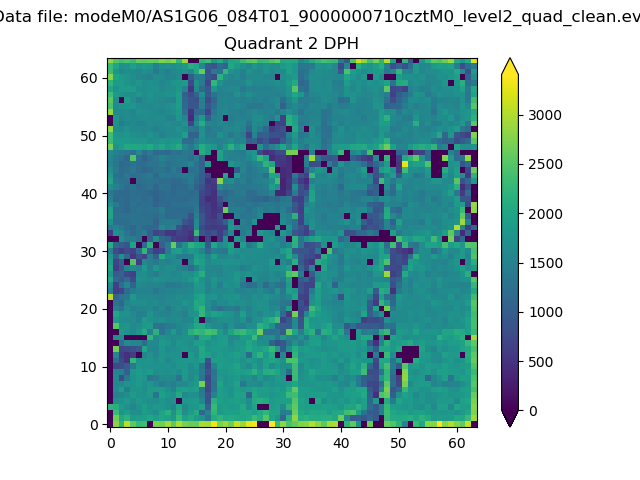
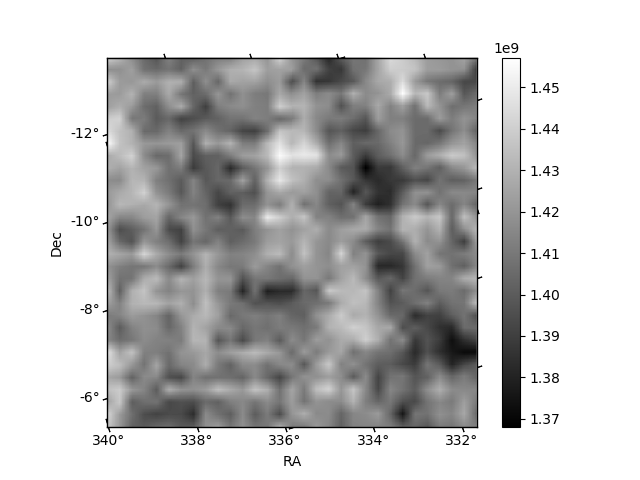
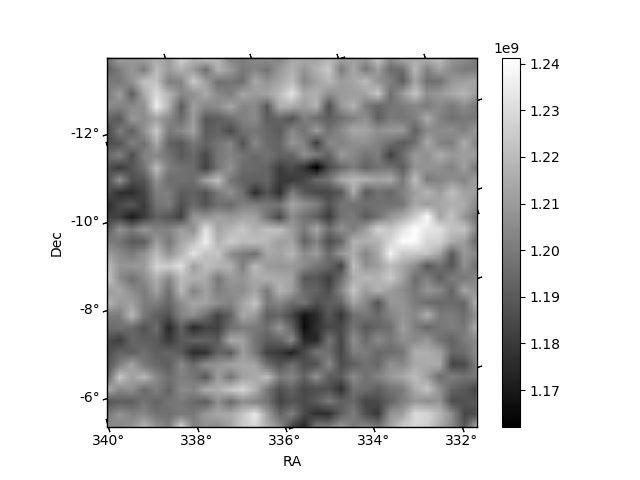
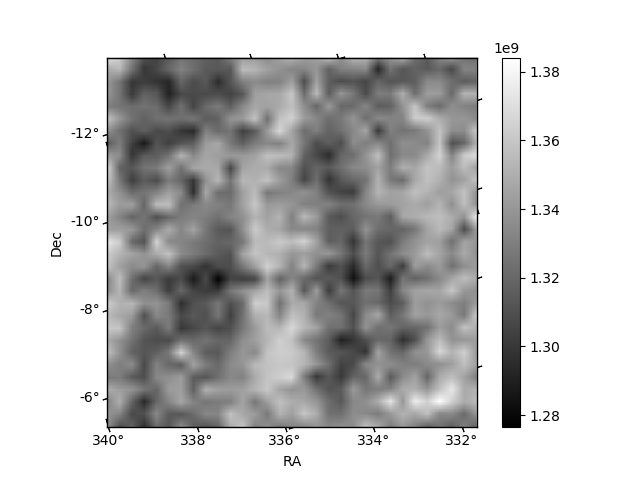
Histogram calculated using DETX and DETY for each event in the final _common_clean file
| Quadrant A | 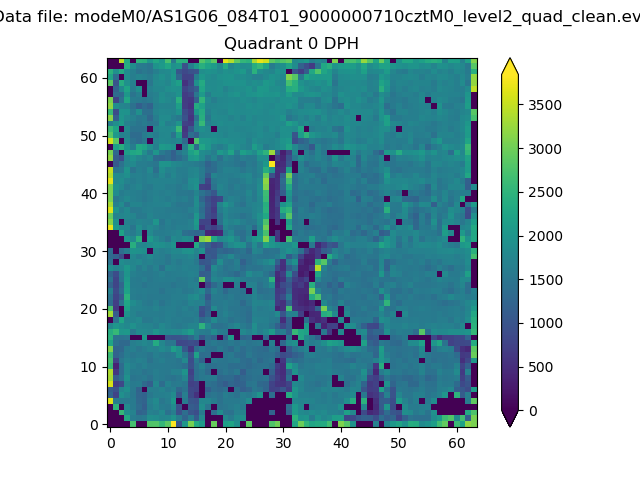 |
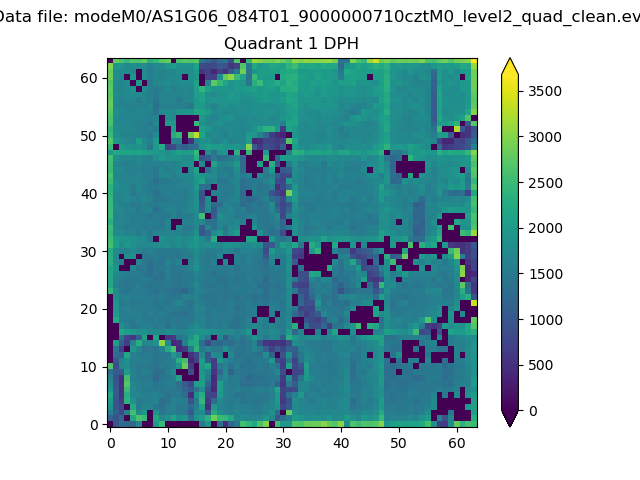 |
Quadrant B |
|---|---|---|---|
| Quadrant D | 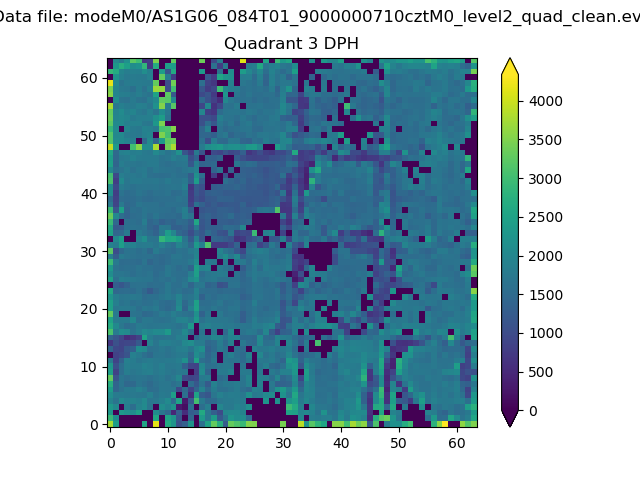 |
 |
Quadrant C |
| Plot type | Count rate plots | Images |
|---|---|---|
| Comparison with Poisson distribution Blue bars denote a histogram of data divided into 1 sec bins. Red curve is a Poisson curve with rate = median count rate of data. |
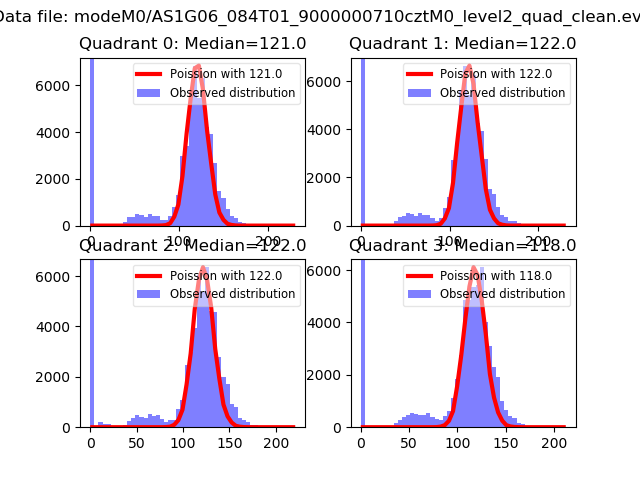 |
 |
| Quadrant-wise count rates Data is divided into 100 sec bins |
 |
|
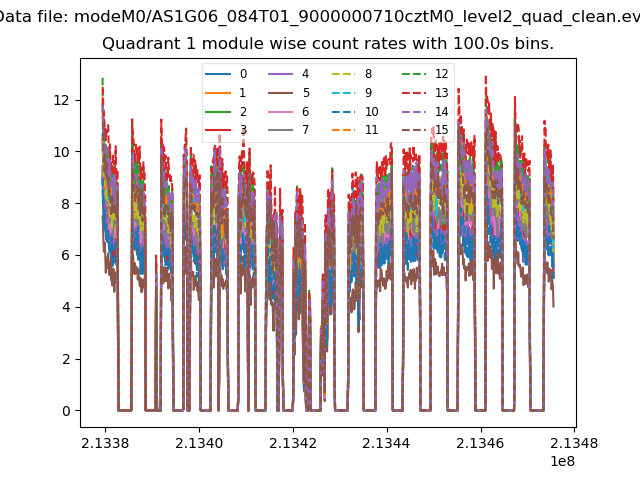
| Module-wise count rates for Quadrant A Data is divided into 100 sec bins |
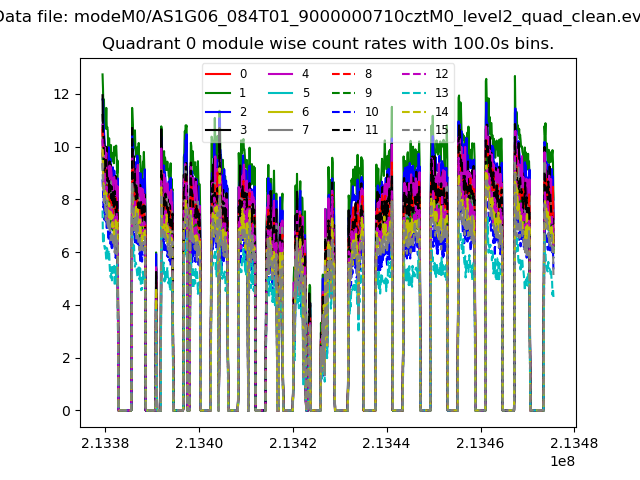 |
 |
| Module-wise count rates for Quadrant B Data is divided into 100 sec bins |
 |
 |
| Module-wise count rates for Quadrant C Data is divided into 100 sec bins |
 |
 |
| Module-wise count rates for Quadrant D Data is divided into 100 sec bins |
 |
 |
| Parameter | Plot |
|---|---|
| CZT HV Monitor |  |
| D_VDD | 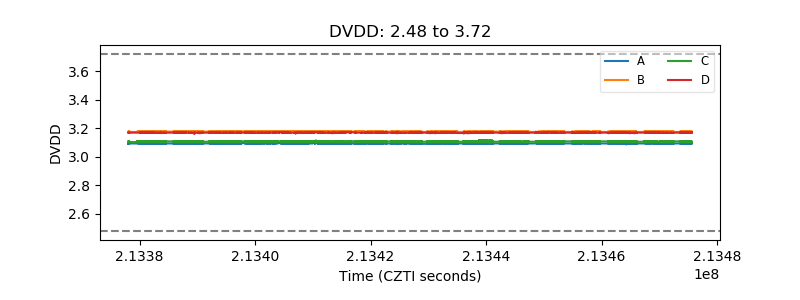 |
| Temperature 1 | 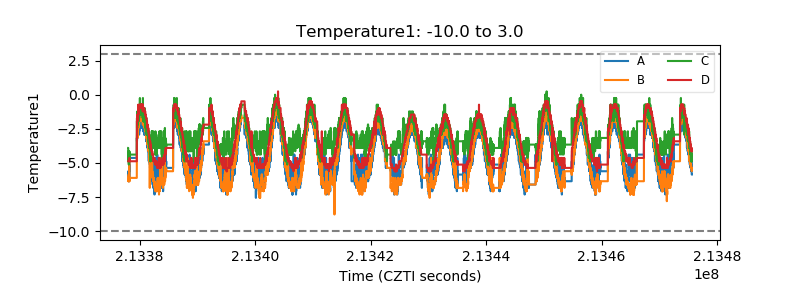 |
| Veto HV Monitor | 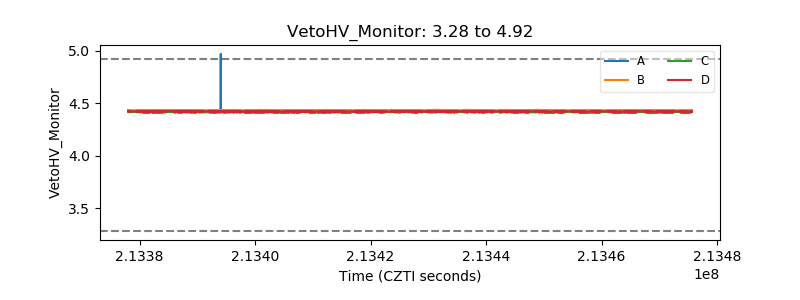 |
| Veto LLD | 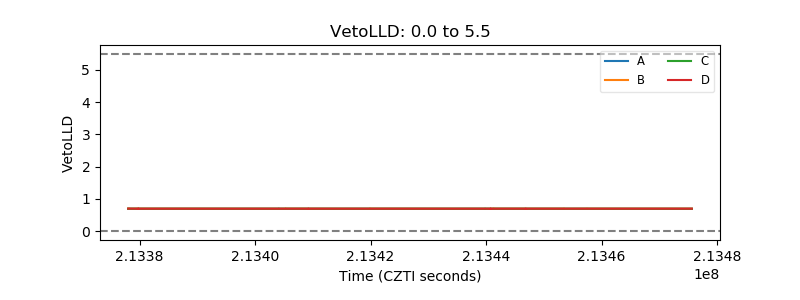 |
| Alpha Counter | 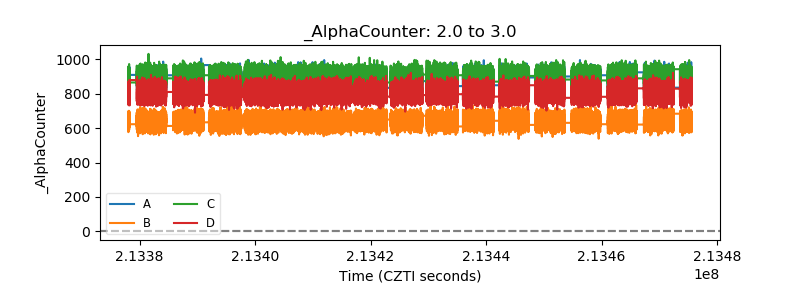 |
| _CPM_Rate | 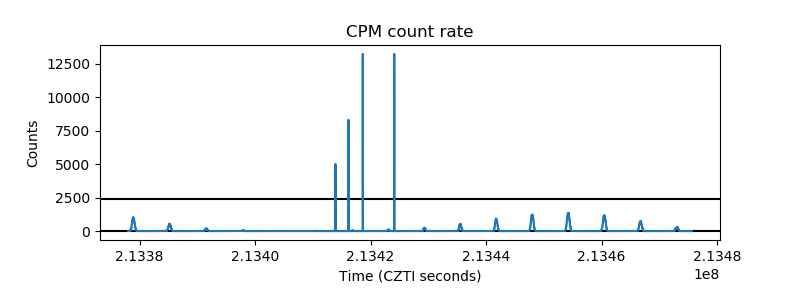 |
| CZT Counter | 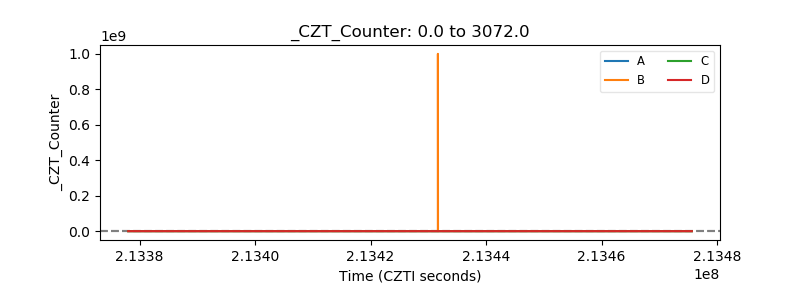 |
| +2.5 Volts monitor |  |
| +5 Volts monitor |  |
| _ROLL_ROT | 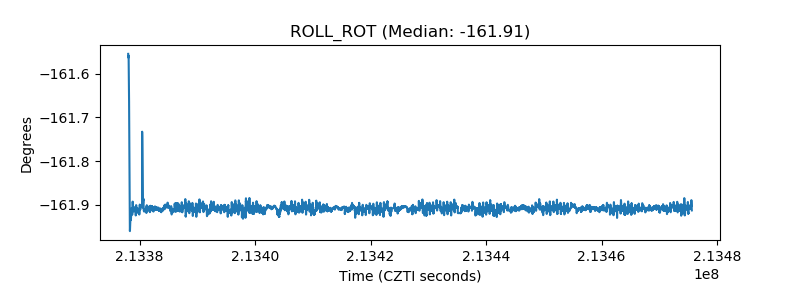 |
| _Roll_DEC |  |
| _Roll_RA | 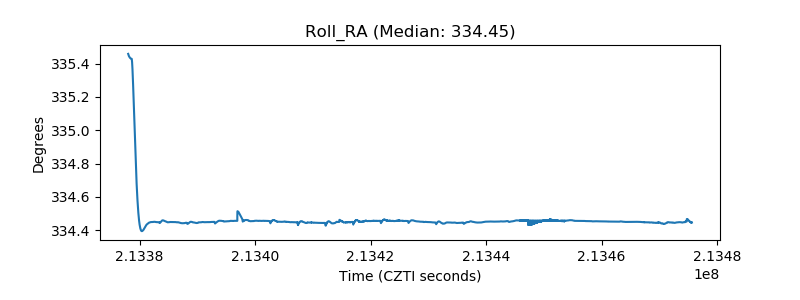 |
| Veto Counter | 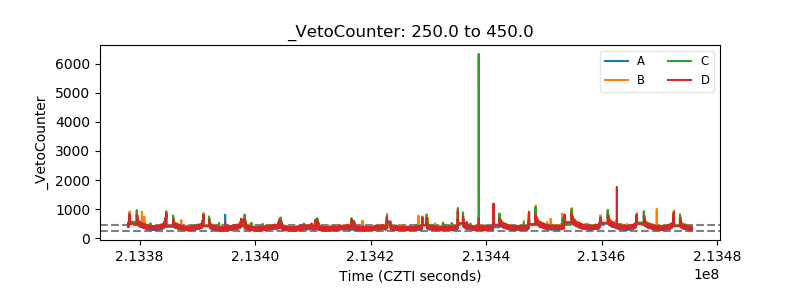 |