| Param | Original file | Final file |
|---|---|---|
| Filename | modeM0/AS1G06_084T01_9000000710_05529cztM0_level2.evt | modeM0/AS1G06_084T01_9000000710_05529cztM0_level2_quad_clean.evt |
| Size (bytes) | 123,125,760 | 23,244,480 |
| Size | 117.4 MB | 22.2 MB |
| Events in quadrant A | 827,106 | 150,516 |
| Events in quadrant B | 953,740 | 150,955 |
| Events in quadrant C | 791,856 | 151,975 |
| Events in quadrant D | 1,054,692 | 142,021 |
| Mode M0 | |||
|---|---|---|---|
| Quadrant | BADHDUFLAG | Total packets | Discarded packets |
| A | 0 | 3349 | 10 |
| B | 0 | 3920 | 27 |
| C | 0 | 3249 | 13 |
| D | 0 | 4137 | 26 |
| Mode M9 | |||
|---|---|---|---|
| Quadrant | BADHDUFLAG | Total packets | Discarded packets |
| A | 0 | 13 | 1 |
| B | 0 | 13 | 0 |
| C | 0 | 13 | 0 |
| D | 0 | 13 | 0 |
| Mode SS | |||
|---|---|---|---|
| Quadrant | BADHDUFLAG | Total packets | Discarded packets |
| A | 0 | 30 | 0 |
| B | 0 | 30 | 0 |
| C | 0 | 30 | 0 |
| D | 0 | 30 | 2 |
| Quadrant | Total seconds | Saturated seconds | Saturation percentage |
|---|---|---|---|
| A | 1462 | 82 | 5.608755% |
| B | 1455 | 70 | 4.810997% |
| C | 1460 | 44 | 3.013699% |
| D | 1458 | 110 | 7.544582% |
Noise dominated data is calculated using 1-second bins in cleaned event files. If a bin has >2000 counts, and if more than 50% of those come from <1% of pixels, then it is considered to be noise-dominated and hence unusable.
| Quadrant | # 1 sec bins | Bins with >0 counts | Bins with >2000 counts | High rate bins dominated by noise | Noise dominated (total time) | Noise dominated (detector-on time) | Marked lightcurve |
|---|---|---|---|---|---|---|---|
| A | 2725 | 1467 | 3 | 3 | 0.11% | 0.20% | 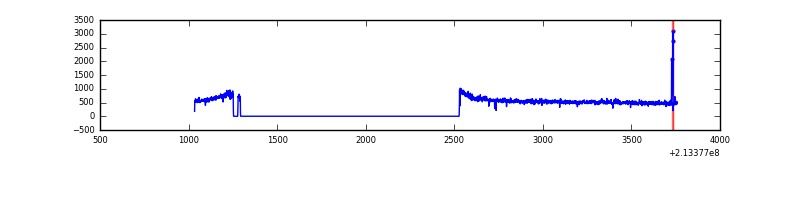 |
| B | 2725 | 1467 | 0 | 0 | 0.00% | 0.00% | 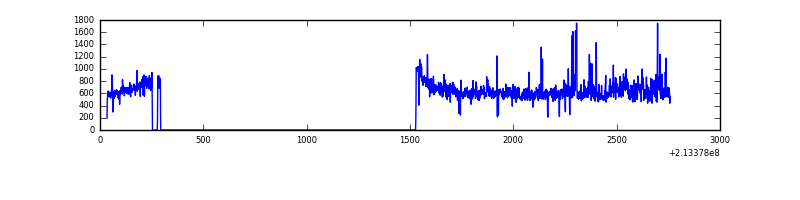 |
| C | 2725 | 1467 | 0 | 0 | 0.00% | 0.00% | 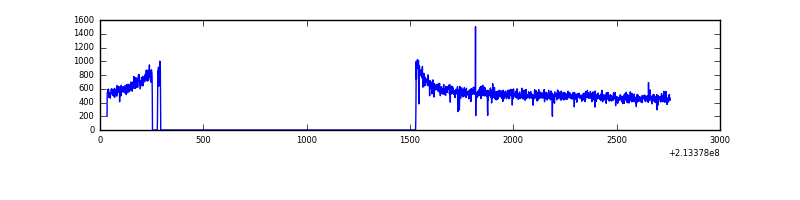 |
| D | 2725 | 1467 | 50 | 50 | 1.83% | 3.41% | 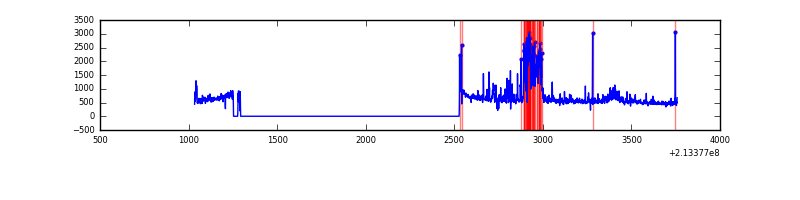 |
Top three noisy pixels from each quadrant. If the there are fewer than three noisy pixels in the level2.evt file, extra rows are filled as -1
| Pixel properties | Quadrant properties | ||||||
|---|---|---|---|---|---|---|---|
| Quadrant | DetID | PixID | Counts | Sigma | Mean | Median | Sigma |
| A | 0 | 50 | 11080 | 238.65 | 210 | 205 | 45.6 |
| A | 7 | 16 | 4276 | 89.34 | 210 | 205 | 45.6 |
| A | 0 | 226 | 2114 | 41.89 | 210 | 205 | 45.6 |
| B | 15 | 204 | 91131 | 2133.36 | 208 | 202 | 42.6 |
| B | 5 | 6 | 21021 | 488.45 | 208 | 202 | 42.6 |
| B | 11 | 51 | 16100 | 373.0 | 208 | 202 | 42.6 |
| C | 1 | 16 | 8825 | 180.75 | 200 | 200 | 47.7 |
| C | 13 | 61 | 1644 | 30.26 | 200 | 200 | 47.7 |
| C | 1 | 241 | 1160 | 20.12 | 200 | 200 | 47.7 |
| D | 12 | 233 | 165422 | 3235.27 | 201 | 195 | 51.1 |
| D | 2 | 152 | 58280 | 1137.35 | 201 | 195 | 51.1 |
| D | 2 | 63 | 38381 | 747.71 | 201 | 195 | 51.1 |
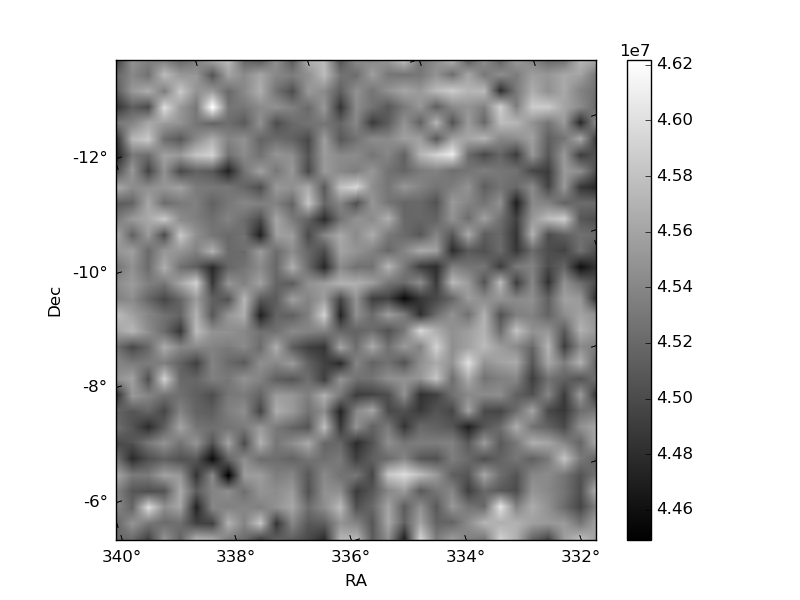
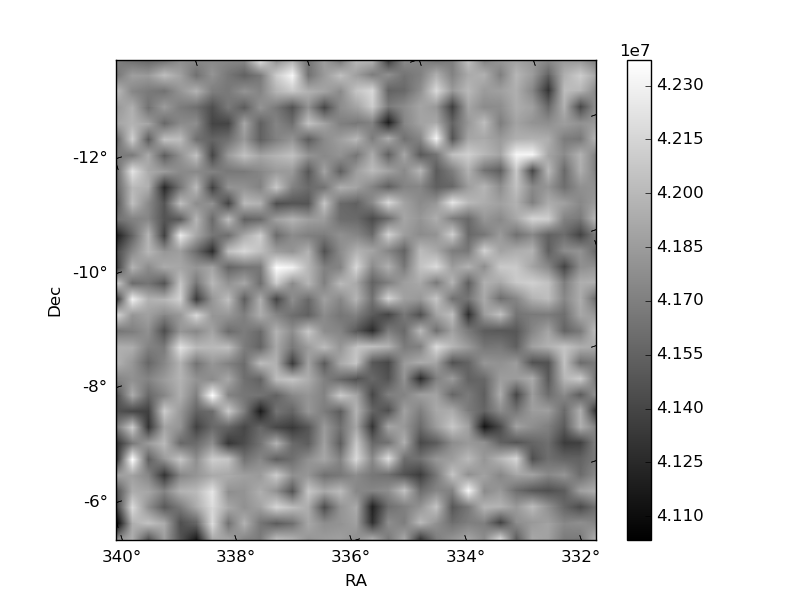
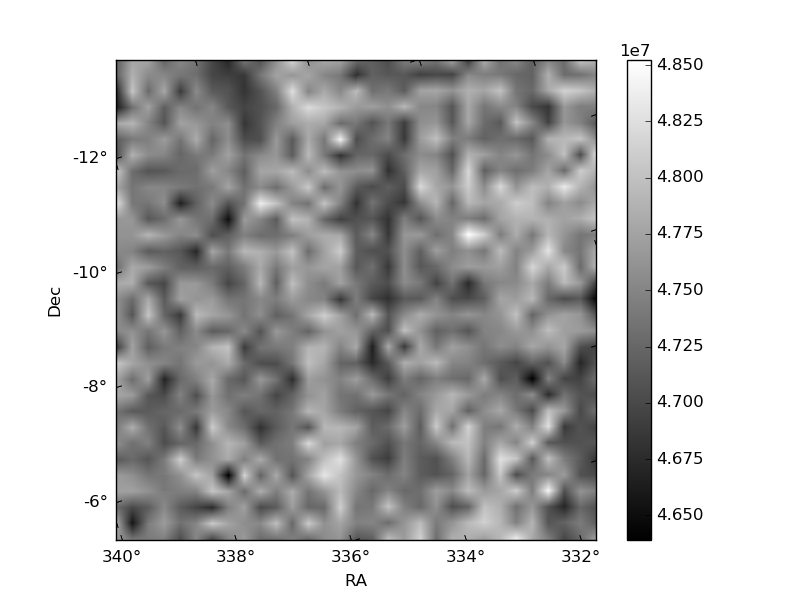
Histogram calculated using DETX and DETY for each event in the final _common_clean file
| Quadrant A | 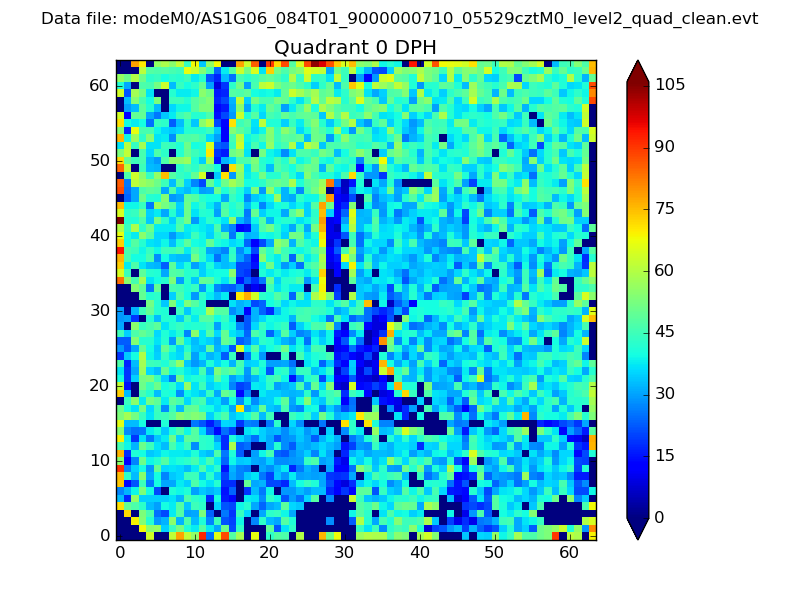 |
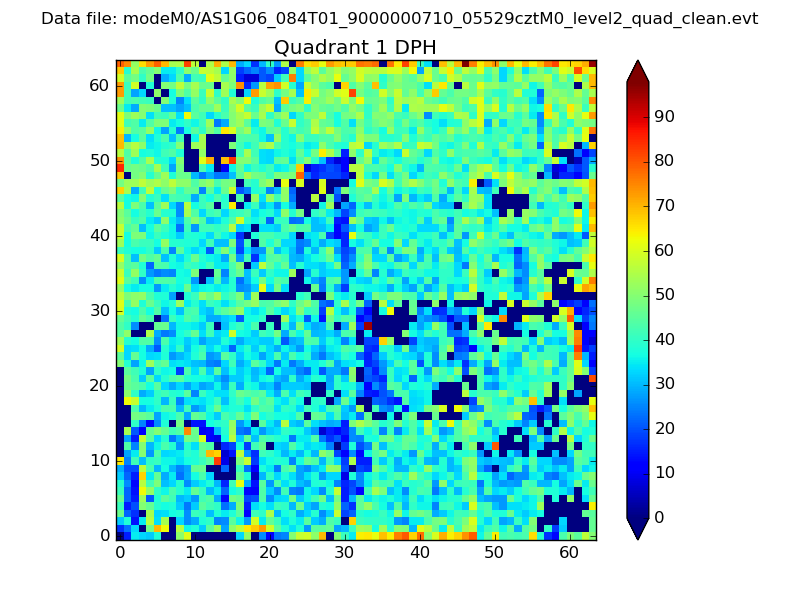 |
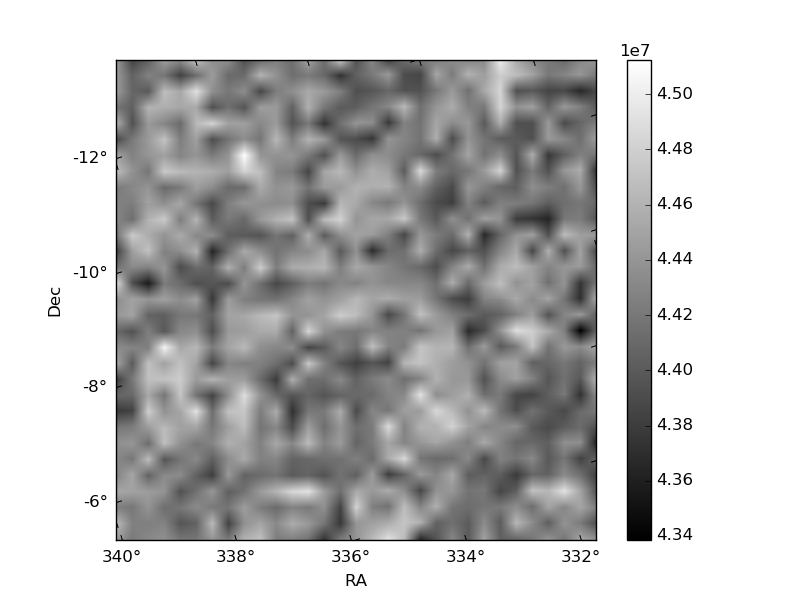
Quadrant B |
|---|---|---|---|
| Quadrant D | 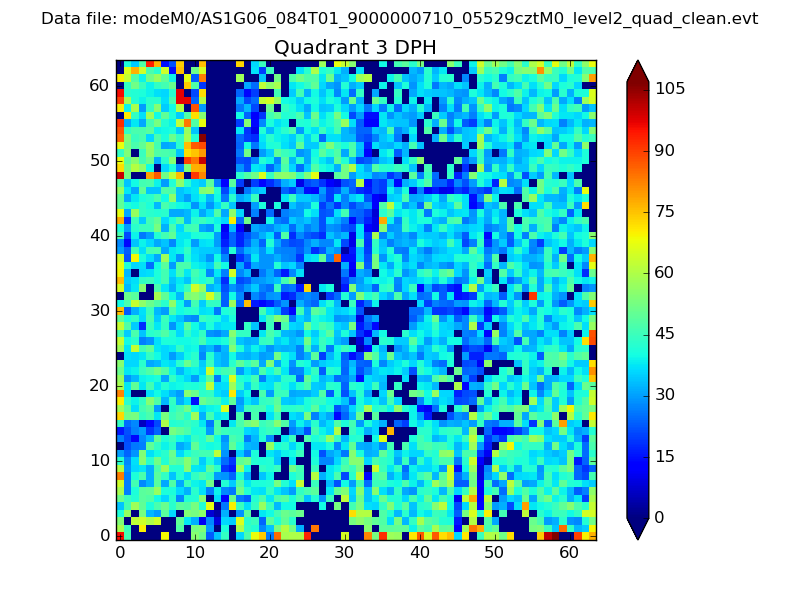 |
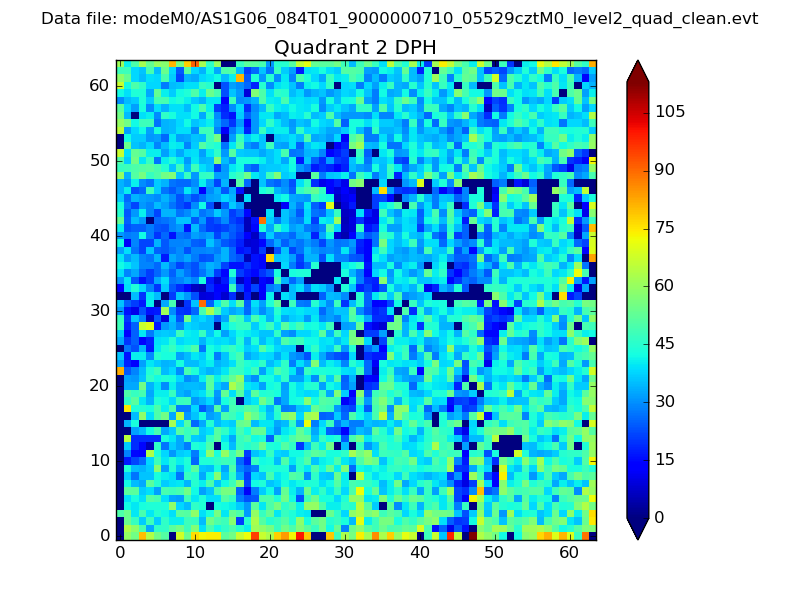 |
Quadrant C |
| Plot type | Count rate plots | Images |
|---|---|---|
| Comparison with Poisson distribution Blue bars denote a histogram of data divided into 1 sec bins. Red curve is a Poisson curve with rate = median count rate of data. |
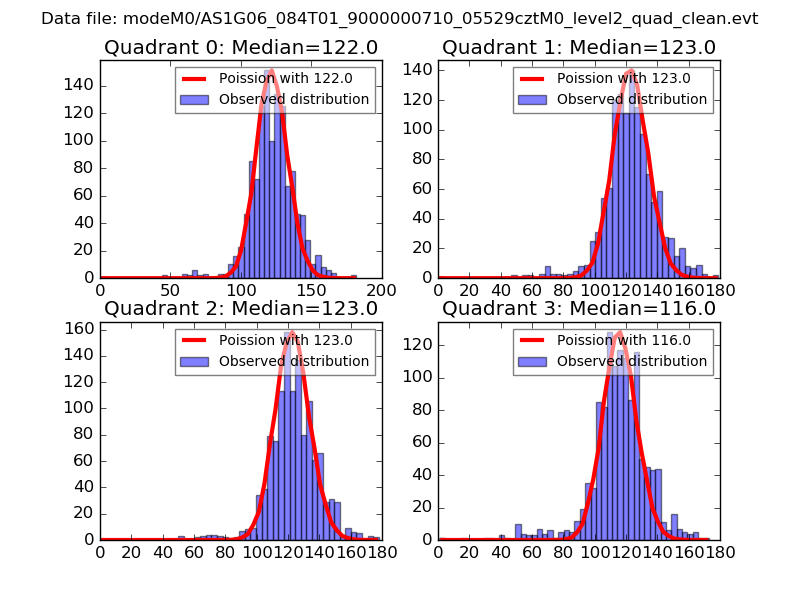 |
 |
| Quadrant-wise count rates Data is divided into 100 sec bins |
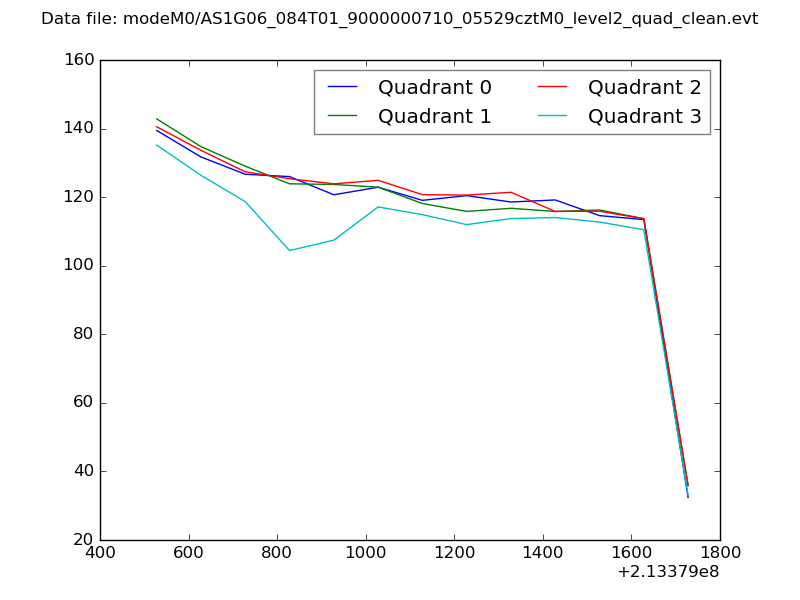 |
|
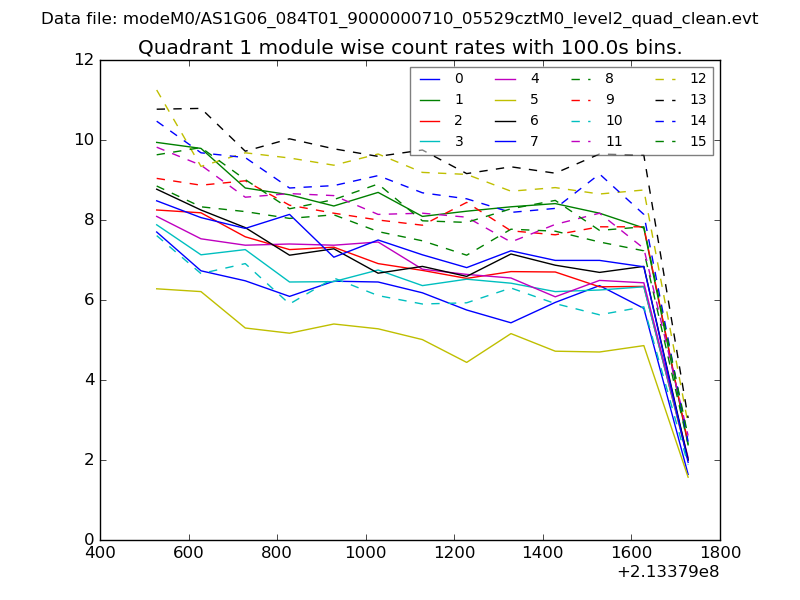
| Module-wise count rates for Quadrant A Data is divided into 100 sec bins |
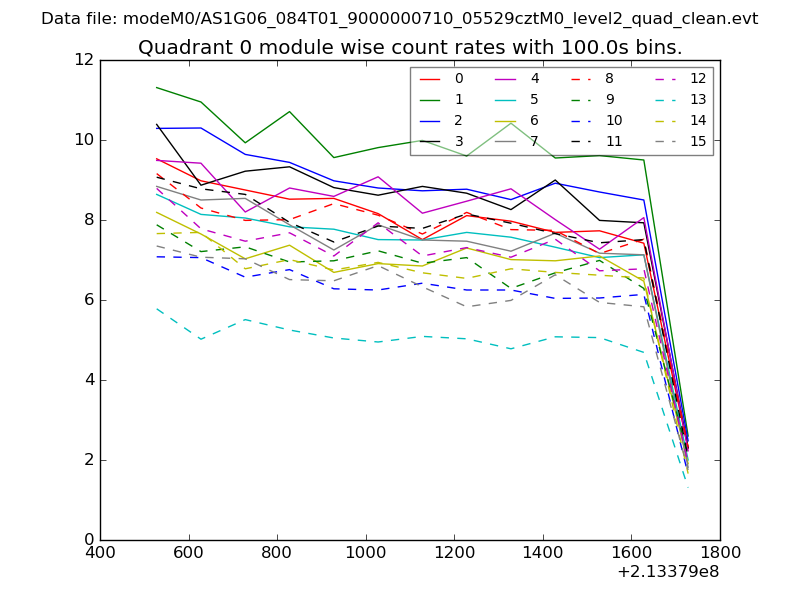 |
 |
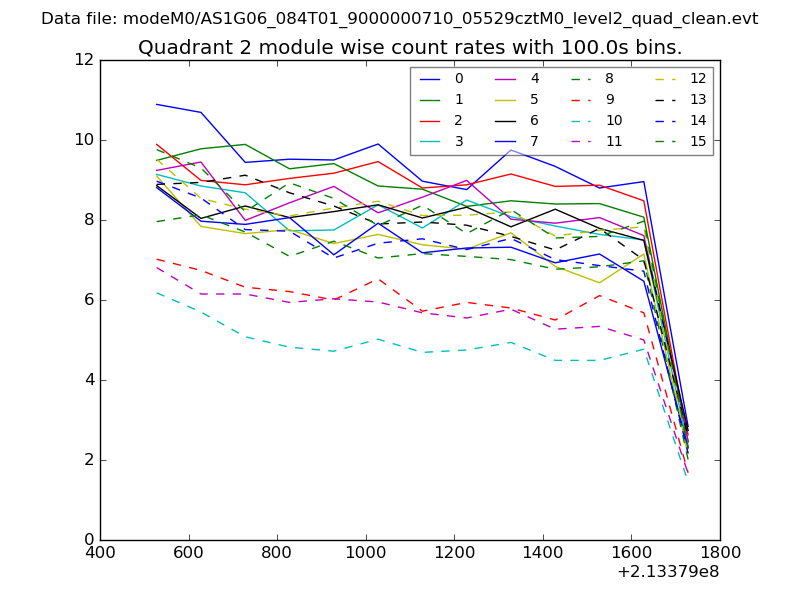
| Module-wise count rates for Quadrant B Data is divided into 100 sec bins |
 |
 |
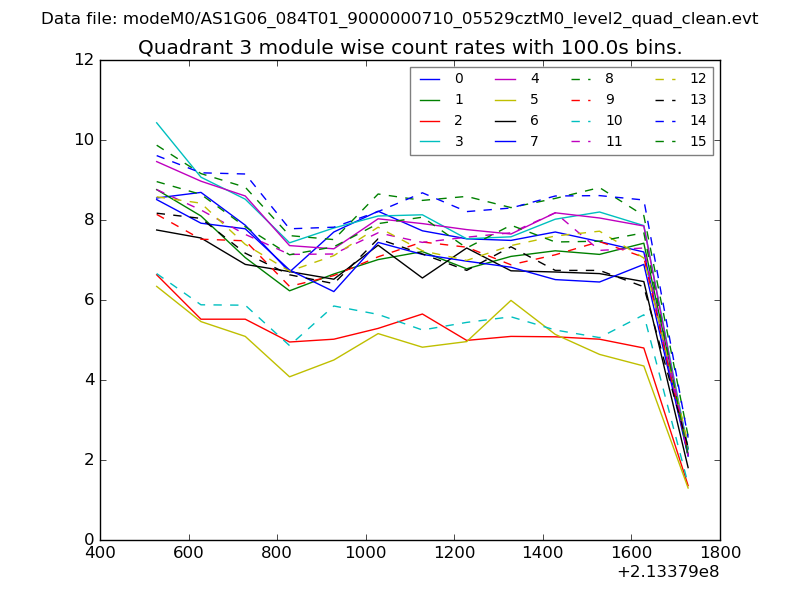
| Module-wise count rates for Quadrant C Data is divided into 100 sec bins |
 |
 |
| Module-wise count rates for Quadrant D Data is divided into 100 sec bins |
 |
 |
| Parameter | Plot |
|---|---|
| CZT HV Monitor | 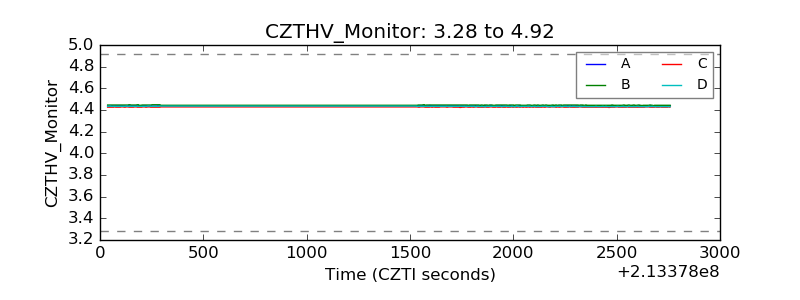 |
| D_VDD | 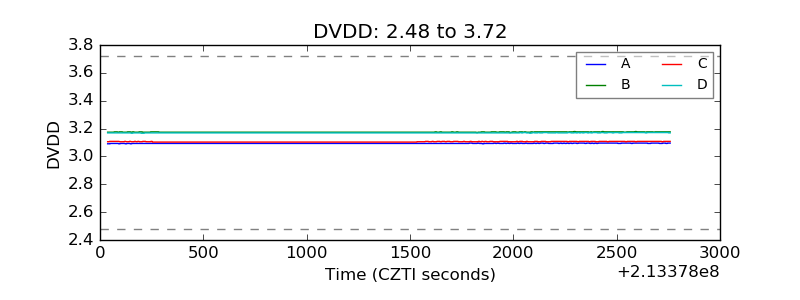 |
| Temperature 1 | 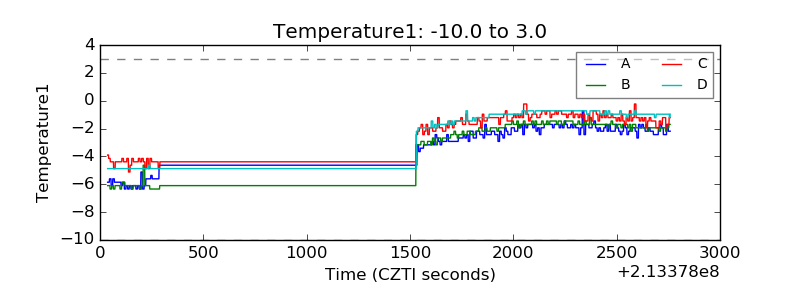 |
| Veto HV Monitor | 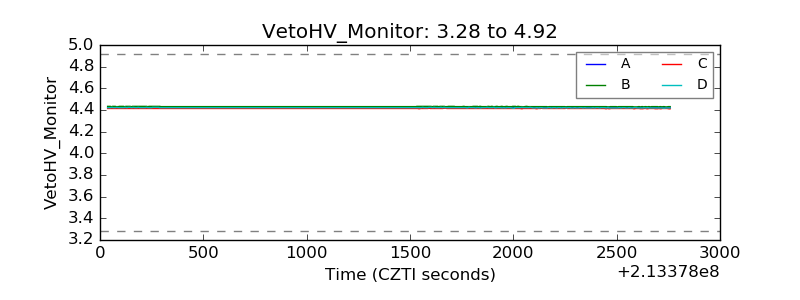 |
| Veto LLD | 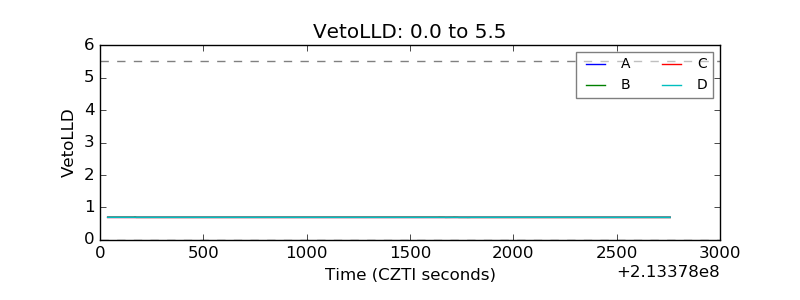 |
| Alpha Counter | 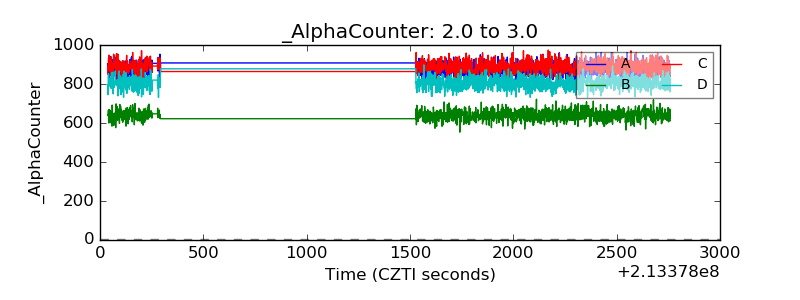 |
| _CPM_Rate | 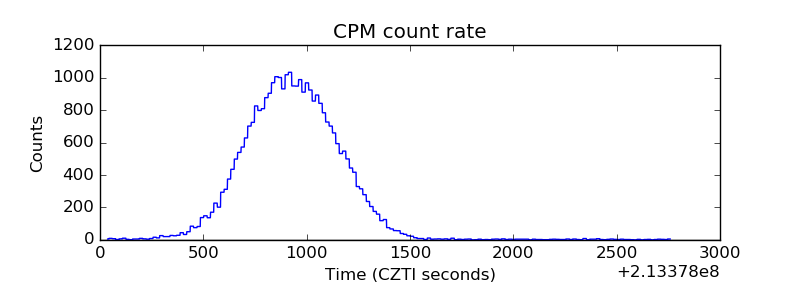 |
| CZT Counter | 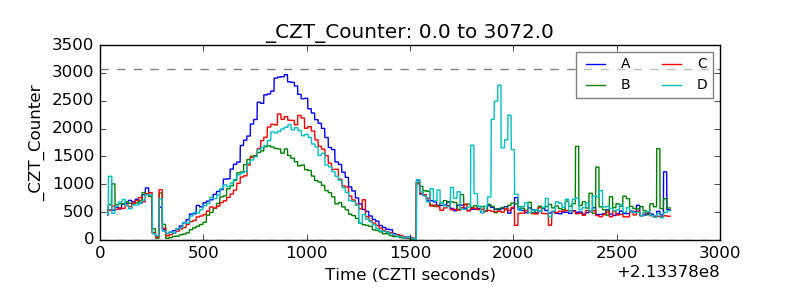 |
| +2.5 Volts monitor |  |
| +5 Volts monitor | 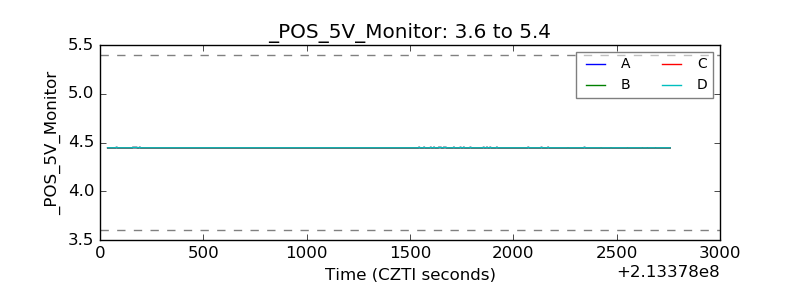 |
| _ROLL_ROT | 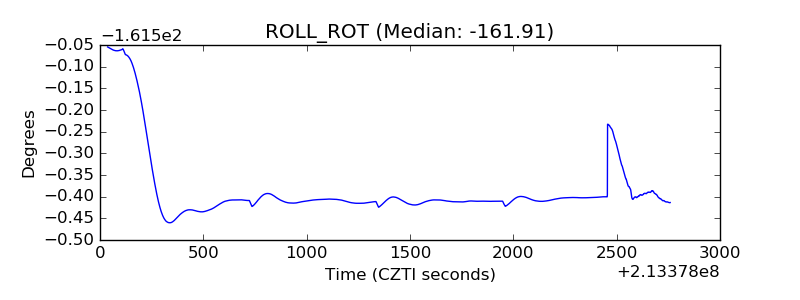 |
| _Roll_DEC | 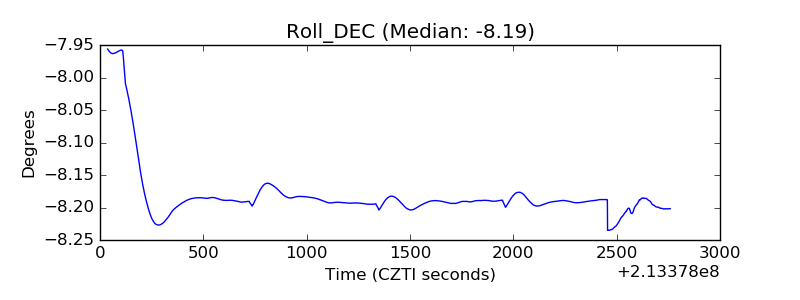 |
| _Roll_RA | 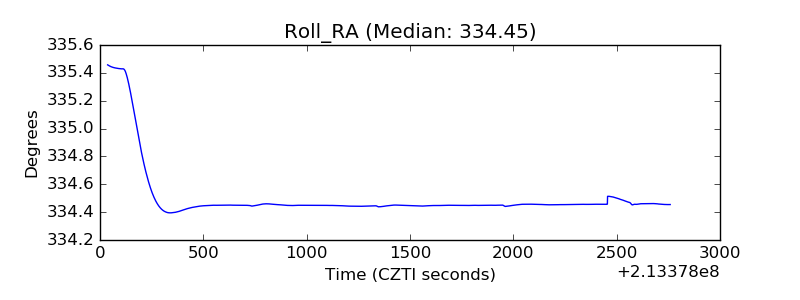 |
| Veto Counter | 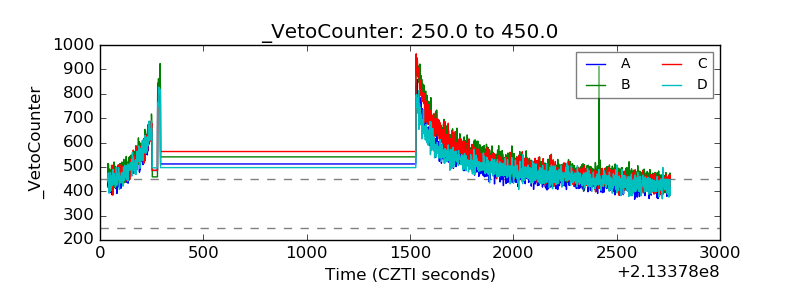 |