| Param | Original file | Final file |
|---|---|---|
| Filename | modeM0/AS1G06_084T01_9000000710_05532cztM0_level2.evt | modeM0/AS1G06_084T01_9000000710_05532cztM0_level2_quad_clean.evt |
| Size (bytes) | 554,731,200 | 81,918,720 |
| Size | 529.0 MB | 78.1 MB |
| Events in quadrant A | 3,207,836 | 500,164 |
| Events in quadrant B | 3,698,830 | 501,860 |
| Events in quadrant C | 3,363,333 | 505,156 |
| Events in quadrant D | 6,053,031 | 483,120 |
| Mode M0 | |||
|---|---|---|---|
| Quadrant | BADHDUFLAG | Total packets | Discarded packets |
| A | 0 | 14577 | 16 |
| B | 0 | 15695 | 17 |
| C | 0 | 15007 | 23 |
| D | 0 | 22868 | 37 |
| Mode M9 | |||
|---|---|---|---|
| Quadrant | BADHDUFLAG | Total packets | Discarded packets |
| A | 0 | 10 | 0 |
| B | 0 | 10 | 0 |
| C | 0 | 10 | 0 |
| D | 0 | 11 | 0 |
| Mode SS | |||
|---|---|---|---|
| Quadrant | BADHDUFLAG | Total packets | Discarded packets |
| A | 0 | 144 | 0 |
| B | 0 | 144 | 0 |
| C | 0 | 144 | 0 |
| D | 0 | 144 | 0 |
| Quadrant | Total seconds | Saturated seconds | Saturation percentage |
|---|---|---|---|
| A | 7035 | 43 | 0.611230% |
| B | 7035 | 84 | 1.194030% |
| C | 7031 | 91 | 1.294268% |
| D | 7032 | 370 | 5.261661% |
Noise dominated data is calculated using 1-second bins in cleaned event files. If a bin has >2000 counts, and if more than 50% of those come from <1% of pixels, then it is considered to be noise-dominated and hence unusable.
| Quadrant | # 1 sec bins | Bins with >0 counts | Bins with >2000 counts | High rate bins dominated by noise | Noise dominated (total time) | Noise dominated (detector-on time) | Marked lightcurve |
|---|---|---|---|---|---|---|---|
| A | 7636 | 7043 | 4 | 4 | 0.05% | 0.06% | 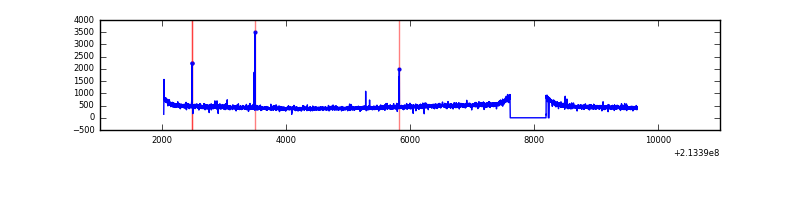 |
| B | 7636 | 7043 | 4 | 4 | 0.05% | 0.06% | 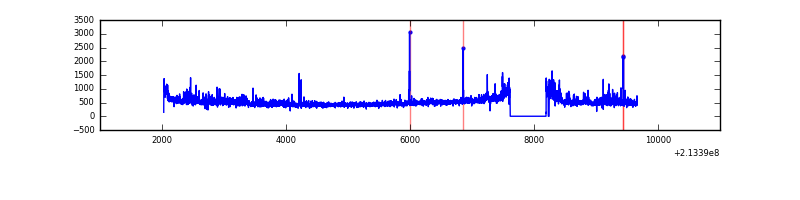 |
| C | 7636 | 7043 | 15 | 15 | 0.20% | 0.21% | 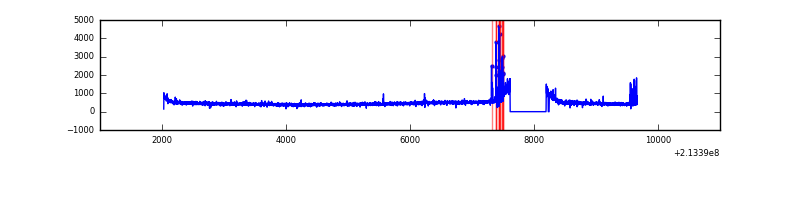 |
| D | 7636 | 7043 | 311 | 311 | 4.07% | 4.42% | 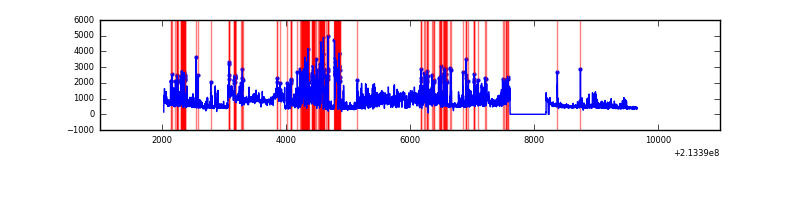 |
Top three noisy pixels from each quadrant. If the there are fewer than three noisy pixels in the level2.evt file, extra rows are filled as -1
| Pixel properties | Quadrant properties | ||||||
|---|---|---|---|---|---|---|---|
| Quadrant | DetID | PixID | Counts | Sigma | Mean | Median | Sigma |
| A | 7 | 16 | 14126 | 79.27 | 823 | 805 | 168.0 |
| A | 4 | 2 | 12199 | 67.81 | 823 | 805 | 168.0 |
| A | 0 | 50 | 10359 | 56.86 | 823 | 805 | 168.0 |
| B | 15 | 204 | 352512 | 2193.42 | 831 | 810 | 160.3 |
| B | 11 | 51 | 63607 | 391.64 | 831 | 810 | 160.3 |
| B | 15 | 54 | 15876 | 93.96 | 831 | 810 | 160.3 |
| C | 1 | 241 | 172130 | 920.3 | 796 | 801 | 186.2 |
| C | 1 | 16 | 69201 | 367.41 | 796 | 801 | 186.2 |
| C | 9 | 16 | 13554 | 68.5 | 796 | 801 | 186.2 |
| D | 2 | 63 | 2654403 | 13450.84 | 787 | 760 | 197.3 |
| D | 2 | 136 | 100739 | 506.78 | 787 | 760 | 197.3 |
| D | 2 | 152 | 86972 | 436.99 | 787 | 760 | 197.3 |
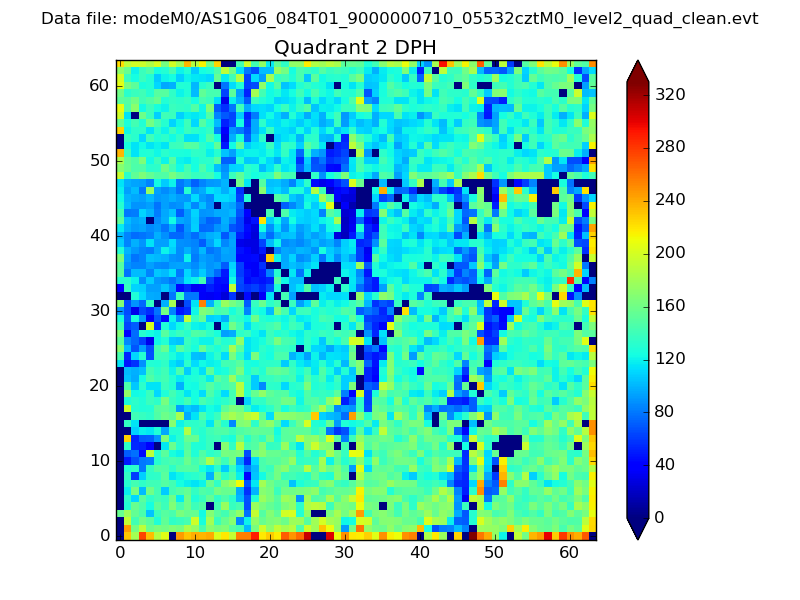
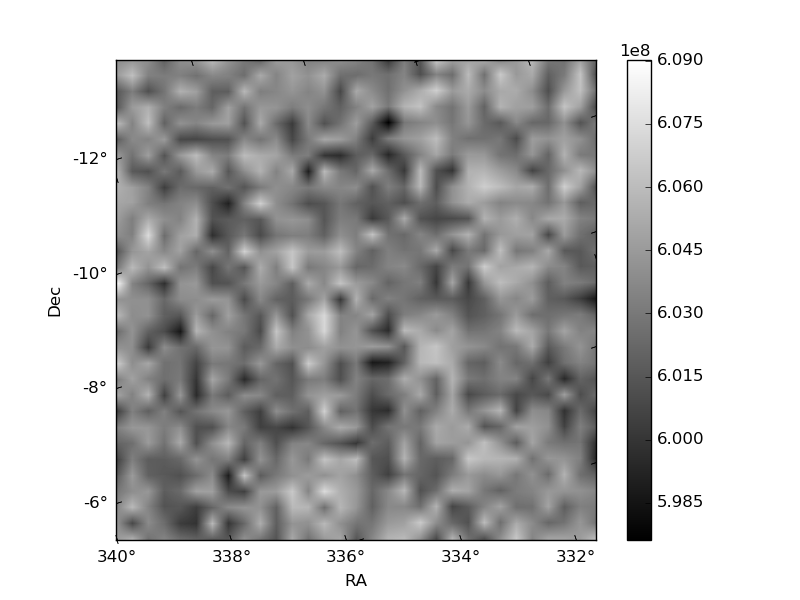
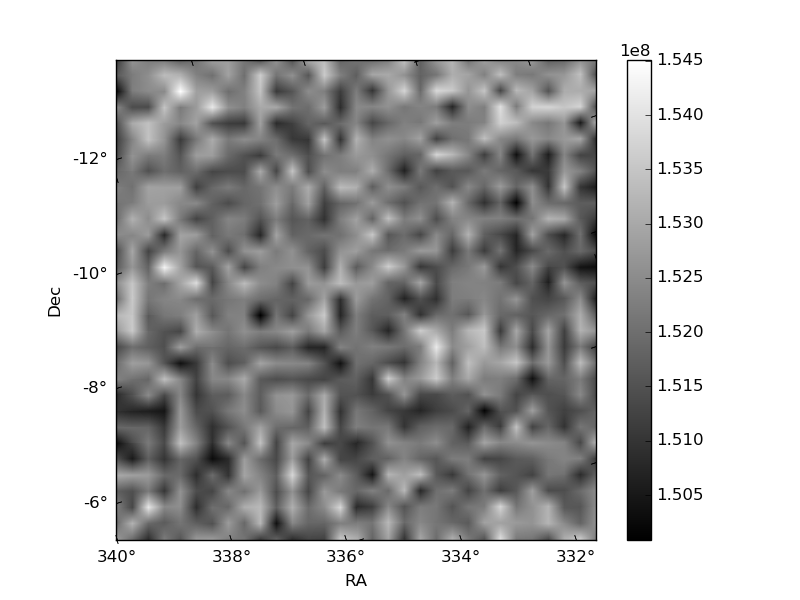
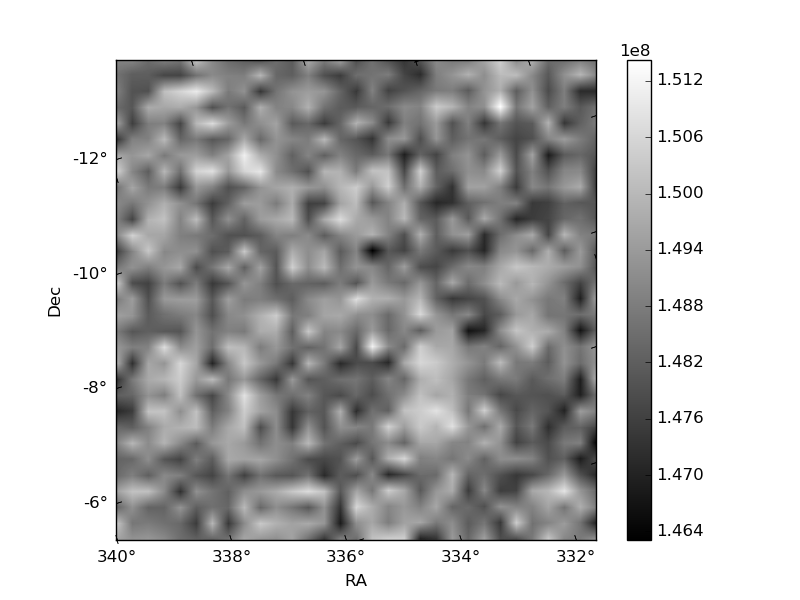
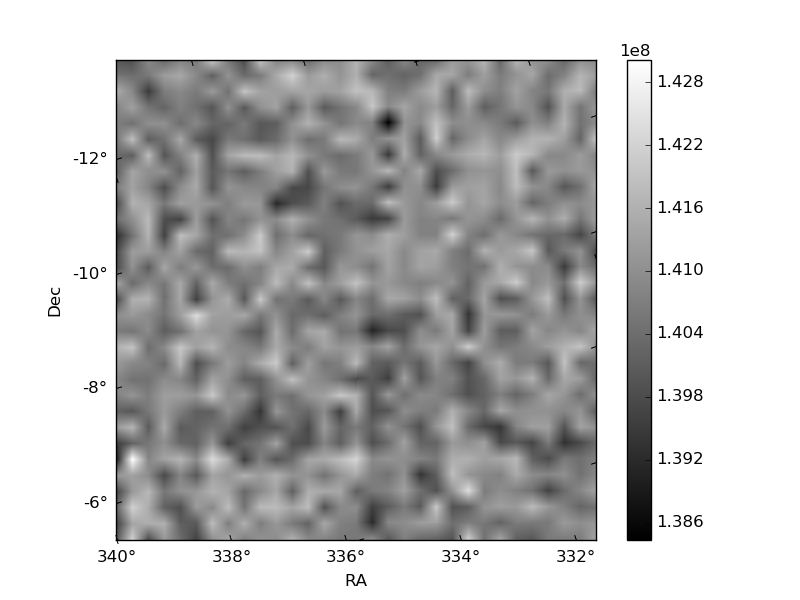
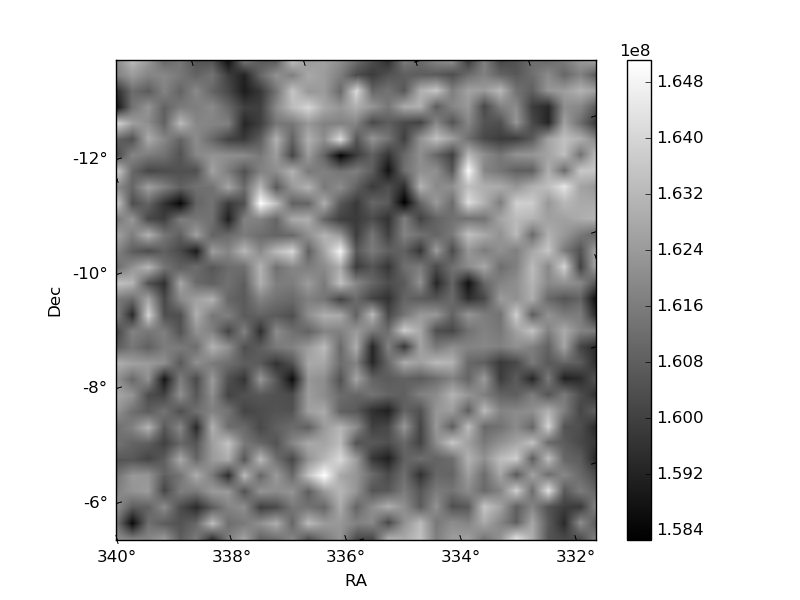
Histogram calculated using DETX and DETY for each event in the final _common_clean file
| Quadrant A | 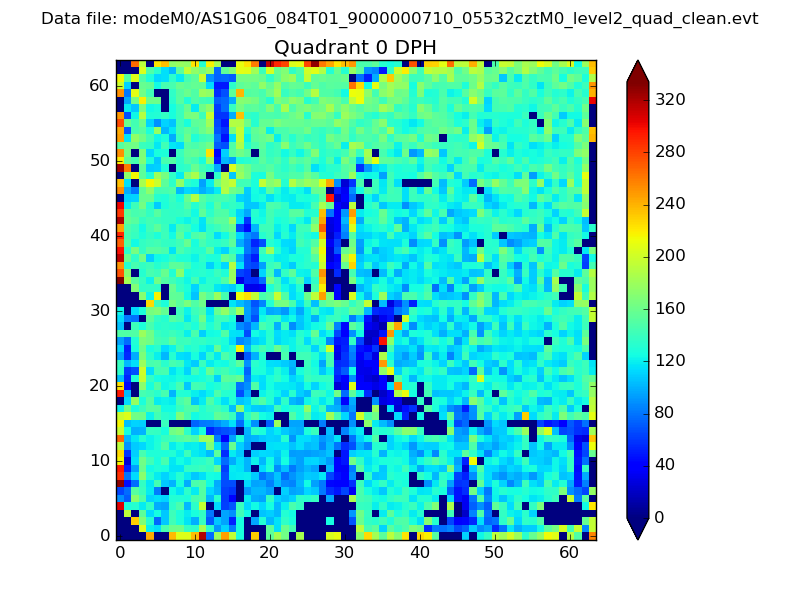 |
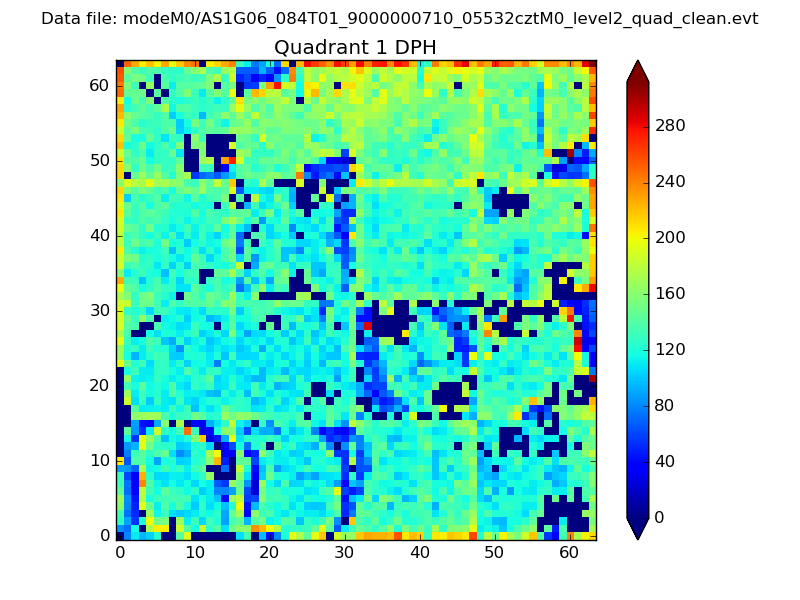 |
Quadrant B |
|---|---|---|---|
| Quadrant D | 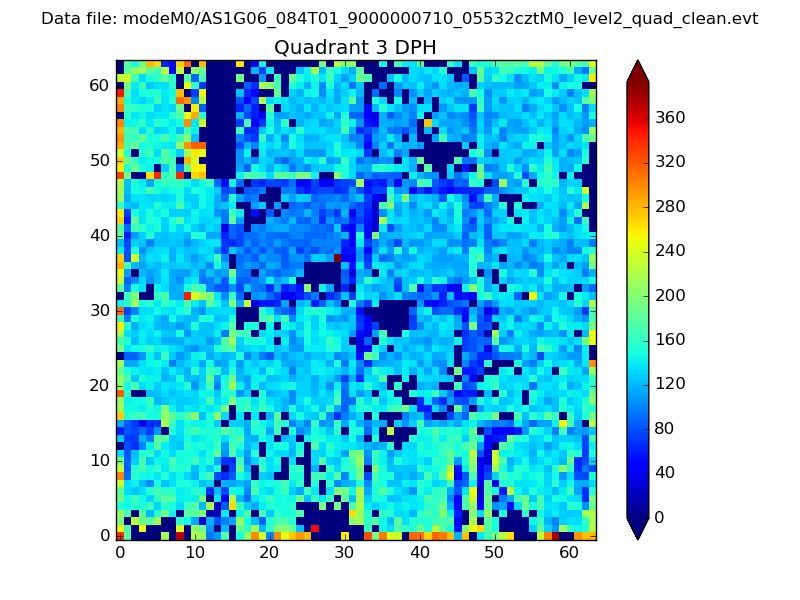 |
 |
Quadrant C |
| Plot type | Count rate plots | Images |
|---|---|---|
| Comparison with Poisson distribution Blue bars denote a histogram of data divided into 1 sec bins. Red curve is a Poisson curve with rate = median count rate of data. |
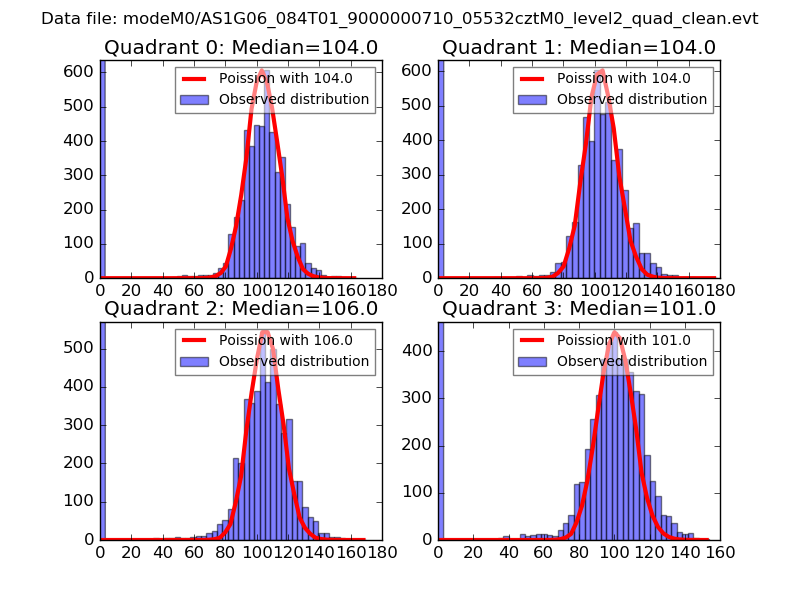 |
 |
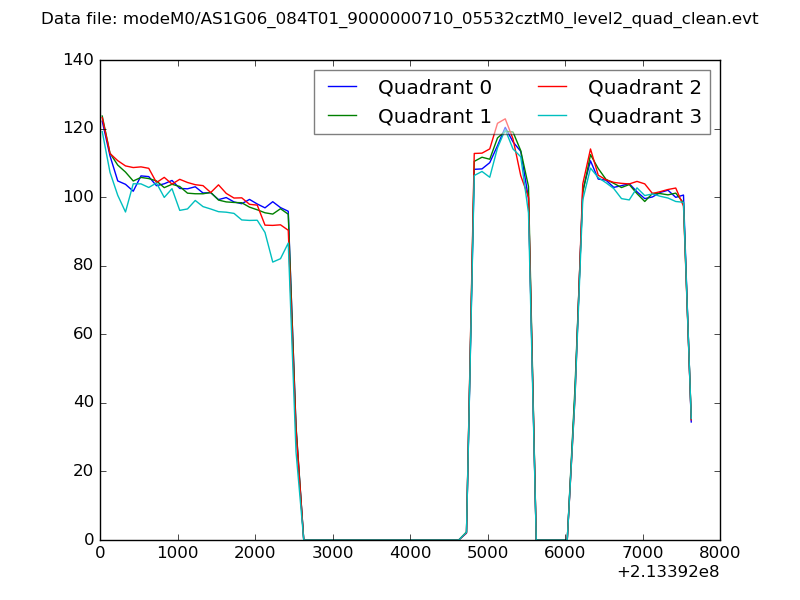
| Quadrant-wise count rates Data is divided into 100 sec bins |
 |
|
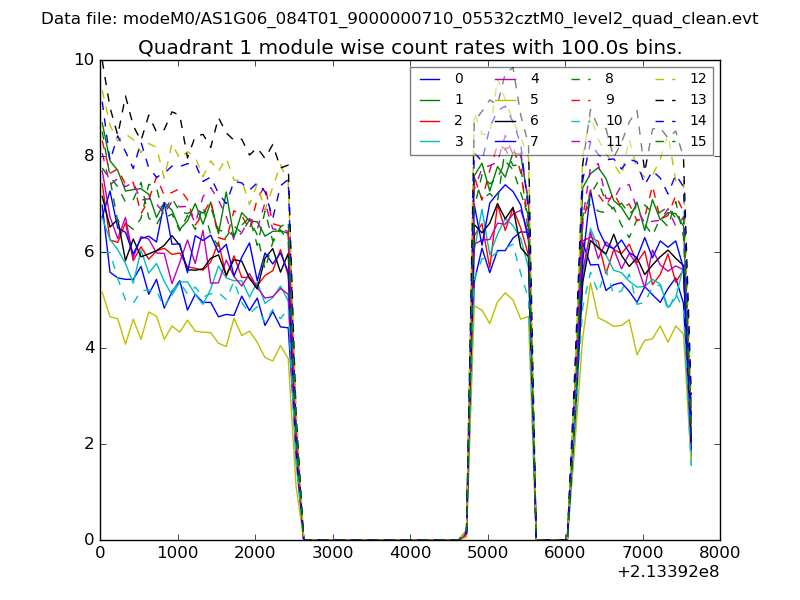
| Module-wise count rates for Quadrant A Data is divided into 100 sec bins |
 |
 |
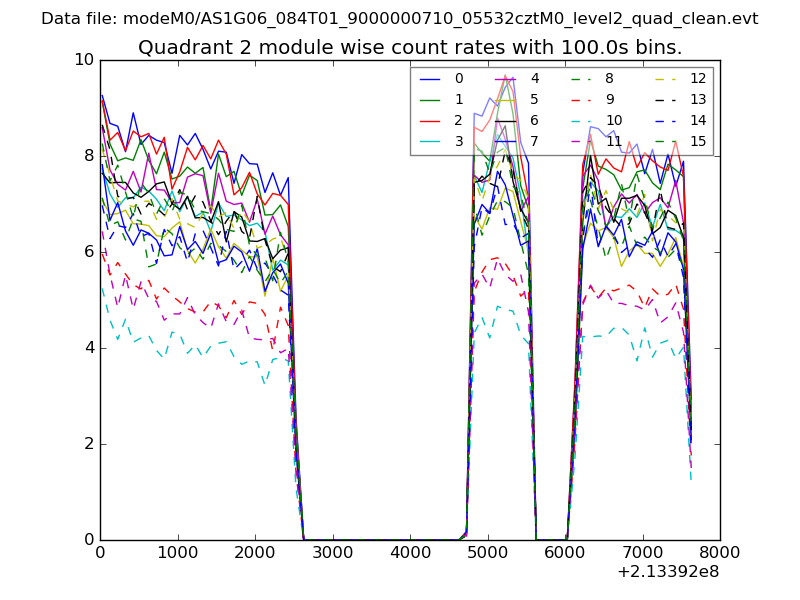
| Module-wise count rates for Quadrant B Data is divided into 100 sec bins |
 |
 |
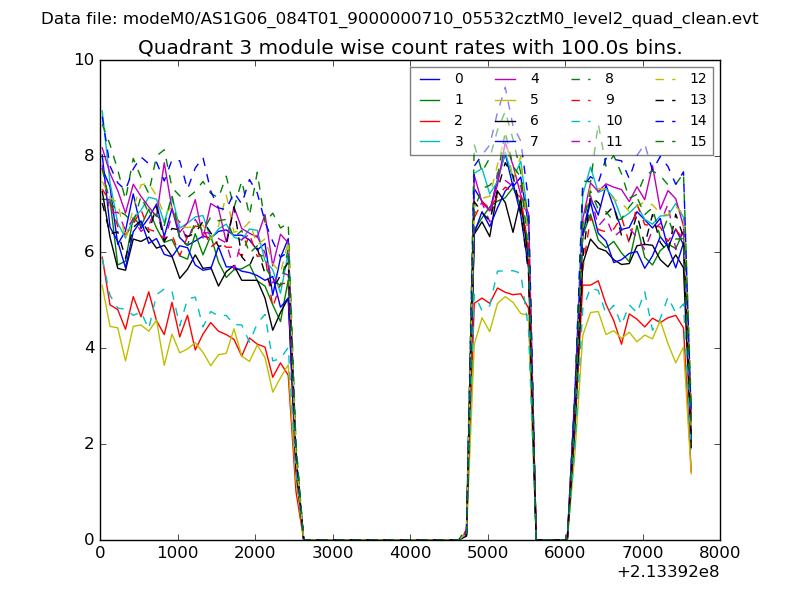
| Module-wise count rates for Quadrant C Data is divided into 100 sec bins |
 |
 |
| Module-wise count rates for Quadrant D Data is divided into 100 sec bins |
 |
 |
| Parameter | Plot |
|---|---|
| CZT HV Monitor | 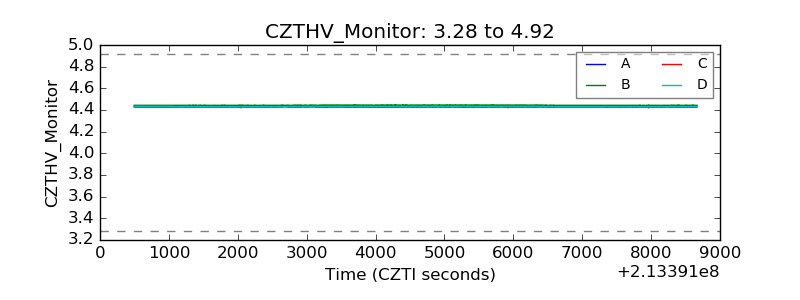 |
| D_VDD | 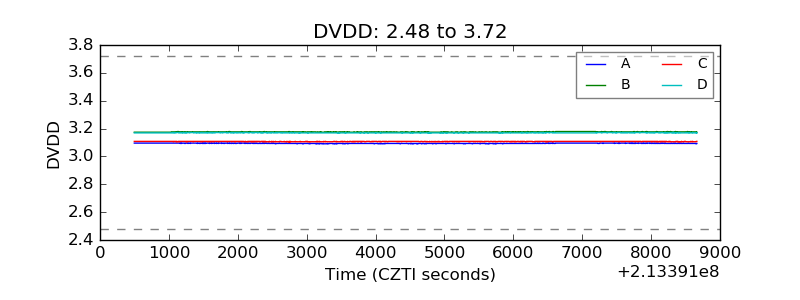 |
| Temperature 1 |  |
| Veto HV Monitor | 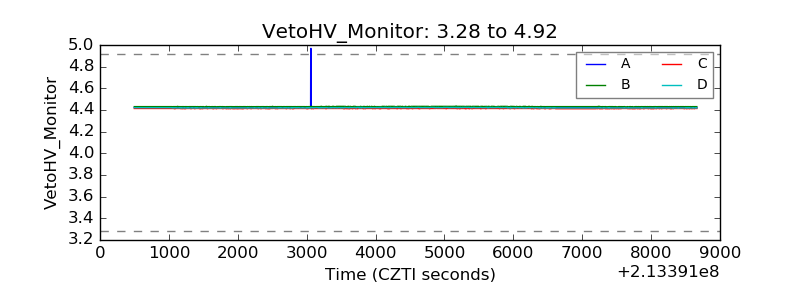 |
| Veto LLD | 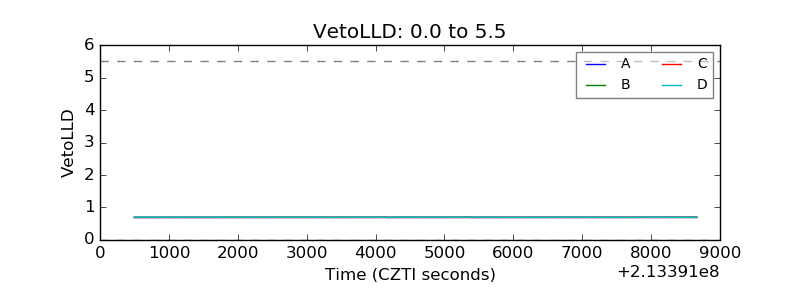 |
| Alpha Counter | 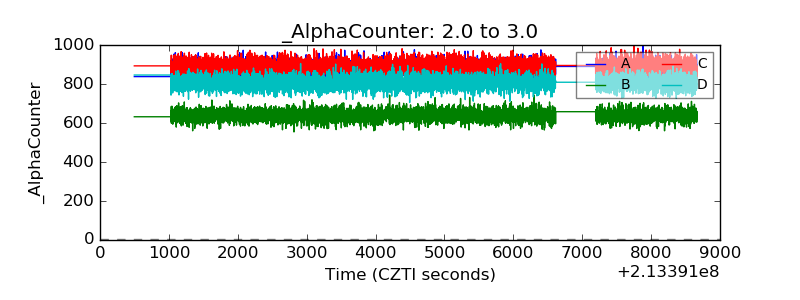 |
| _CPM_Rate | 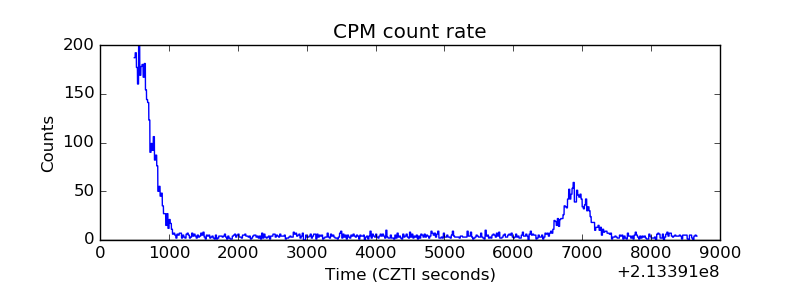 |
| CZT Counter | 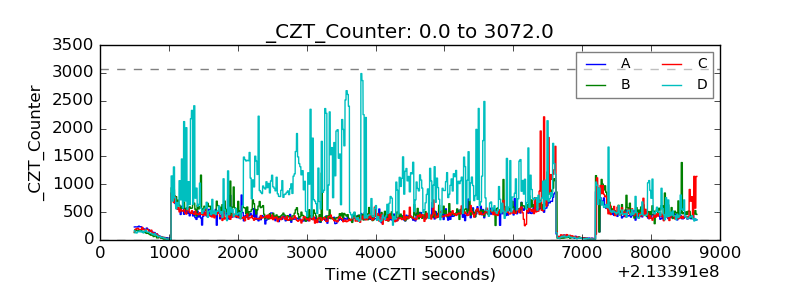 |
| +2.5 Volts monitor |  |
| +5 Volts monitor |  |
| _ROLL_ROT | 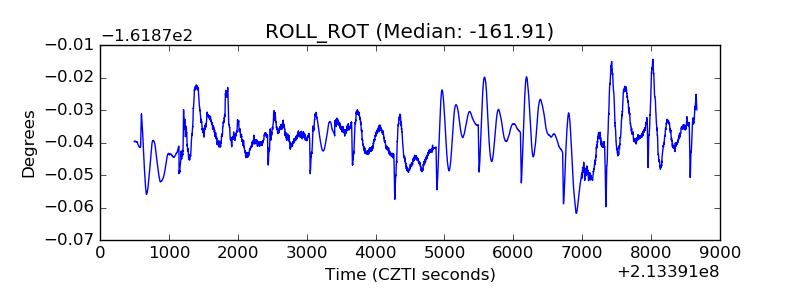 |
| _Roll_DEC | 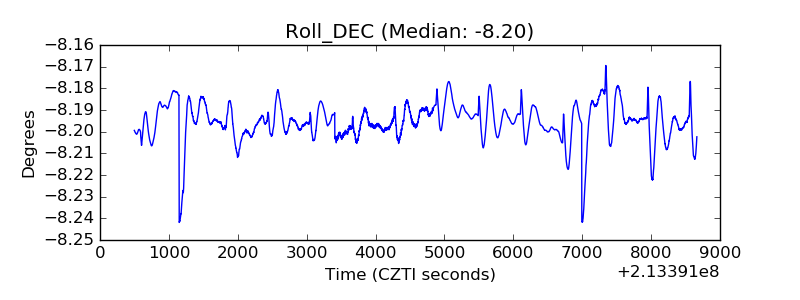 |
| _Roll_RA | 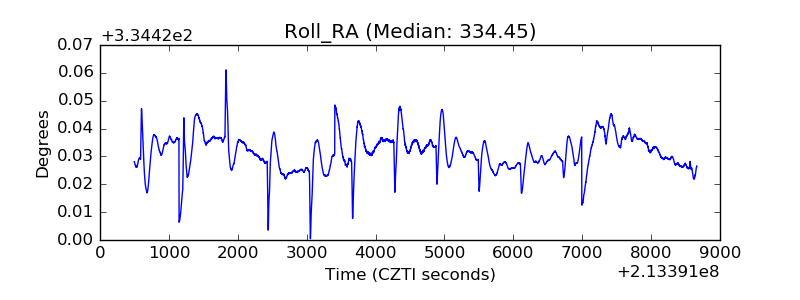 |
| Veto Counter | 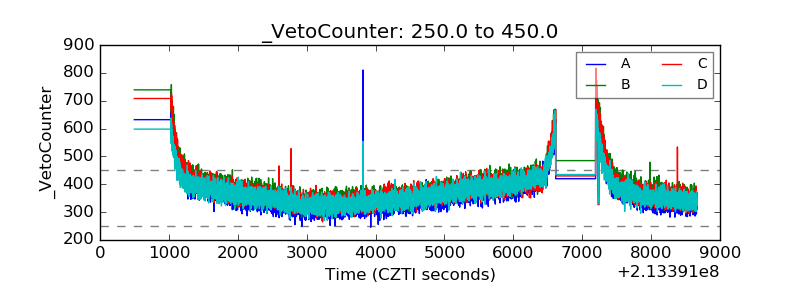 |