| Param | Original file | Final file |
|---|---|---|
| Filename | modeM0/AS1G06_084T01_9000000710_05533cztM0_level2.evt | modeM0/AS1G06_084T01_9000000710_05533cztM0_level2_quad_clean.evt |
| Size (bytes) | 596,566,080 | 97,957,440 |
| Size | 568.9 MB | 93.4 MB |
| Events in quadrant A | 3,693,140 | 603,434 |
| Events in quadrant B | 5,626,208 | 599,254 |
| Events in quadrant C | 4,025,152 | 612,996 |
| Events in quadrant D | 4,179,285 | 593,782 |
| Mode M0 | |||
|---|---|---|---|
| Quadrant | BADHDUFLAG | Total packets | Discarded packets |
| A | 0 | 16686 | 6 |
| B | 0 | 22239 | 3 |
| C | 0 | 17505 | 17 |
| D | 0 | 18042 | 5 |
| Mode M9 | |||
|---|---|---|---|
| Quadrant | BADHDUFLAG | Total packets | Discarded packets |
| A | 0 | 7 | 0 |
| B | 0 | 7 | 0 |
| C | 0 | 7 | 0 |
| D | 0 | 7 | 0 |
| Mode SS | |||
|---|---|---|---|
| Quadrant | BADHDUFLAG | Total packets | Discarded packets |
| A | 0 | 166 | 0 |
| B | 0 | 166 | 0 |
| C | 0 | 166 | 0 |
| D | 0 | 166 | 0 |
| Quadrant | Total seconds | Saturated seconds | Saturation percentage |
|---|---|---|---|
| A | 8006 | 71 | 0.886835% |
| B | 8007 | 367 | 4.583489% |
| C | 8004 | 106 | 1.324338% |
| D | 8006 | 86 | 1.074194% |
Noise dominated data is calculated using 1-second bins in cleaned event files. If a bin has >2000 counts, and if more than 50% of those come from <1% of pixels, then it is considered to be noise-dominated and hence unusable.
| Quadrant | # 1 sec bins | Bins with >0 counts | Bins with >2000 counts | High rate bins dominated by noise | Noise dominated (total time) | Noise dominated (detector-on time) | Marked lightcurve |
|---|---|---|---|---|---|---|---|
| A | 8817 | 8010 | 0 | 0 | 0.00% | 0.00% |  |
| B | 8817 | 8010 | 114 | 114 | 1.29% | 1.42% |  |
| C | 8817 | 8010 | 19 | 19 | 0.22% | 0.24% |  |
| D | 8817 | 8010 | 27 | 27 | 0.31% | 0.34% |  |
Top three noisy pixels from each quadrant. If the there are fewer than three noisy pixels in the level2.evt file, extra rows are filled as -1
| Pixel properties | Quadrant properties | ||||||
|---|---|---|---|---|---|---|---|
| Quadrant | DetID | PixID | Counts | Sigma | Mean | Median | Sigma |
| A | 7 | 16 | 12783 | 60.14 | 954 | 932 | 197.0 |
| A | 12 | 194 | 9535 | 43.66 | 954 | 932 | 197.0 |
| A | 0 | 226 | 9172 | 41.82 | 954 | 932 | 197.0 |
| B | 10 | 246 | 1367872 | 7335.86 | 956 | 931 | 186.3 |
| B | 15 | 204 | 391135 | 2094.08 | 956 | 931 | 186.3 |
| B | 4 | 48 | 59049 | 311.89 | 956 | 931 | 186.3 |
| C | 1 | 241 | 291535 | 1342.2 | 925 | 929 | 216.5 |
| C | 1 | 16 | 119378 | 547.07 | 925 | 929 | 216.5 |
| C | 13 | 61 | 7667 | 31.12 | 925 | 929 | 216.5 |
| D | 2 | 63 | 323681 | 1380.07 | 928 | 898 | 233.9 |
| D | 11 | 192 | 87827 | 371.67 | 928 | 898 | 233.9 |
| D | 2 | 136 | 86589 | 366.37 | 928 | 898 | 233.9 |
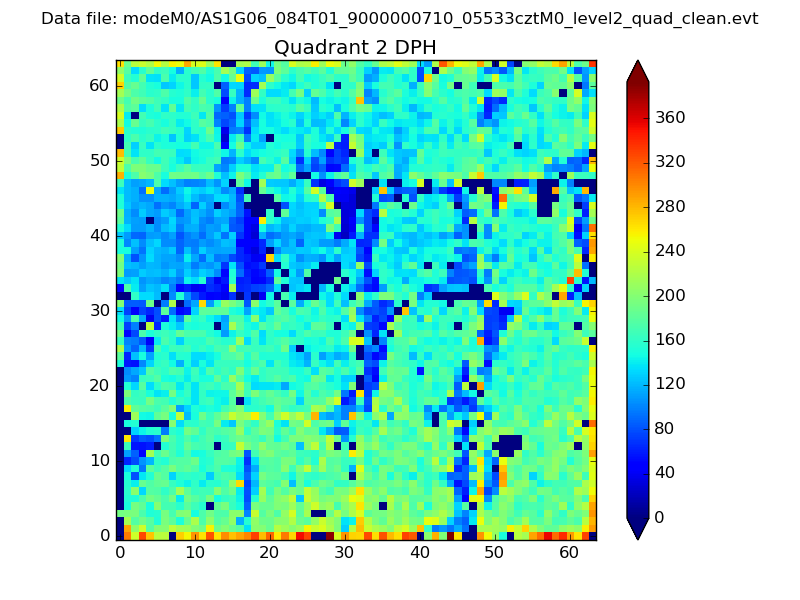
Histogram calculated using DETX and DETY for each event in the final _common_clean file
| Quadrant A | 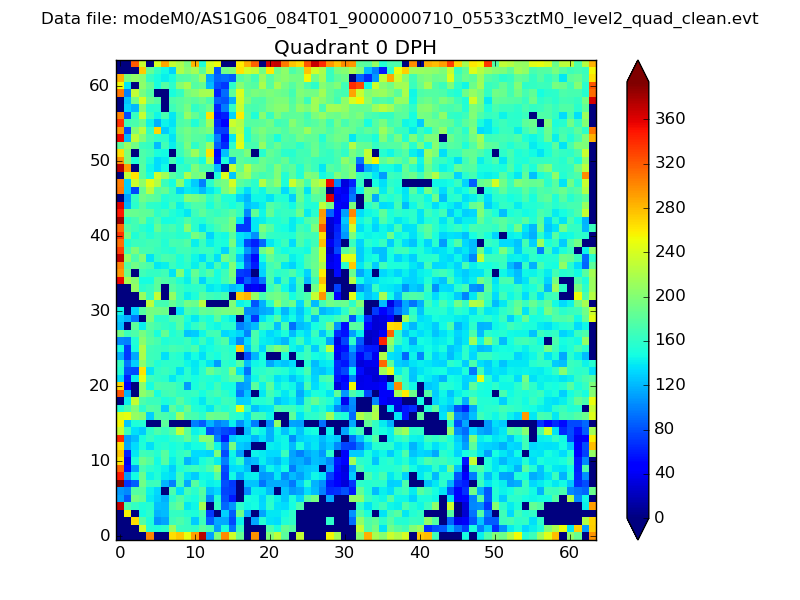 |
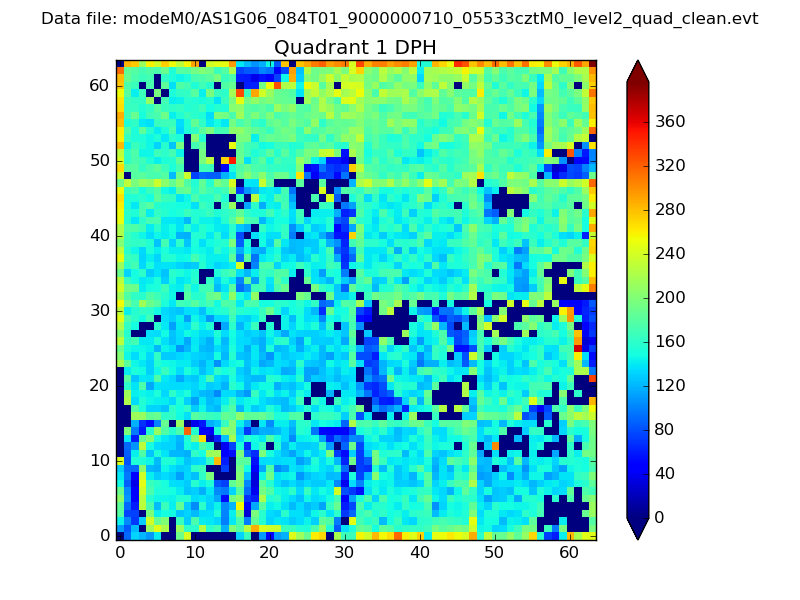 |
Quadrant B |
|---|---|---|---|
| Quadrant D | 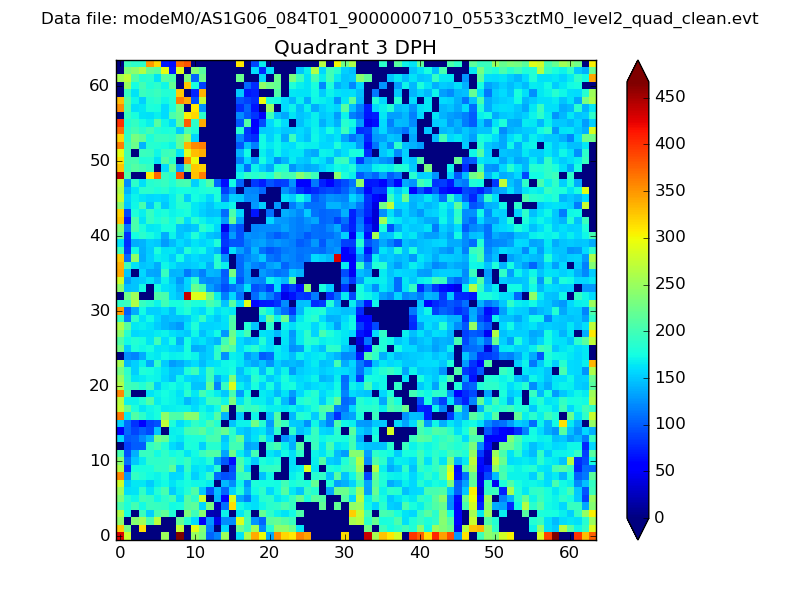 |
 |
Quadrant C |
| Plot type | Count rate plots | Images |
|---|---|---|
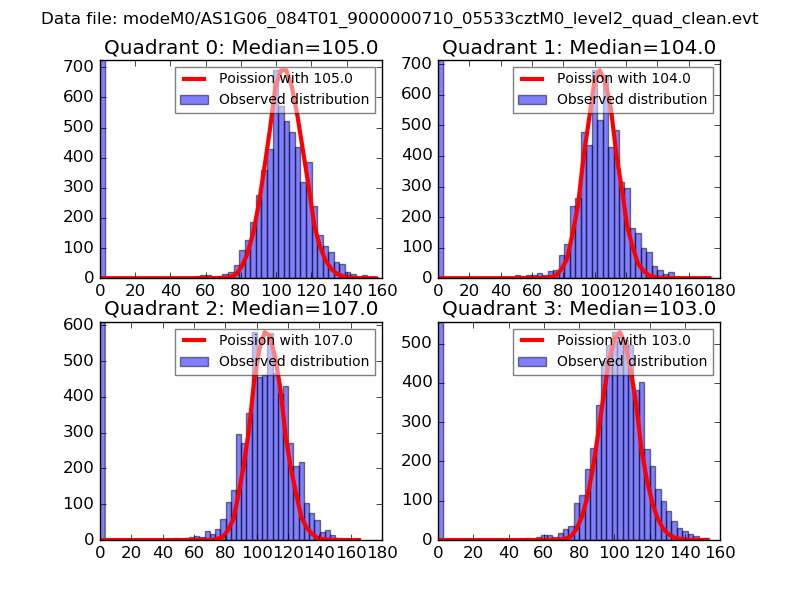
| Comparison with Poisson distribution Blue bars denote a histogram of data divided into 1 sec bins. Red curve is a Poisson curve with rate = median count rate of data. |
 |
 |
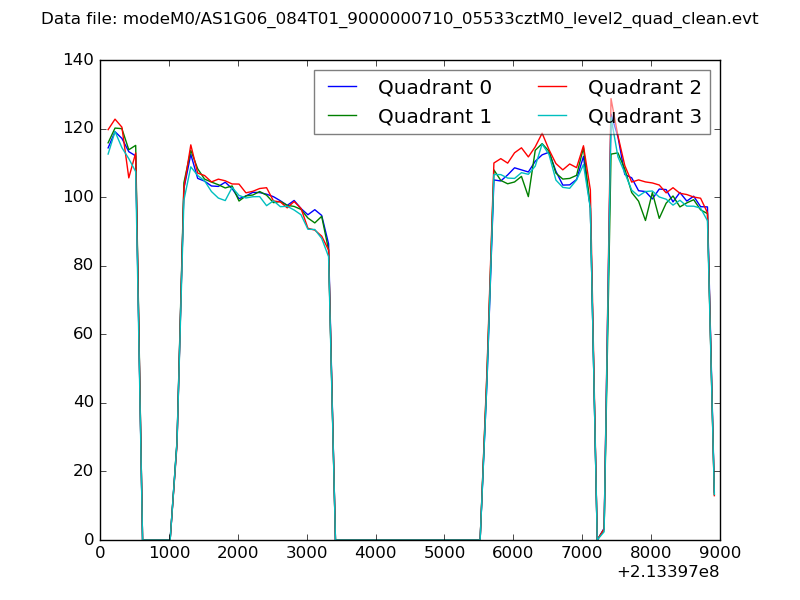
| Quadrant-wise count rates Data is divided into 100 sec bins |
 |
|
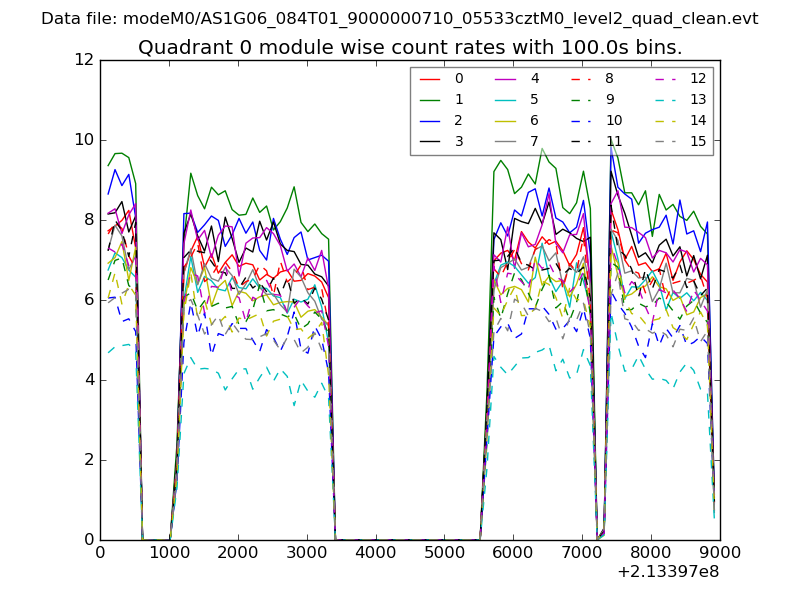
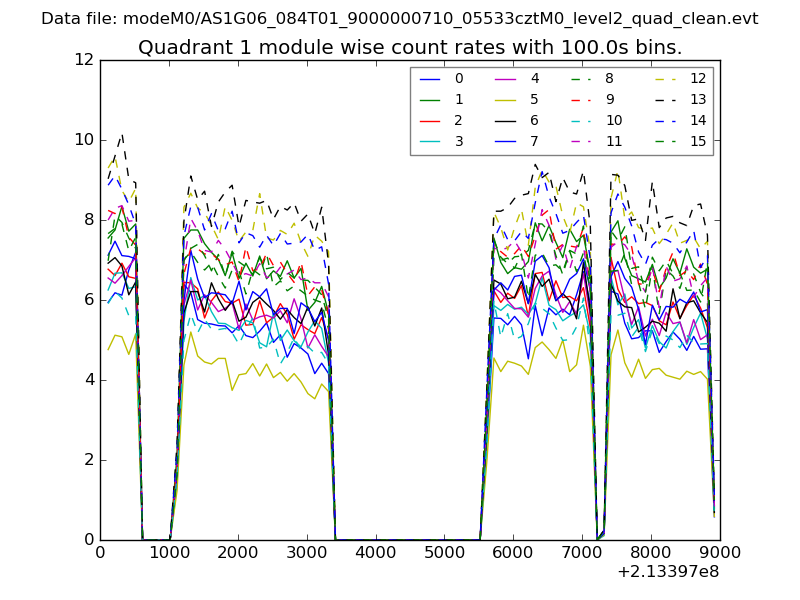
| Module-wise count rates for Quadrant A Data is divided into 100 sec bins |
 |
 |
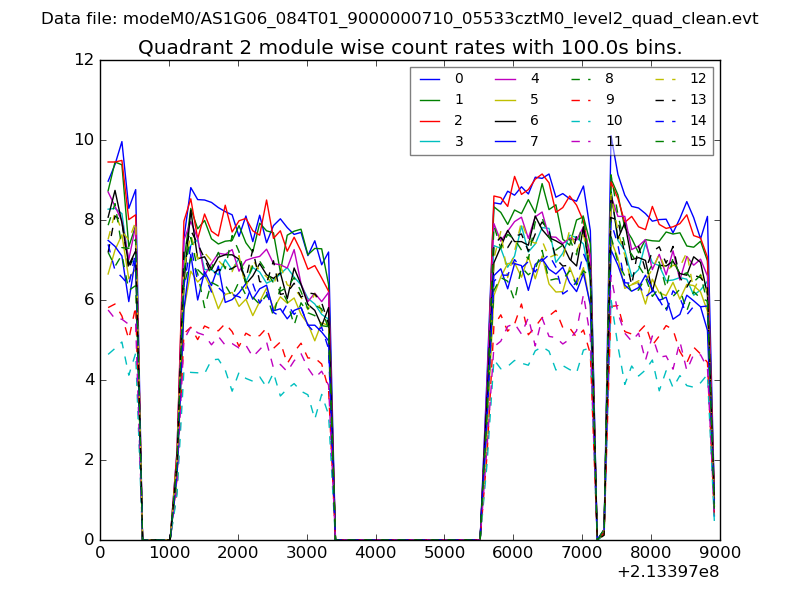
| Module-wise count rates for Quadrant B Data is divided into 100 sec bins |
 |
 |
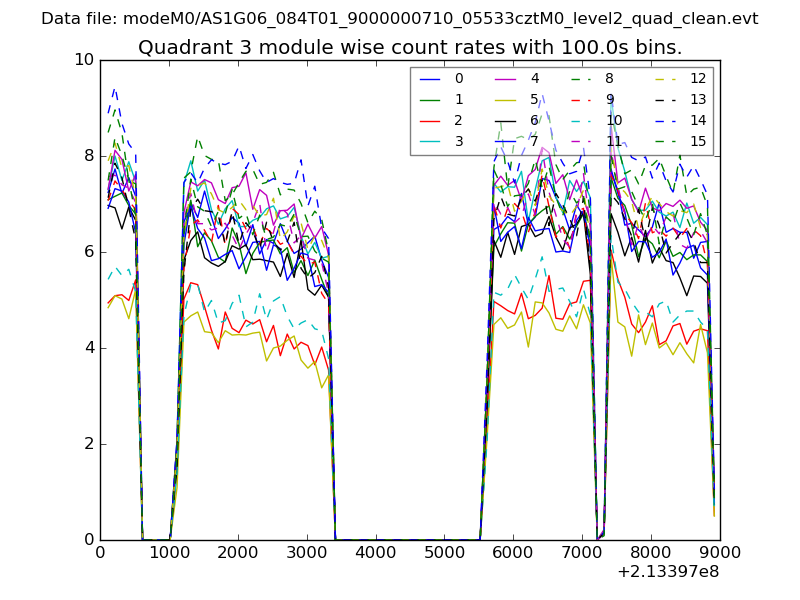
| Module-wise count rates for Quadrant C Data is divided into 100 sec bins |
 |
 |
| Module-wise count rates for Quadrant D Data is divided into 100 sec bins |
 |
 |
| Parameter | Plot |
|---|---|
| CZT HV Monitor | 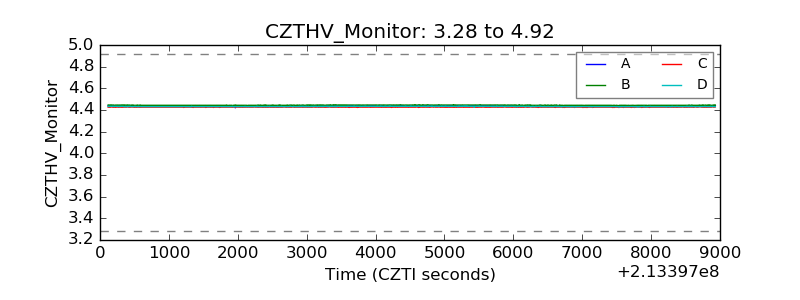 |
| D_VDD | 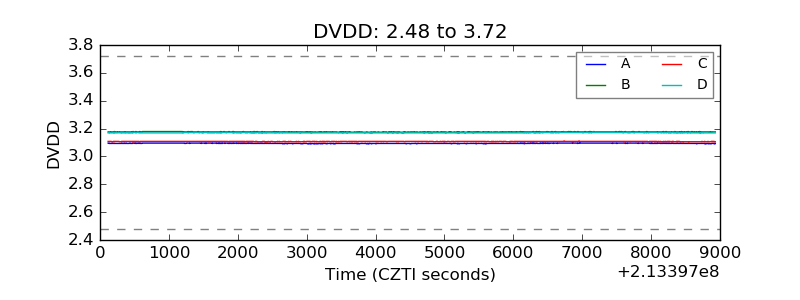 |
| Temperature 1 | 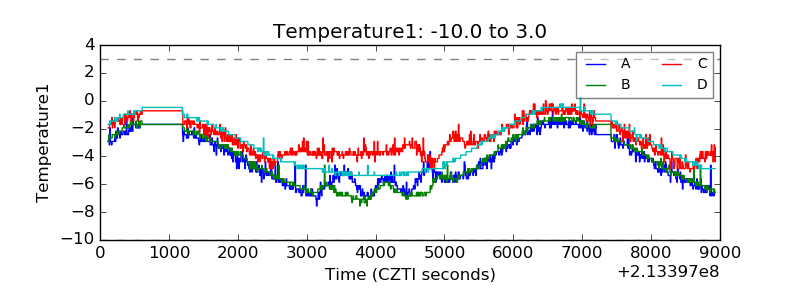 |
| Veto HV Monitor | 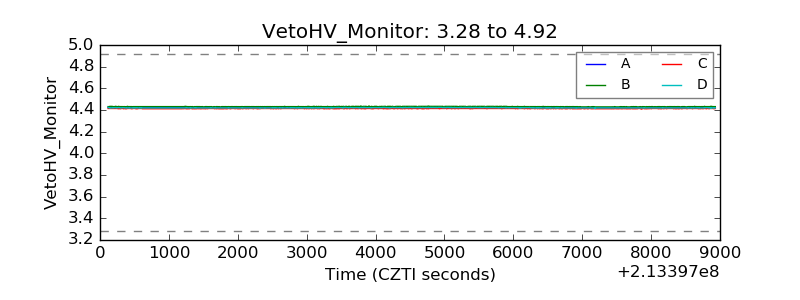 |
| Veto LLD | 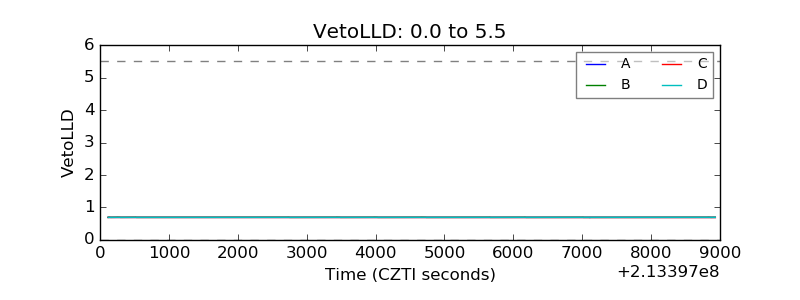 |
| Alpha Counter | 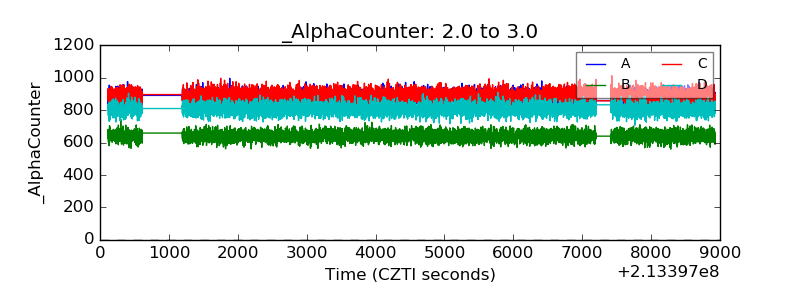 |
| _CPM_Rate | 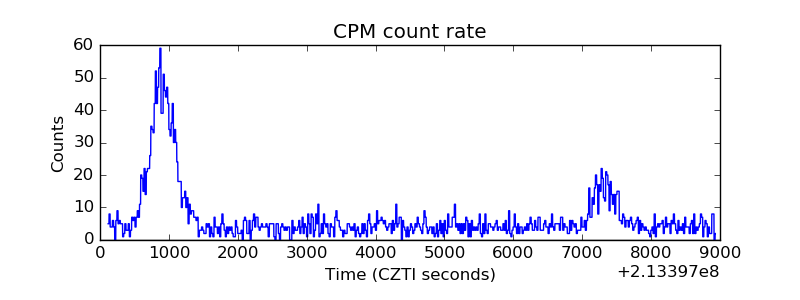 |
| CZT Counter | 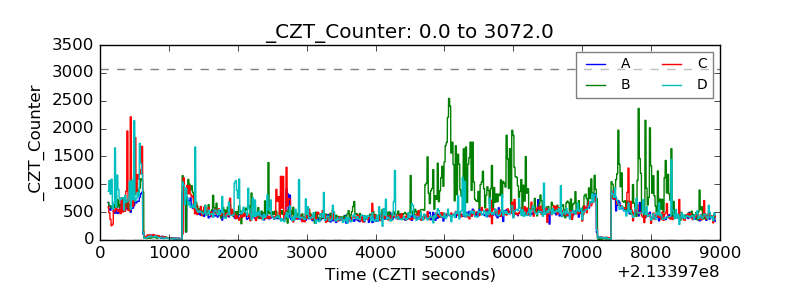 |
| +2.5 Volts monitor |  |
| +5 Volts monitor |  |
| _ROLL_ROT | 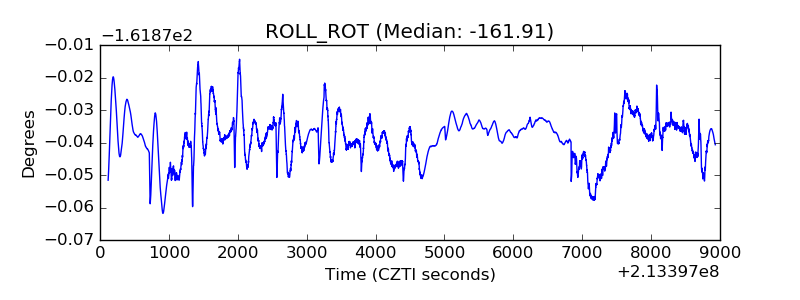 |
| _Roll_DEC | 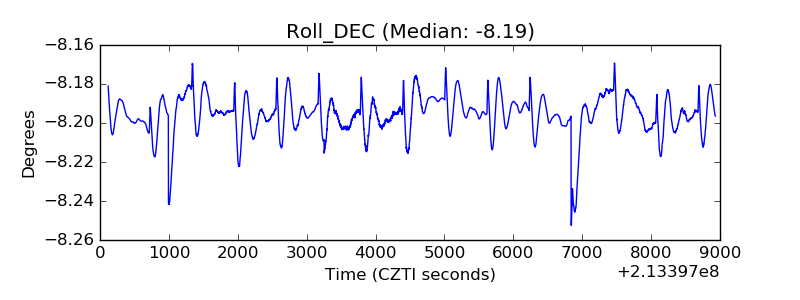 |
| _Roll_RA | 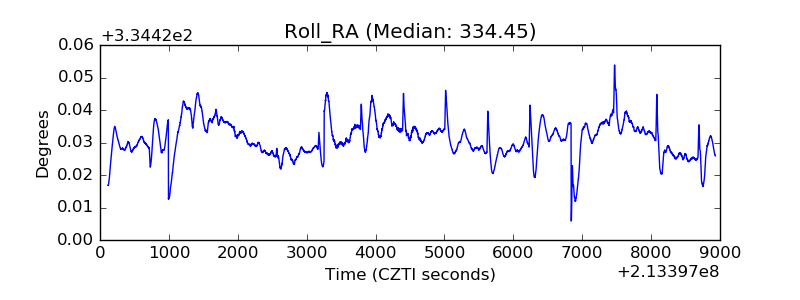 |
| Veto Counter | 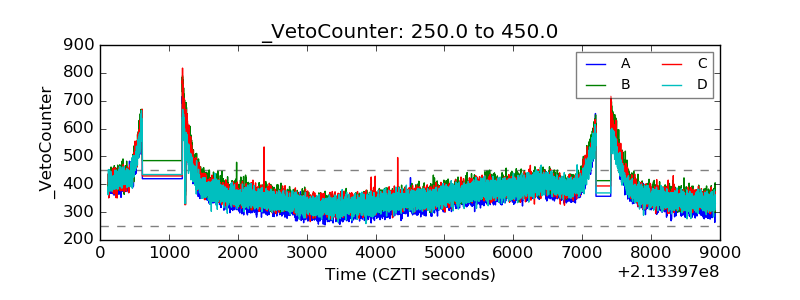 |