| Param | Original file | Final file |
|---|---|---|
| Filename | modeM0/AS1G06_084T01_9000000710_05537cztM0_level2.evt | modeM0/AS1G06_084T01_9000000710_05537cztM0_level2_quad_clean.evt |
| Size (bytes) | 301,858,560 | 48,297,600 |
| Size | 287.9 MB | 46.1 MB |
| Events in quadrant A | 2,590,124 | 337,213 |
| Events in quadrant B | 2,822,887 | 321,428 |
| Events in quadrant C | 2,594,464 | 341,595 |
| Events in quadrant D | 795,170 | 115,023 |
| Mode M0 | |||
|---|---|---|---|
| Quadrant | BADHDUFLAG | Total packets | Discarded packets |
| A | 0 | 39511 | 27565 |
| B | 0 | 41451 | 29160 |
| C | 0 | 40628 | 28809 |
| D | 0 | 42788 | 39163 |
| Mode M9 | |||
|---|---|---|---|
| Quadrant | BADHDUFLAG | Total packets | Discarded packets |
| A | 0 | 20 | 13 |
| B | 0 | 22 | 15 |
| C | 0 | 20 | 14 |
| D | 0 | 21 | 14 |
| Mode SS | |||
|---|---|---|---|
| Quadrant | BADHDUFLAG | Total packets | Discarded packets |
| A | 0 | 397 | 257 |
| B | 0 | 396 | 297 |
| C | 0 | 392 | 248 |
| D | 0 | 398 | 282 |
| Quadrant | Total seconds | Saturated seconds | Saturation percentage |
|---|---|---|---|
| A | 5883 | 24 | 0.407955% |
| B | 5888 | 40 | 0.679348% |
| C | 5786 | 19 | 0.328379% |
| D | 1733 | 12 | 0.692441% |
Noise dominated data is calculated using 1-second bins in cleaned event files. If a bin has >2000 counts, and if more than 50% of those come from <1% of pixels, then it is considered to be noise-dominated and hence unusable.
| Quadrant | # 1 sec bins | Bins with >0 counts | Bins with >2000 counts | High rate bins dominated by noise | Noise dominated (total time) | Noise dominated (detector-on time) | Marked lightcurve |
|---|---|---|---|---|---|---|---|
| A | 21430 | 8424 | 0 | 0 | 0.00% | 0.00% | 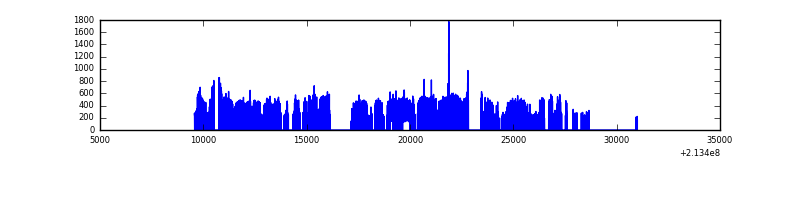 |
| B | 21431 | 8458 | 0 | 0 | 0.00% | 0.00% |  |
| C | 21622 | 8377 | 1 | 1 | 0.00% | 0.01% | 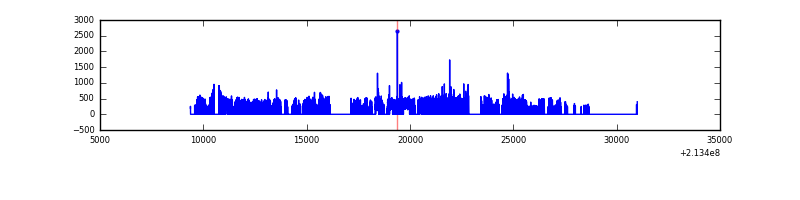 |
| D | 6445 | 2678 | 7 | 7 | 0.11% | 0.26% | 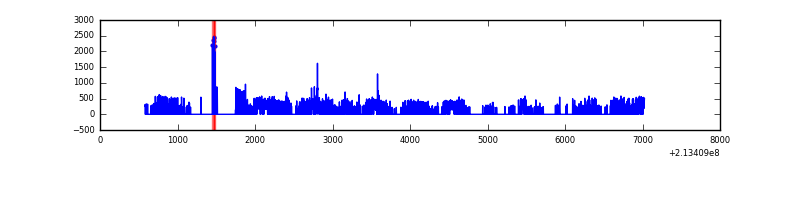 |
Top three noisy pixels from each quadrant. If the there are fewer than three noisy pixels in the level2.evt file, extra rows are filled as -1
| Pixel properties | Quadrant properties | ||||||
|---|---|---|---|---|---|---|---|
| Quadrant | DetID | PixID | Counts | Sigma | Mean | Median | Sigma |
| A | 0 | 50 | 14474 | 99.0 | 668 | 651 | 139.6 |
| A | 12 | 194 | 6446 | 41.5 | 668 | 651 | 139.6 |
| A | 0 | 226 | 6429 | 41.38 | 668 | 651 | 139.6 |
| B | 15 | 204 | 163990 | 1237.22 | 673 | 654 | 132.0 |
| B | 11 | 51 | 17262 | 125.8 | 673 | 654 | 132.0 |
| B | 4 | 48 | 16563 | 120.51 | 673 | 654 | 132.0 |
| C | 1 | 16 | 72715 | 480.6 | 638 | 642 | 150.0 |
| C | 9 | 16 | 28610 | 186.5 | 638 | 642 | 150.0 |
| C | 13 | 61 | 5319 | 31.19 | 638 | 642 | 150.0 |
| D | 2 | 152 | 24993 | 500.51 | 193 | 187 | 49.6 |
| D | 2 | 14 | 18742 | 374.38 | 193 | 187 | 49.6 |
| D | 8 | 195 | 11454 | 227.33 | 193 | 187 | 49.6 |
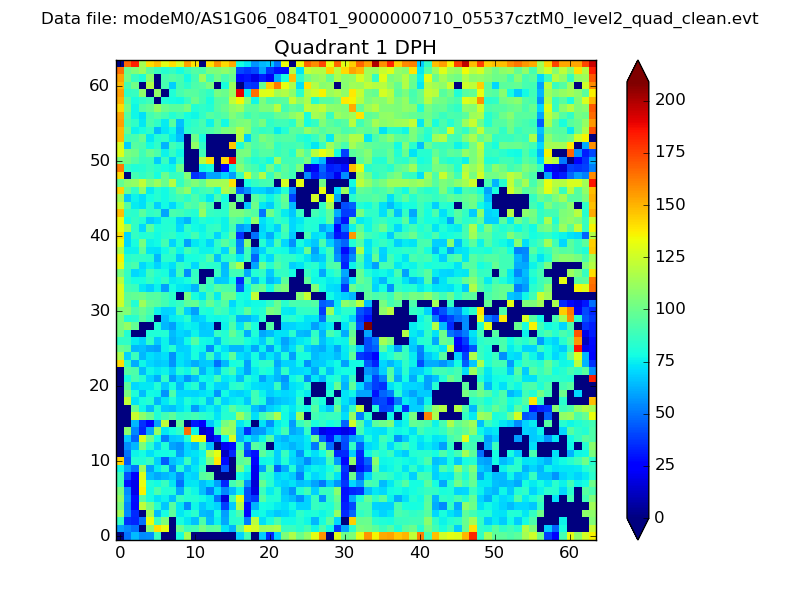
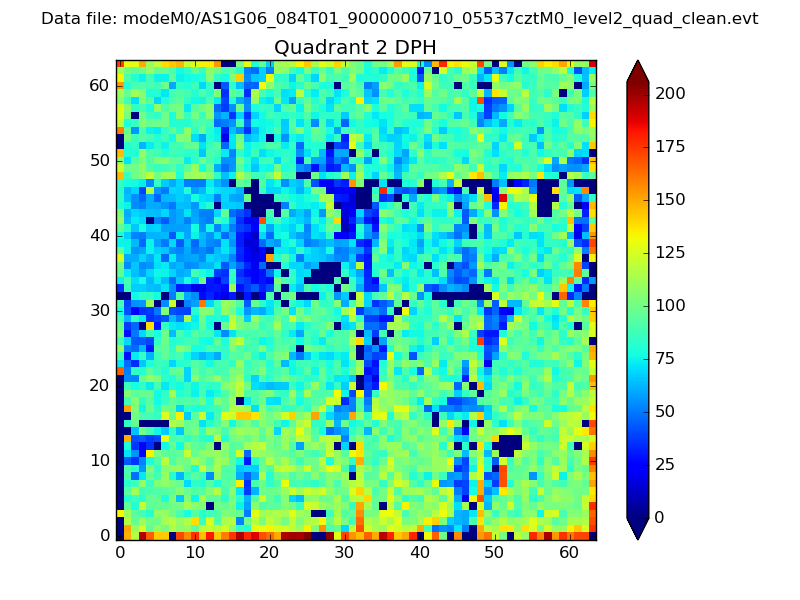
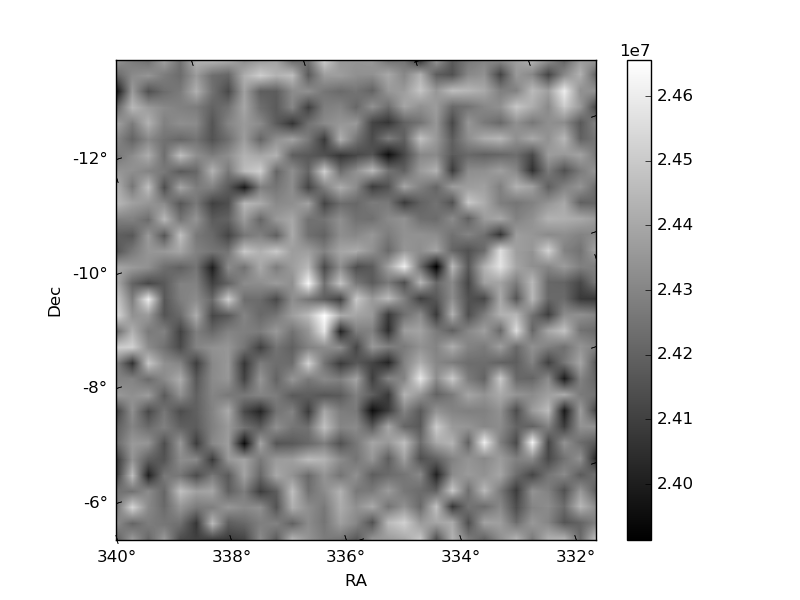
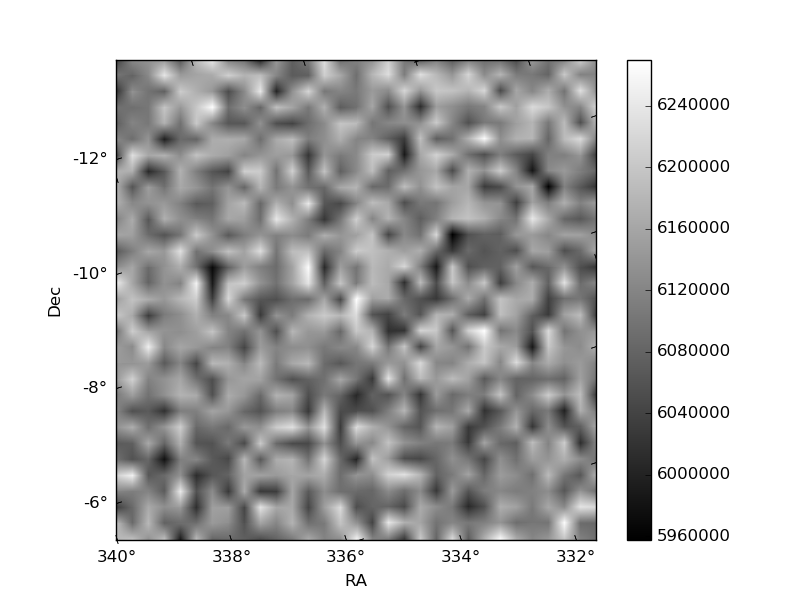
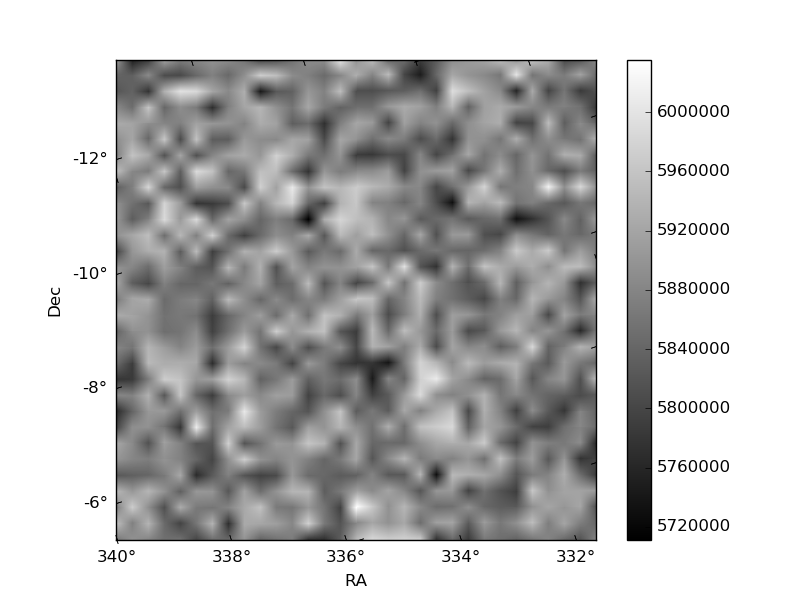
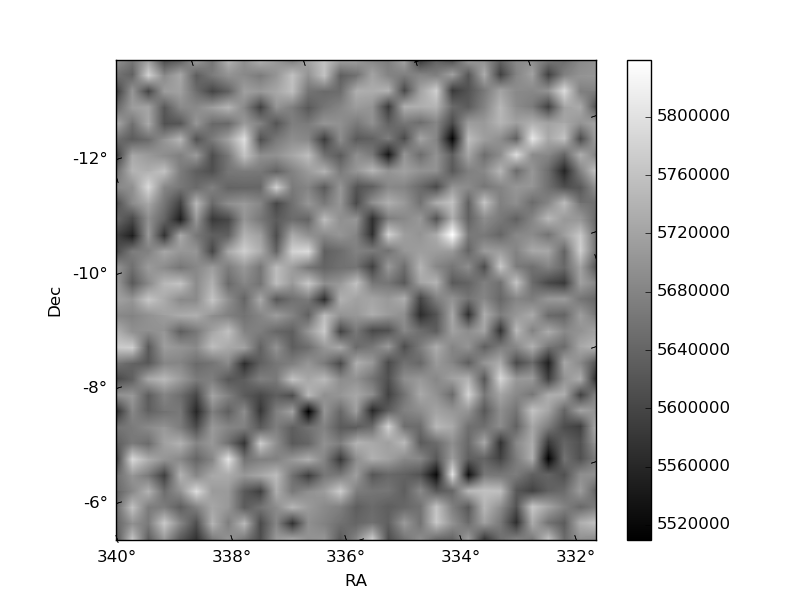
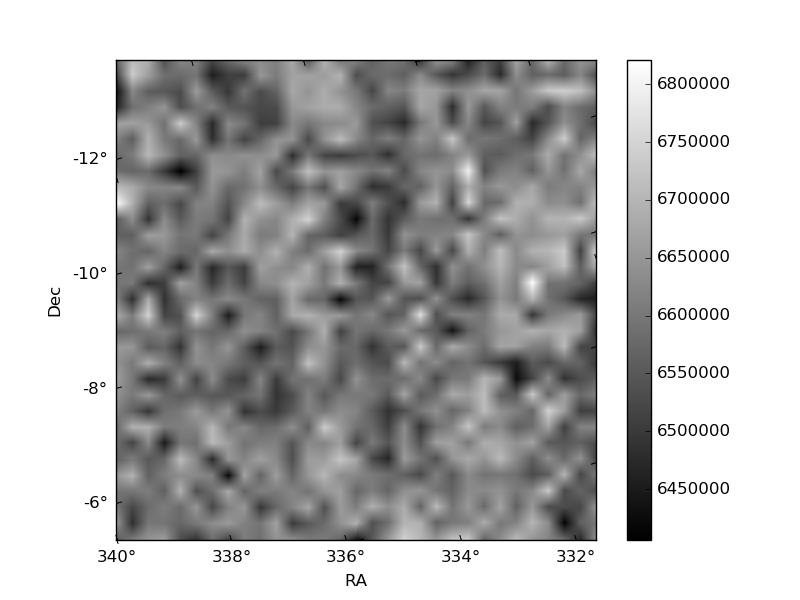
Histogram calculated using DETX and DETY for each event in the final _common_clean file
| Quadrant A | 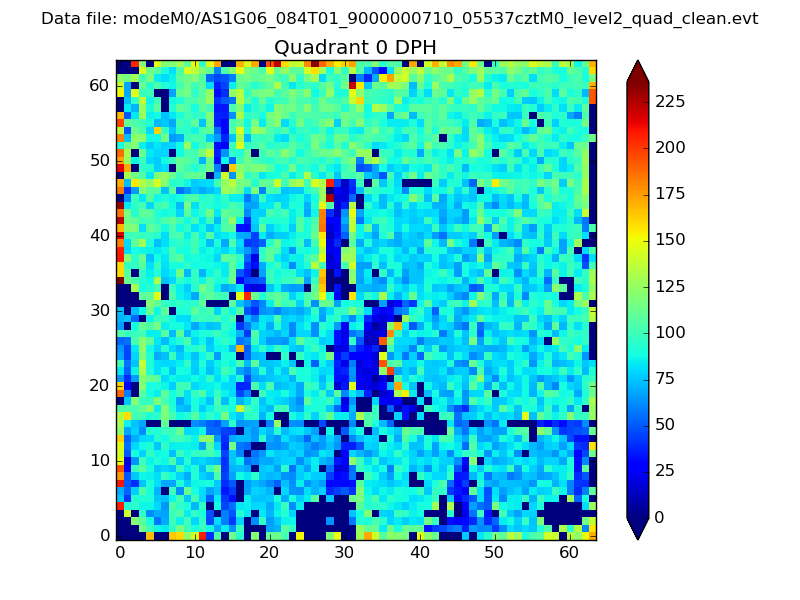 |
 |
Quadrant B |
|---|---|---|---|
| Quadrant D | 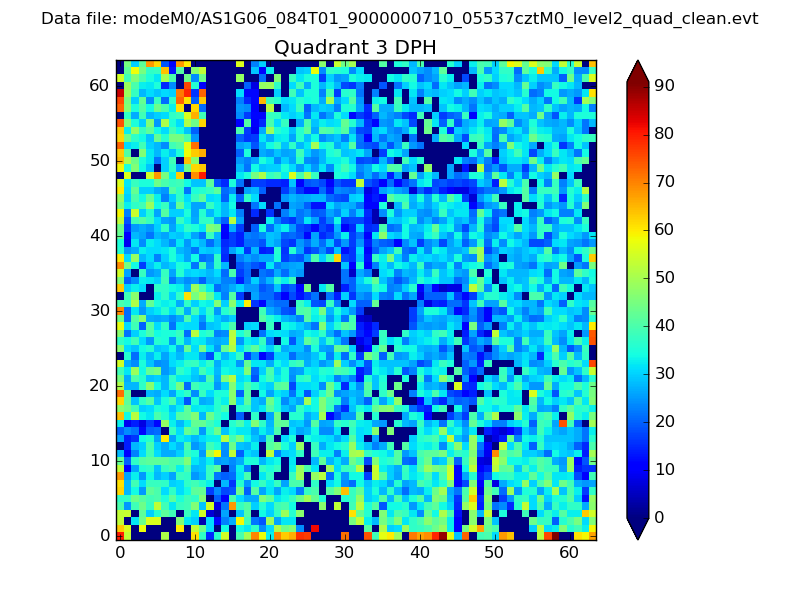 |
 |
Quadrant C |
| Plot type | Count rate plots | Images |
|---|---|---|
| Comparison with Poisson distribution Blue bars denote a histogram of data divided into 1 sec bins. Red curve is a Poisson curve with rate = median count rate of data. |
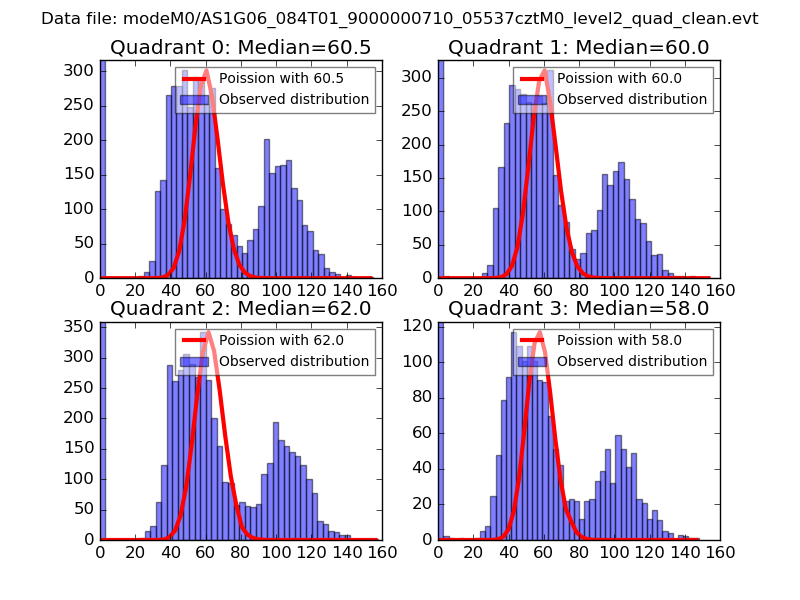 |
 |
| Quadrant-wise count rates Data is divided into 100 sec bins |
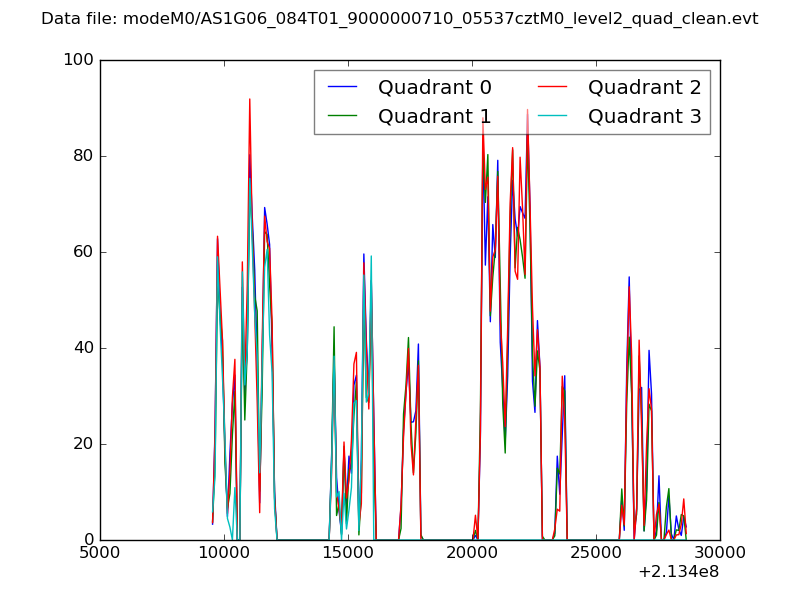 |
|
| Module-wise count rates for Quadrant A Data is divided into 100 sec bins |
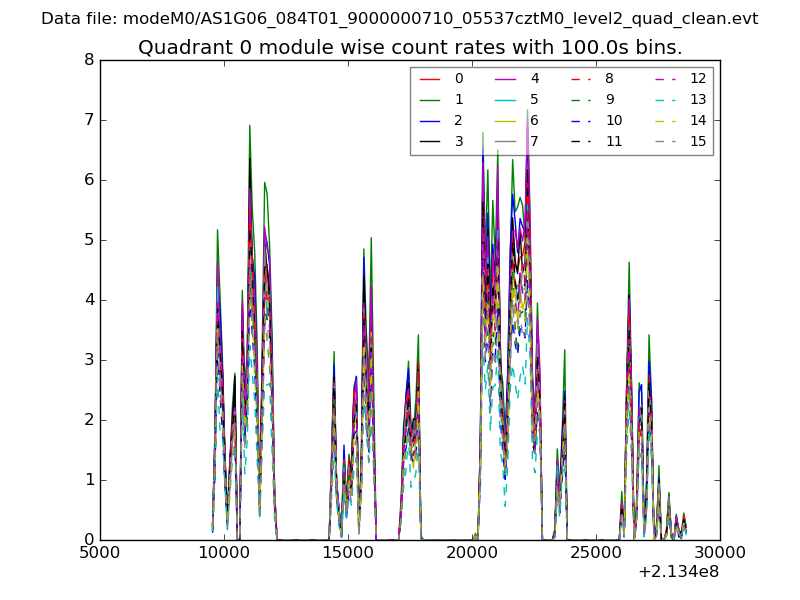 |
 |
| Module-wise count rates for Quadrant B Data is divided into 100 sec bins |
 |
 |
| Module-wise count rates for Quadrant C Data is divided into 100 sec bins |
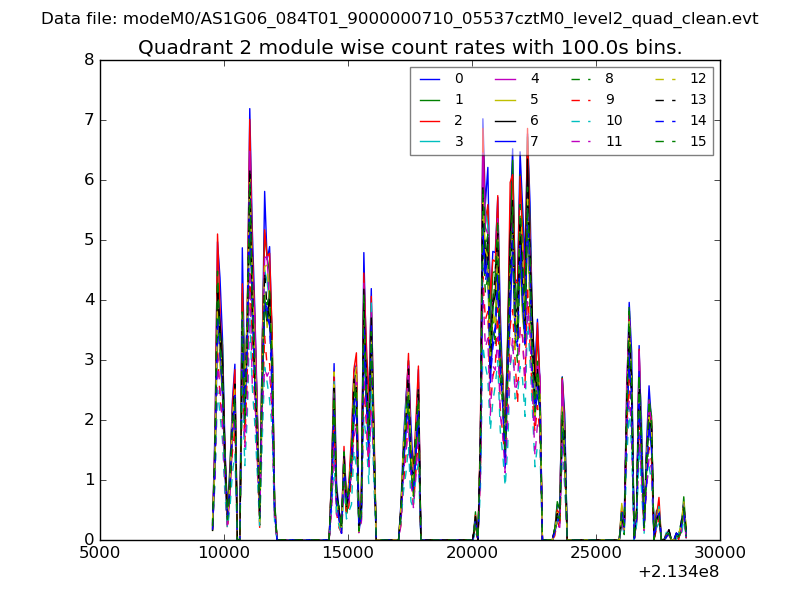 |
 |
| Module-wise count rates for Quadrant D Data is divided into 100 sec bins |
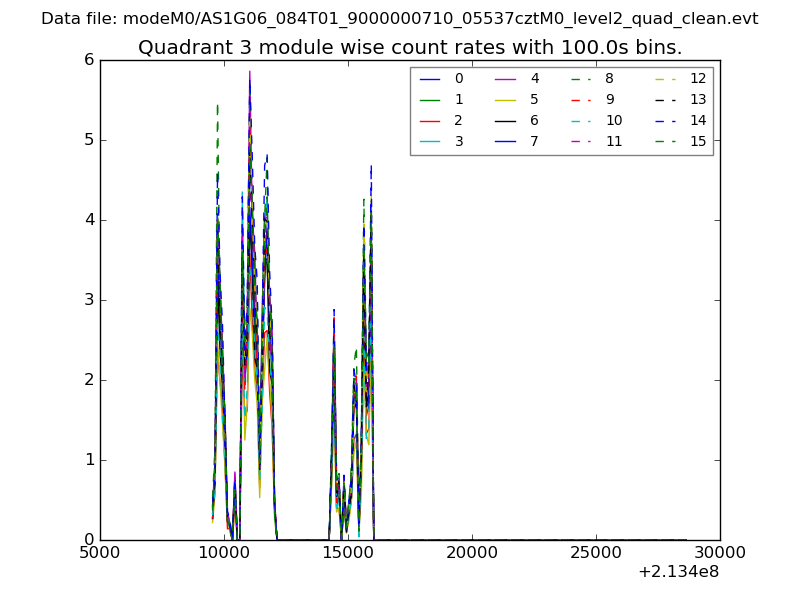 |
 |
| Parameter | Plot |
|---|---|
| CZT HV Monitor | 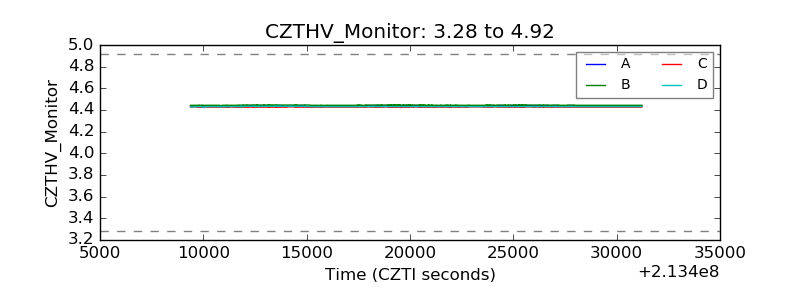 |
| D_VDD | 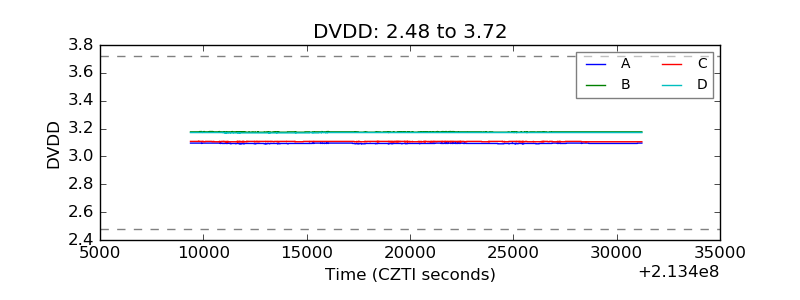 |
| Temperature 1 | 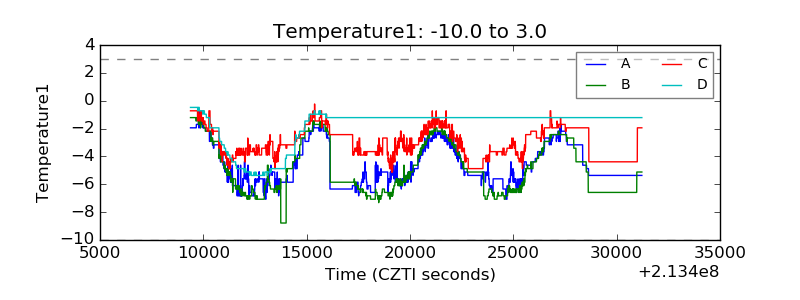 |
| Veto HV Monitor | 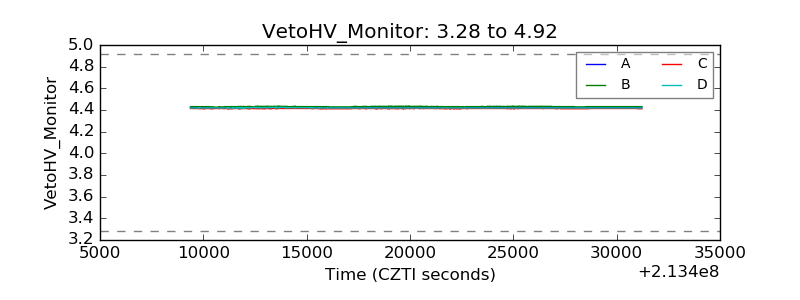 |
| Veto LLD | 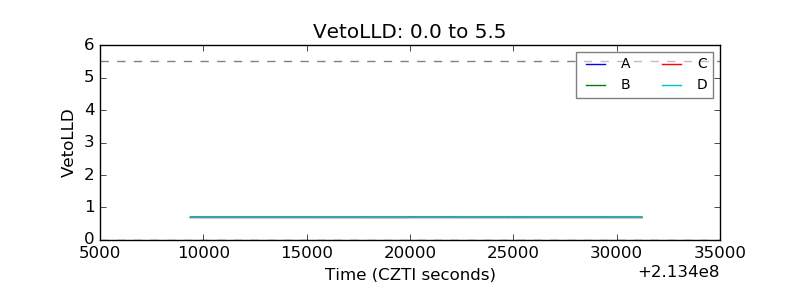 |
| Alpha Counter | 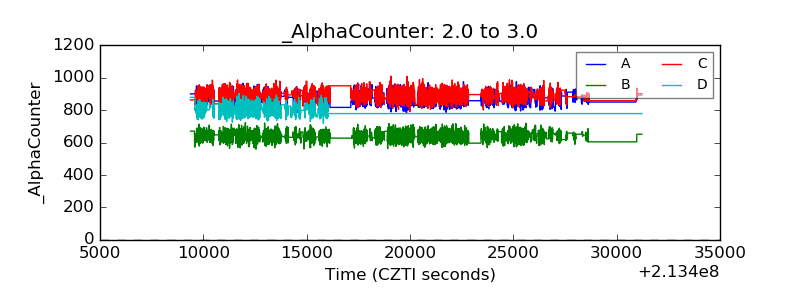 |
| _CPM_Rate | 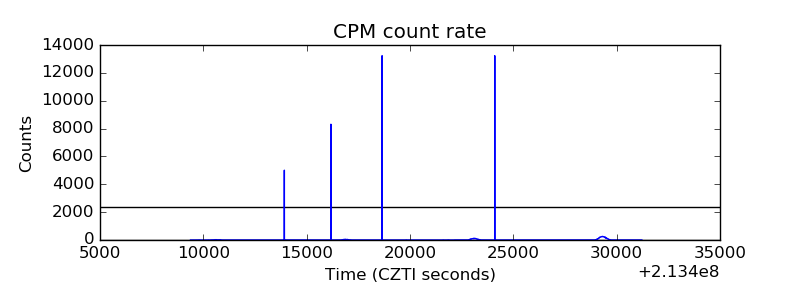 |
| CZT Counter | 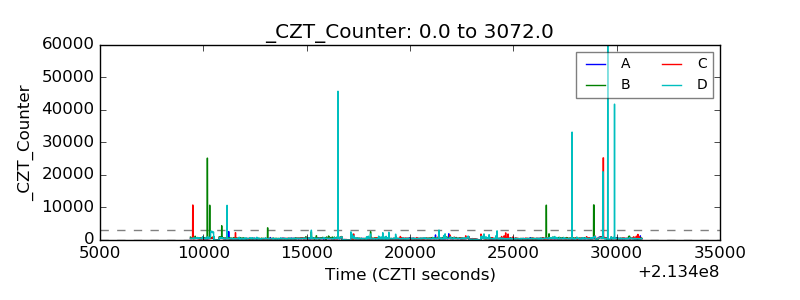 |
| +2.5 Volts monitor |  |
| +5 Volts monitor | 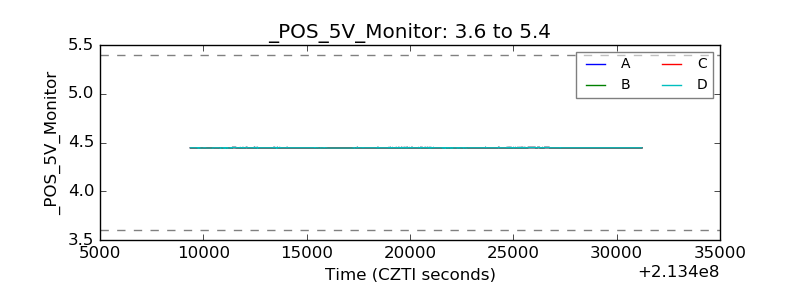 |
| _ROLL_ROT | 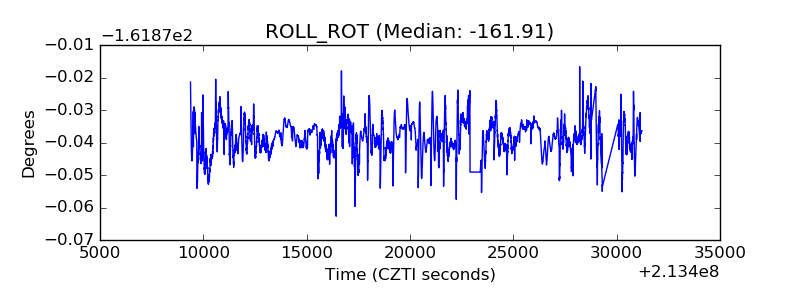 |
| _Roll_DEC | 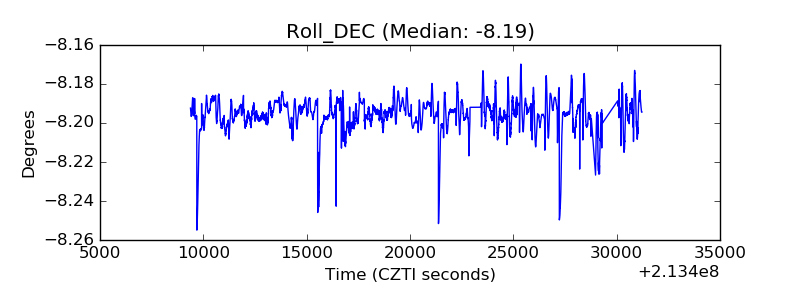 |
| _Roll_RA | 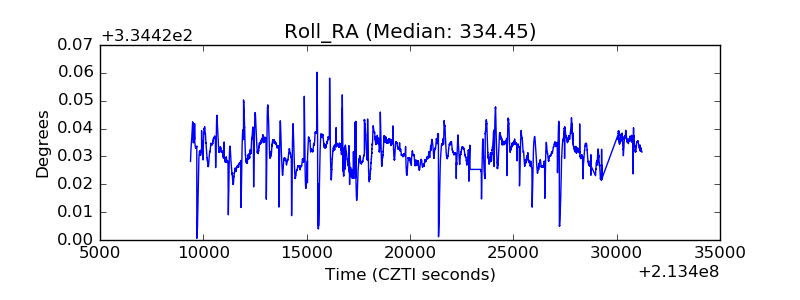 |
| Veto Counter | 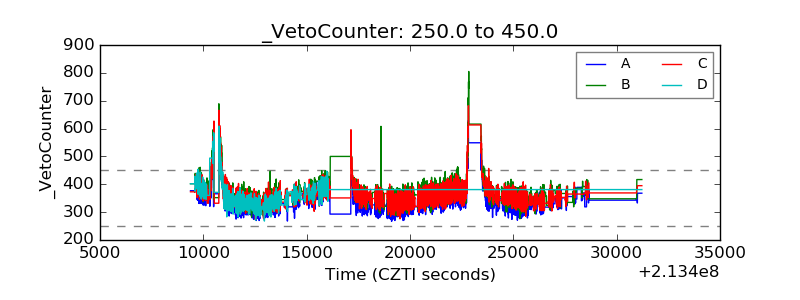 |