| Param | Original file | Final file |
|---|---|---|
| Filename | modeM0/AS1G06_084T01_9000000710_05538cztM0_level2.evt | modeM0/AS1G06_084T01_9000000710_05538cztM0_level2_quad_clean.evt |
| Size (bytes) | 1,222,188,480 | 179,363,520 |
| Size | 1.1 GB | 171.1 MB |
| Events in quadrant A | 8,375,276 | 1,045,548 |
| Events in quadrant B | 9,200,364 | 1,031,357 |
| Events in quadrant C | 8,945,951 | 1,061,245 |
| Events in quadrant D | 9,223,689 | 1,005,452 |
| Mode M0 | |||
|---|---|---|---|
| Quadrant | BADHDUFLAG | Total packets | Discarded packets |
| A | 0 | 48406 | 10214 |
| B | 0 | 50480 | 11091 |
| C | 0 | 50294 | 10902 |
| D | 0 | 52742 | 11987 |
| Mode M9 | |||
|---|---|---|---|
| Quadrant | BADHDUFLAG | Total packets | Discarded packets |
| A | 0 | 27 | 7 |
| B | 0 | 27 | 4 |
| C | 0 | 27 | 4 |
| D | 0 | 27 | 5 |
| Mode SS | |||
|---|---|---|---|
| Quadrant | BADHDUFLAG | Total packets | Discarded packets |
| A | 0 | 480 | 100 |
| B | 0 | 480 | 92 |
| C | 0 | 479 | 79 |
| D | 0 | 480 | 98 |
| Quadrant | Total seconds | Saturated seconds | Saturation percentage |
|---|---|---|---|
| A | 18730 | 126 | 0.672718% |
| B | 18608 | 186 | 0.999570% |
| C | 18652 | 162 | 0.868540% |
| D | 18467 | 318 | 1.721991% |
Noise dominated data is calculated using 1-second bins in cleaned event files. If a bin has >2000 counts, and if more than 50% of those come from <1% of pixels, then it is considered to be noise-dominated and hence unusable.
| Quadrant | # 1 sec bins | Bins with >0 counts | Bins with >2000 counts | High rate bins dominated by noise | Noise dominated (total time) | Noise dominated (detector-on time) | Marked lightcurve |
|---|---|---|---|---|---|---|---|
| A | 26338 | 21703 | 6 | 6 | 0.02% | 0.03% |  |
| B | 26338 | 21643 | 9 | 9 | 0.03% | 0.04% | 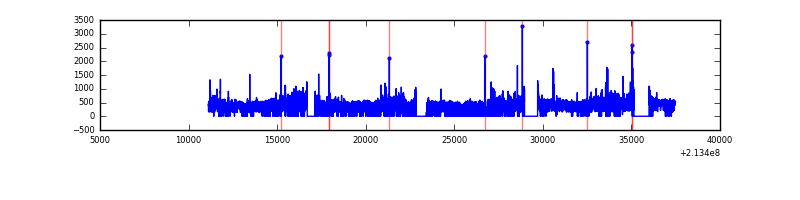 |
| C | 26338 | 21637 | 37 | 37 | 0.14% | 0.17% | 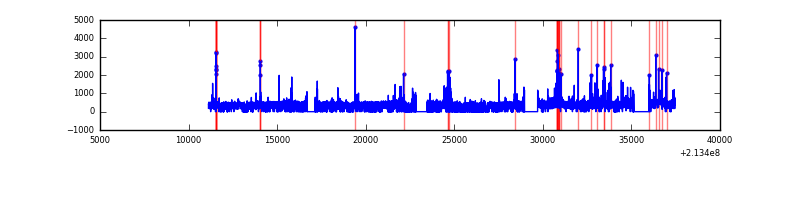 |
| D | 26337 | 21564 | 166 | 166 | 0.63% | 0.77% |  |
Top three noisy pixels from each quadrant. If the there are fewer than three noisy pixels in the level2.evt file, extra rows are filled as -1
| Pixel properties | Quadrant properties | ||||||
|---|---|---|---|---|---|---|---|
| Quadrant | DetID | PixID | Counts | Sigma | Mean | Median | Sigma |
| A | 7 | 16 | 64684 | 140.82 | 2151 | 2099 | 444.4 |
| A | 0 | 50 | 37873 | 80.5 | 2151 | 2099 | 444.4 |
| A | 12 | 194 | 20876 | 42.25 | 2151 | 2099 | 444.4 |
| B | 15 | 204 | 551067 | 1317.68 | 2165 | 2110 | 416.6 |
| B | 4 | 48 | 63410 | 147.14 | 2165 | 2110 | 416.6 |
| B | 10 | 246 | 58677 | 135.78 | 2165 | 2110 | 416.6 |
| C | 1 | 16 | 530936 | 1089.17 | 2094 | 2103 | 485.5 |
| C | 9 | 16 | 228175 | 465.61 | 2094 | 2103 | 485.5 |
| C | 1 | 241 | 18005 | 32.75 | 2094 | 2103 | 485.5 |
| D | 11 | 192 | 733929 | 1446.03 | 2060 | 1992 | 506.2 |
| D | 2 | 152 | 255256 | 500.35 | 2060 | 1992 | 506.2 |
| D | 12 | 233 | 180184 | 352.04 | 2060 | 1992 | 506.2 |
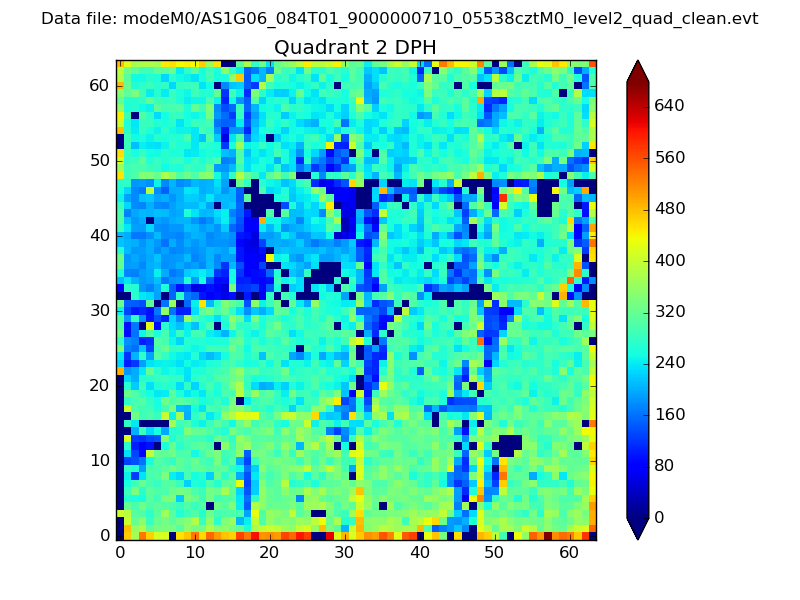
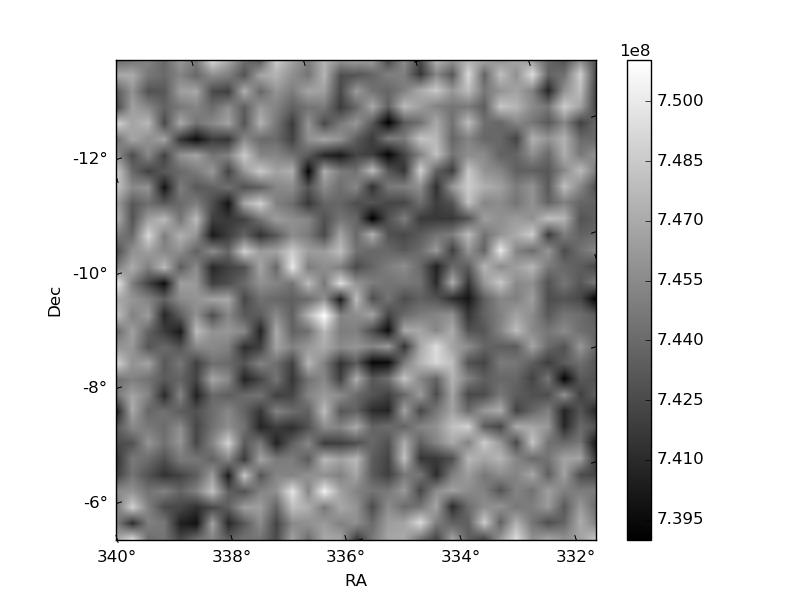
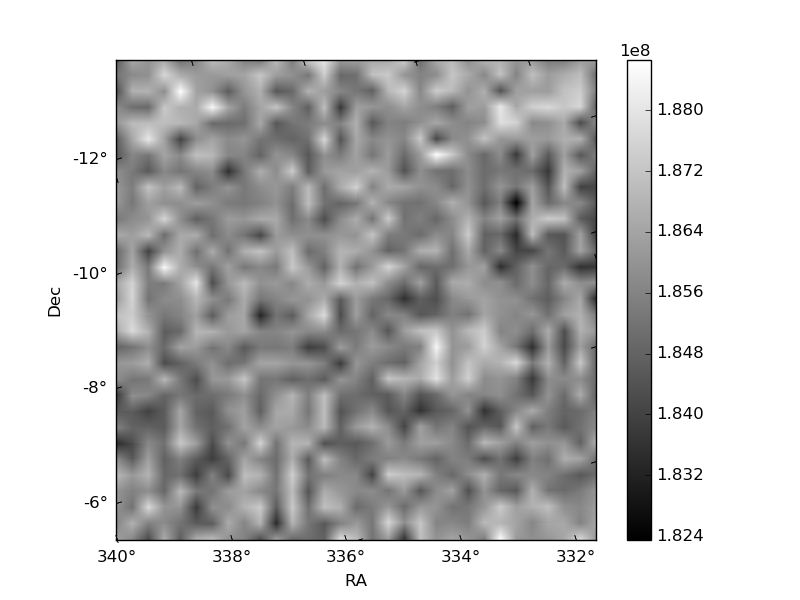
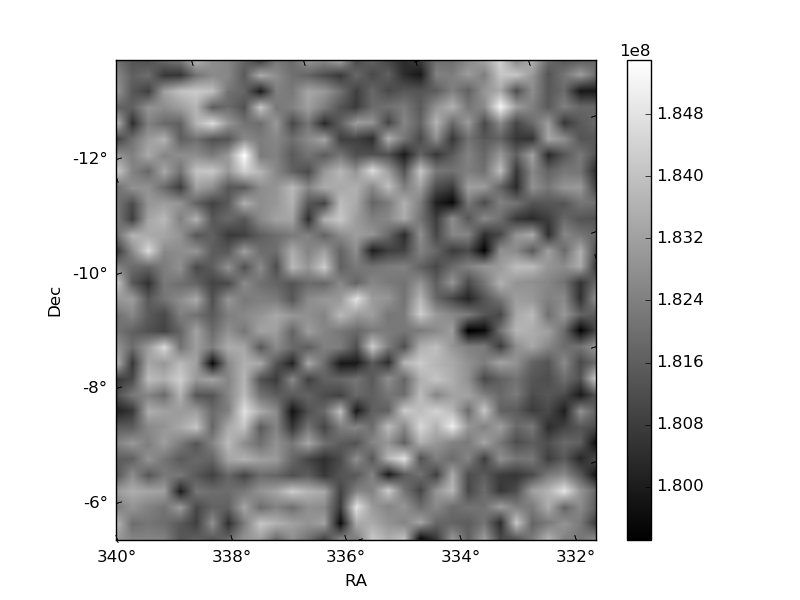
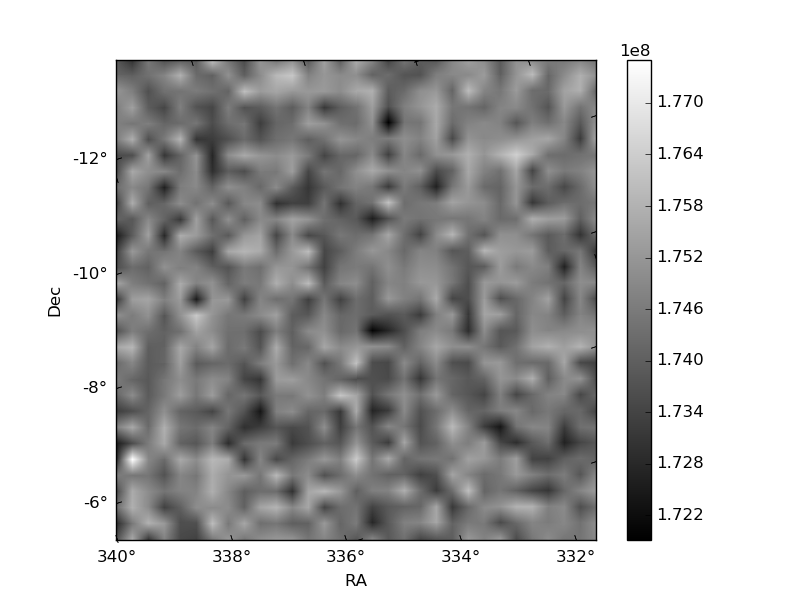
Histogram calculated using DETX and DETY for each event in the final _common_clean file
| Quadrant A |  |
 |
Quadrant B |
|---|---|---|---|
| Quadrant D | 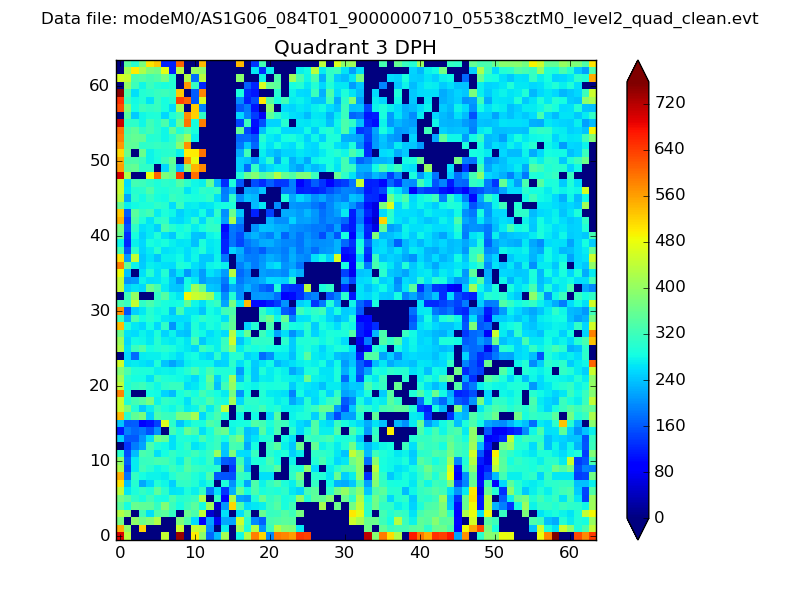 |
 |
Quadrant C |
| Plot type | Count rate plots | Images |
|---|---|---|
| Comparison with Poisson distribution Blue bars denote a histogram of data divided into 1 sec bins. Red curve is a Poisson curve with rate = median count rate of data. |
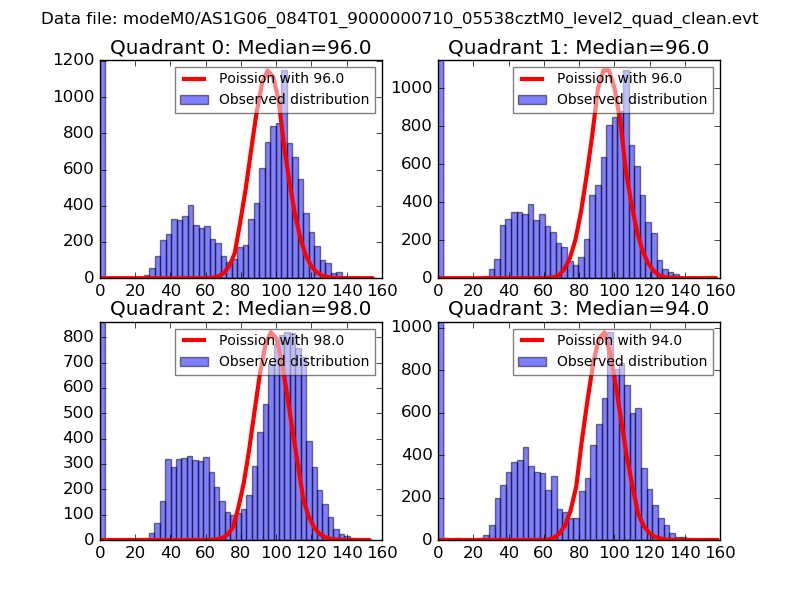 |
 |
| Quadrant-wise count rates Data is divided into 100 sec bins |
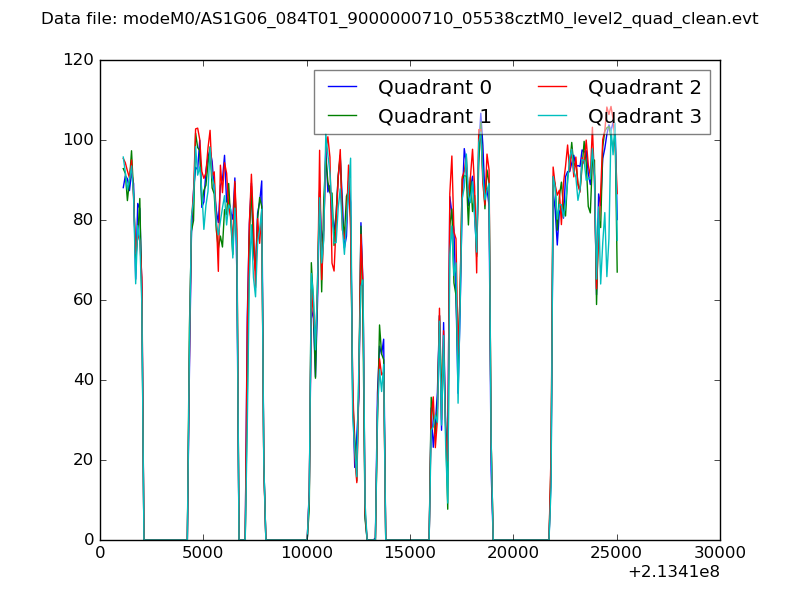 |
|
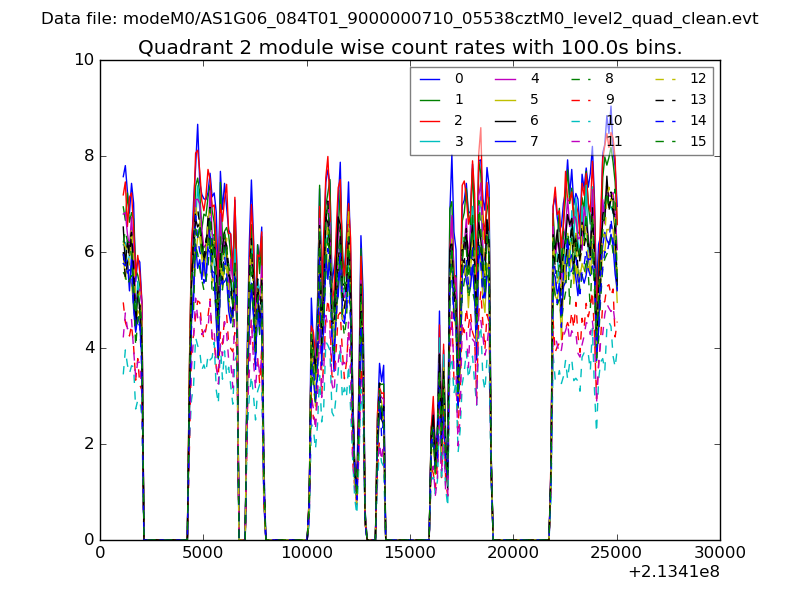
| Module-wise count rates for Quadrant A Data is divided into 100 sec bins |
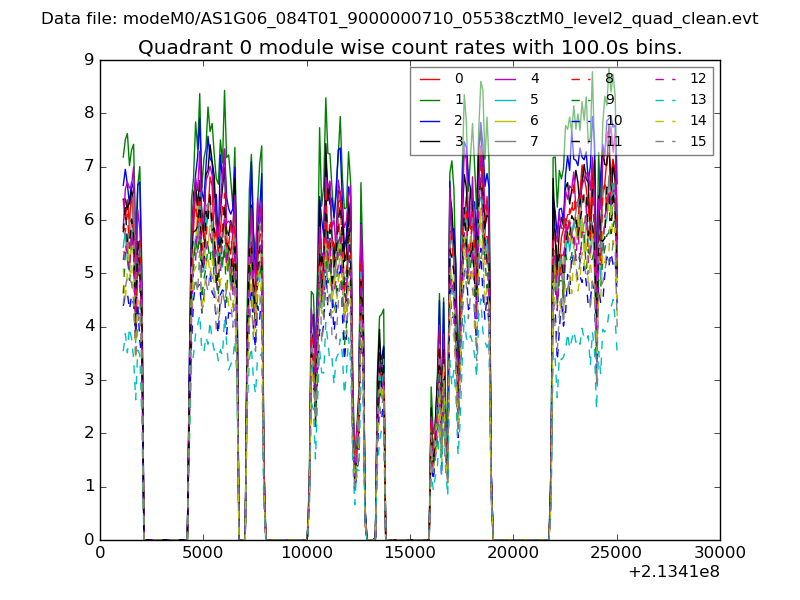 |
 |
| Module-wise count rates for Quadrant B Data is divided into 100 sec bins |
 |
 |
| Module-wise count rates for Quadrant C Data is divided into 100 sec bins |
 |
 |
| Module-wise count rates for Quadrant D Data is divided into 100 sec bins |
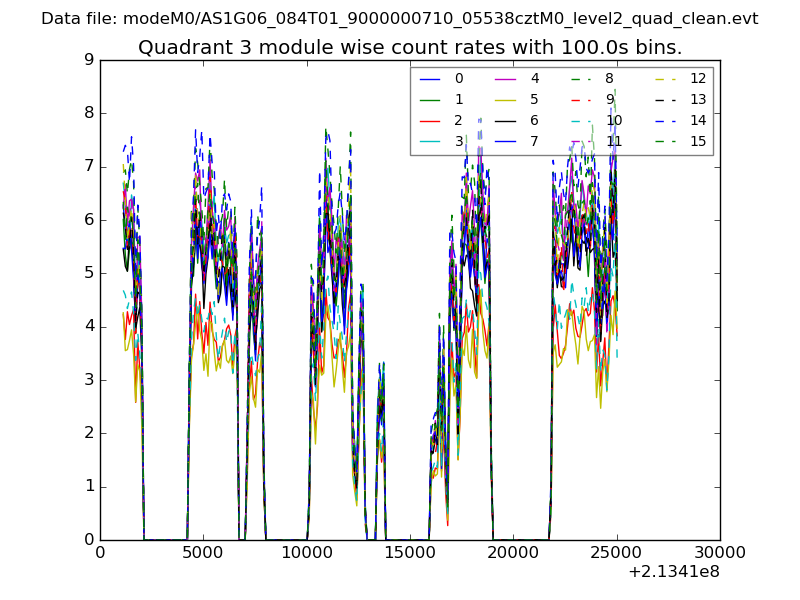 |
 |
| Parameter | Plot |
|---|---|
| CZT HV Monitor |  |
| D_VDD | 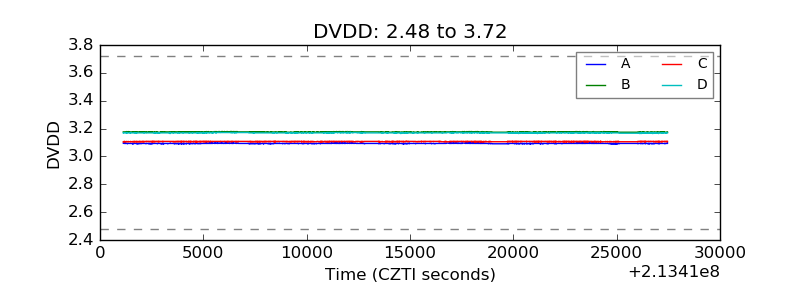 |
| Temperature 1 | 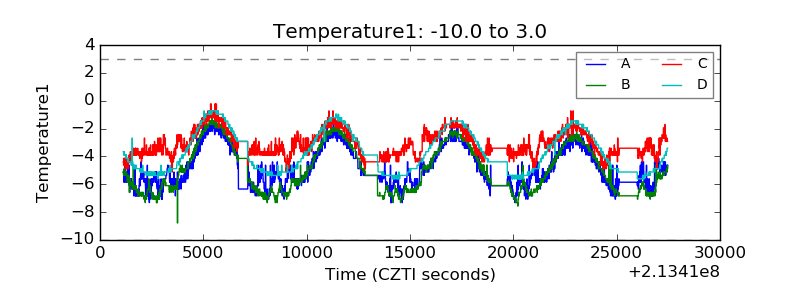 |
| Veto HV Monitor | 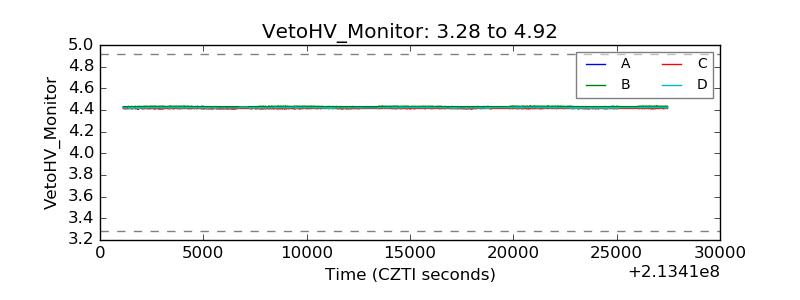 |
| Veto LLD | 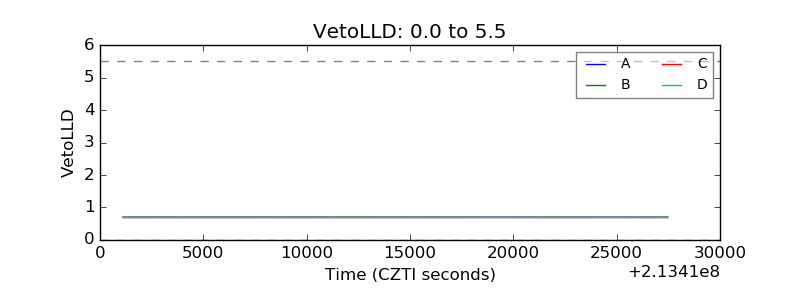 |
| Alpha Counter | 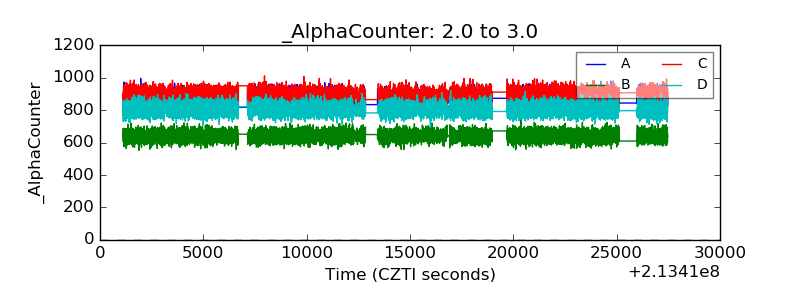 |
| _CPM_Rate | 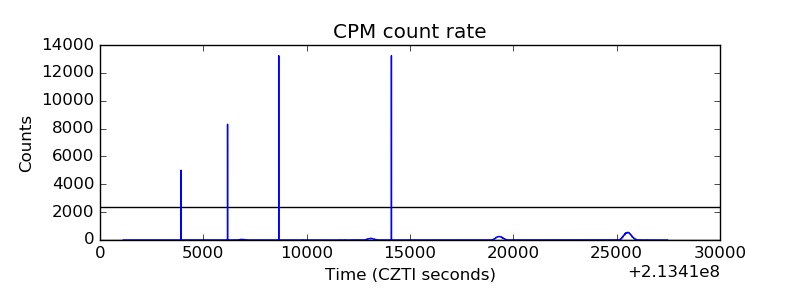 |
| CZT Counter |  |
| +2.5 Volts monitor |  |
| +5 Volts monitor |  |
| _ROLL_ROT | 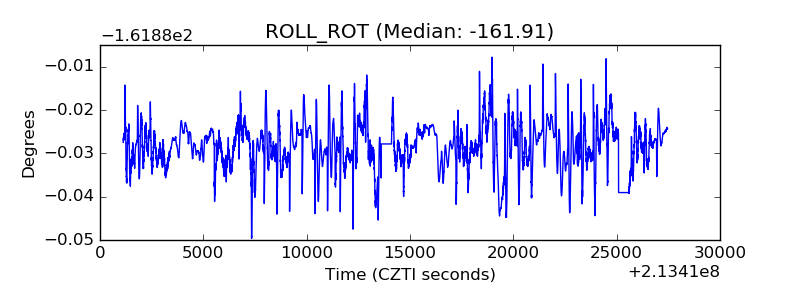 |
| _Roll_DEC | 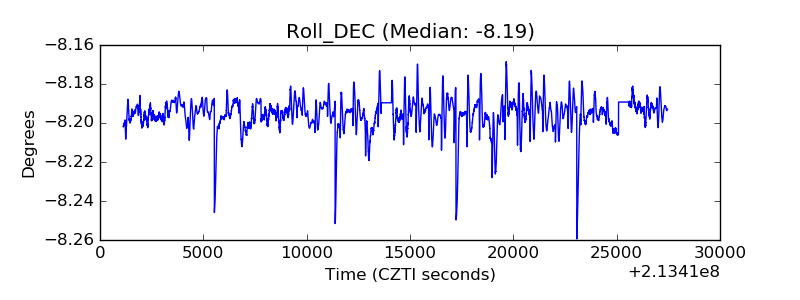 |
| _Roll_RA | 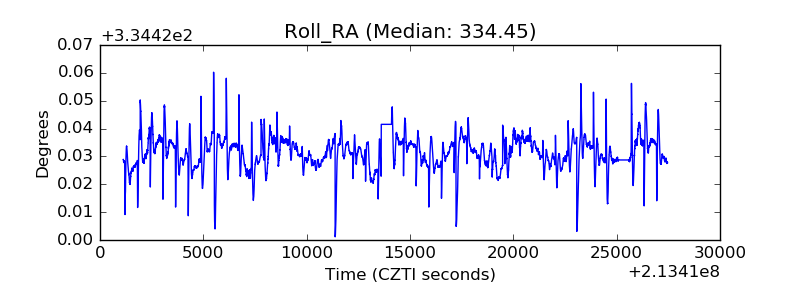 |
| Veto Counter | 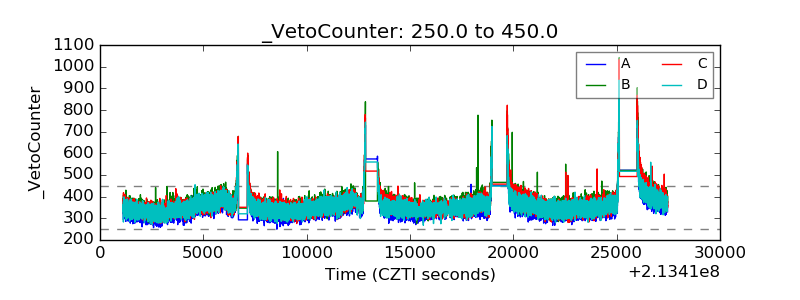 |