| Param | Original file | Final file |
|---|---|---|
| Filename | modeM0/AS1G06_084T01_9000000710_05541cztM0_level2.evt | modeM0/AS1G06_084T01_9000000710_05541cztM0_level2_quad_clean.evt |
| Size (bytes) | 513,380,160 | 71,170,560 |
| Size | 489.6 MB | 67.9 MB |
| Events in quadrant A | 3,168,958 | 437,809 |
| Events in quadrant B | 3,468,486 | 442,203 |
| Events in quadrant C | 4,881,755 | 387,742 |
| Events in quadrant D | 3,582,734 | 429,232 |
| Mode M0 | |||
|---|---|---|---|
| Quadrant | BADHDUFLAG | Total packets | Discarded packets |
| A | 0 | 13692 | 16 |
| B | 0 | 14417 | 19 |
| C | 0 | 18724 | 8 |
| D | 0 | 14986 | 26 |
| Mode M9 | |||
|---|---|---|---|
| Quadrant | BADHDUFLAG | Total packets | Discarded packets |
| A | 0 | 22 | 0 |
| B | 0 | 22 | 0 |
| C | 0 | 22 | 0 |
| D | 0 | 22 | 0 |
| Mode SS | |||
|---|---|---|---|
| Quadrant | BADHDUFLAG | Total packets | Discarded packets |
| A | 0 | 134 | 0 |
| B | 0 | 134 | 0 |
| C | 0 | 134 | 0 |
| D | 0 | 134 | 0 |
| Quadrant | Total seconds | Saturated seconds | Saturation percentage |
|---|---|---|---|
| A | 6566 | 113 | 1.720987% |
| B | 6565 | 121 | 1.843107% |
| C | 6570 | 787 | 11.978691% |
| D | 6563 | 190 | 2.895018% |
Noise dominated data is calculated using 1-second bins in cleaned event files. If a bin has >2000 counts, and if more than 50% of those come from <1% of pixels, then it is considered to be noise-dominated and hence unusable.
| Quadrant | # 1 sec bins | Bins with >0 counts | Bins with >2000 counts | High rate bins dominated by noise | Noise dominated (total time) | Noise dominated (detector-on time) | Marked lightcurve |
|---|---|---|---|---|---|---|---|
| A | 8718 | 6572 | 0 | 0 | 0.00% | 0.00% | 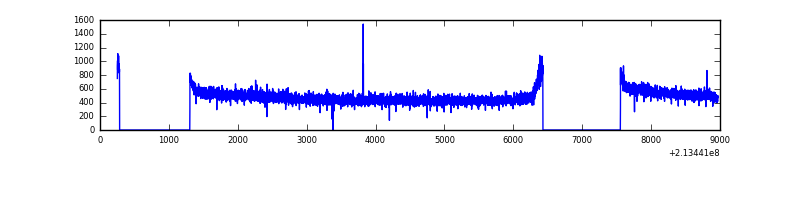 |
| B | 8718 | 6574 | 8 | 8 | 0.09% | 0.12% | 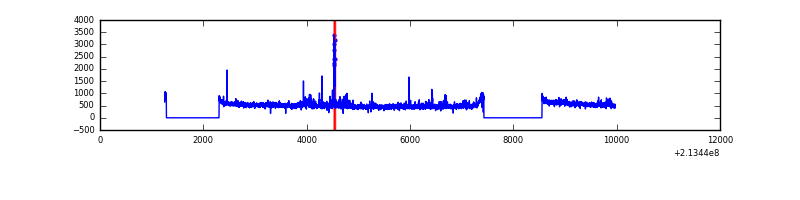 |
| C | 8718 | 6573 | 677 | 677 | 7.77% | 10.30% | 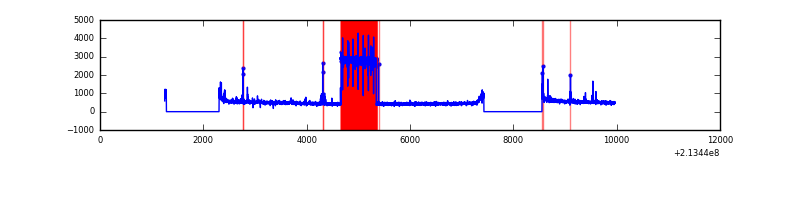 |
| D | 8718 | 6574 | 66 | 66 | 0.76% | 1.00% | 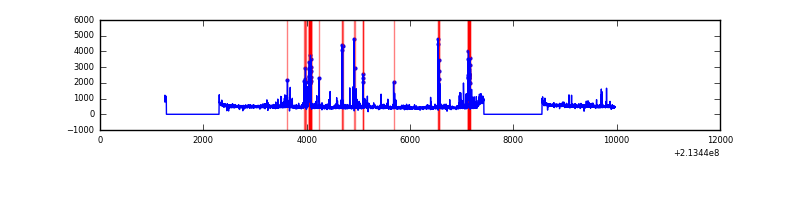 |
Top three noisy pixels from each quadrant. If the there are fewer than three noisy pixels in the level2.evt file, extra rows are filled as -1
| Pixel properties | Quadrant properties | ||||||
|---|---|---|---|---|---|---|---|
| Quadrant | DetID | PixID | Counts | Sigma | Mean | Median | Sigma |
| A | 12 | 194 | 8034 | 43.07 | 822 | 804 | 167.9 |
| A | 0 | 226 | 7862 | 42.05 | 822 | 804 | 167.9 |
| A | 0 | 50 | 2883 | 12.38 | 822 | 804 | 167.9 |
| B | 15 | 204 | 167849 | 1058.6 | 826 | 808 | 157.8 |
| B | 4 | 81 | 23337 | 142.77 | 826 | 808 | 157.8 |
| B | 4 | 48 | 23169 | 141.71 | 826 | 808 | 157.8 |
| C | 1 | 241 | 1894795 | 10997.12 | 744 | 747 | 172.2 |
| C | 9 | 16 | 42764 | 243.96 | 744 | 747 | 172.2 |
| C | 1 | 16 | 30620 | 173.45 | 744 | 747 | 172.2 |
| D | 2 | 136 | 176147 | 900.83 | 797 | 772 | 194.7 |
| D | 2 | 33 | 164959 | 843.36 | 797 | 772 | 194.7 |
| D | 2 | 152 | 112959 | 576.26 | 797 | 772 | 194.7 |
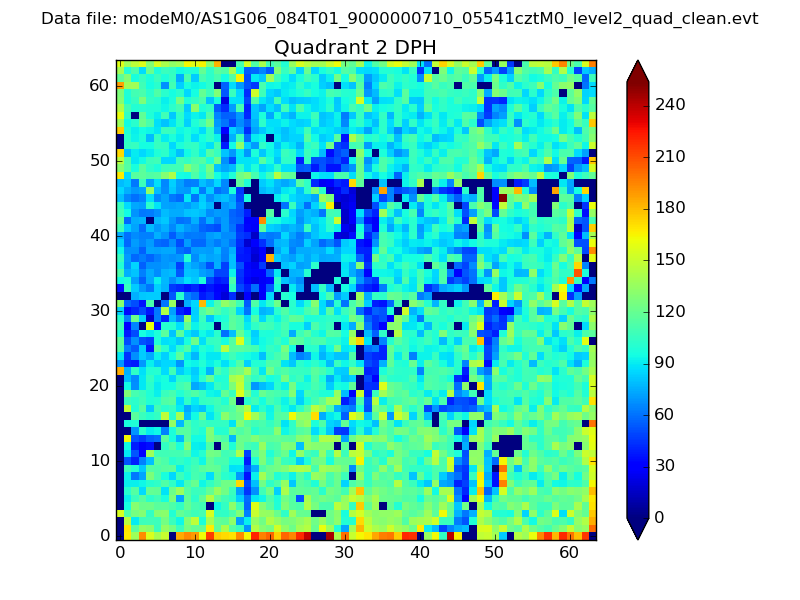
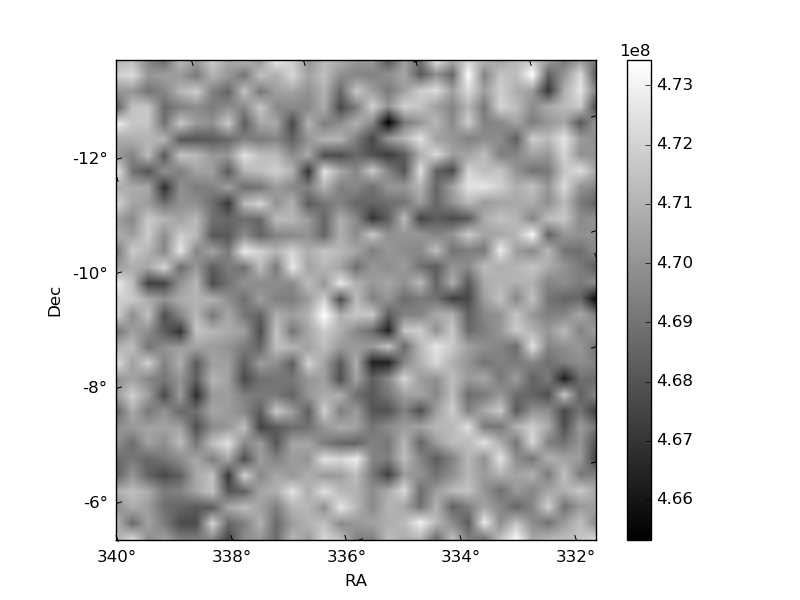
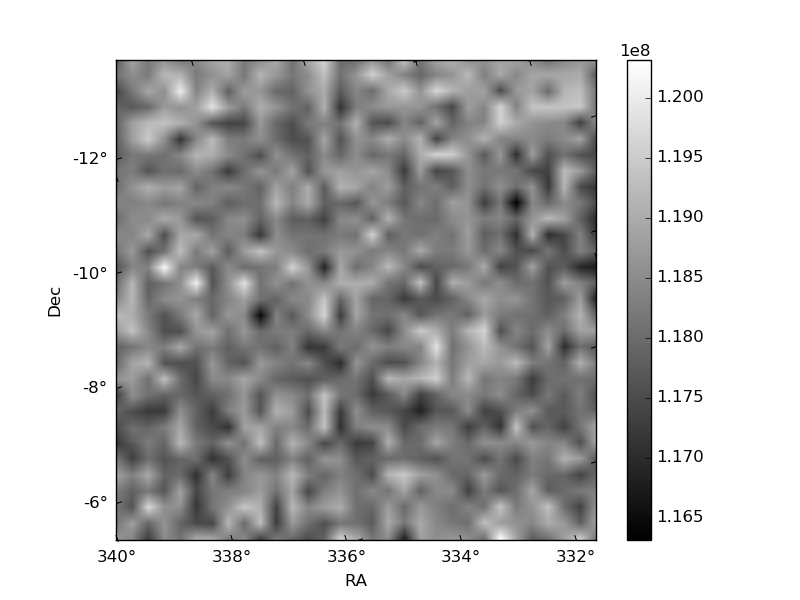
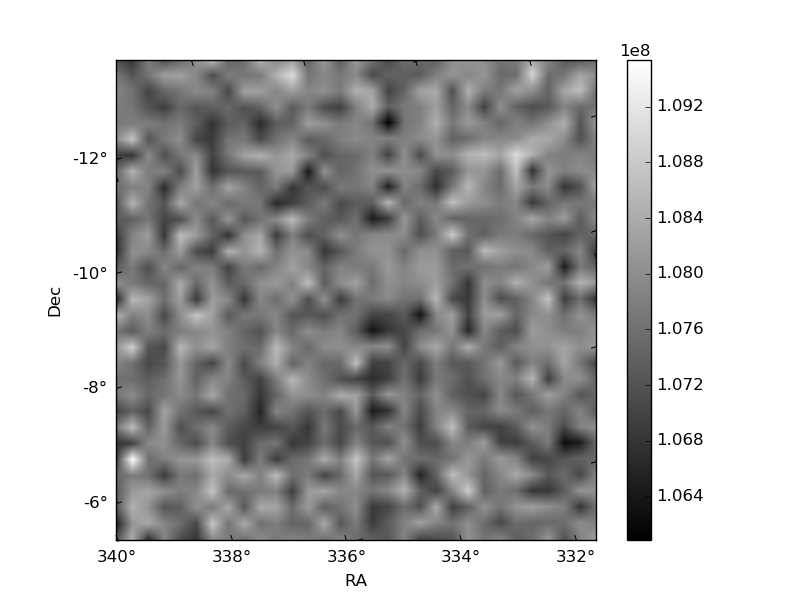
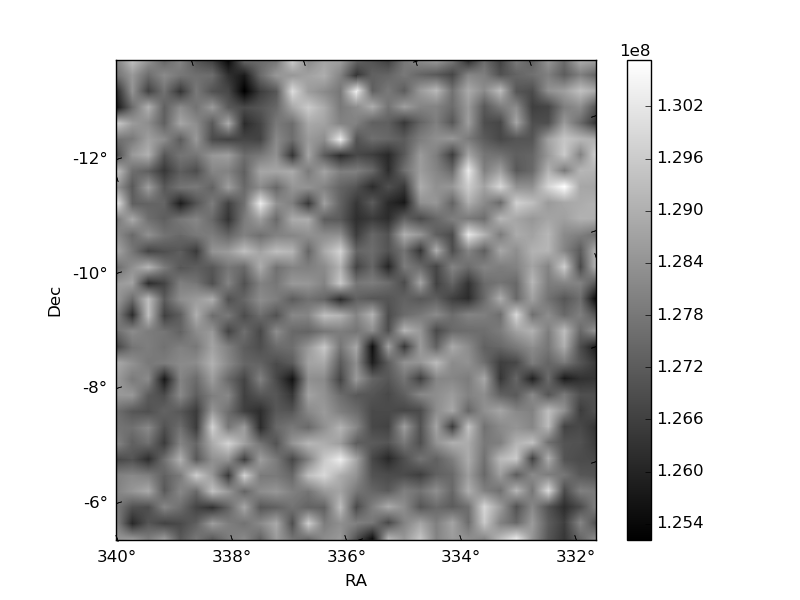
Histogram calculated using DETX and DETY for each event in the final _common_clean file
| Quadrant A | 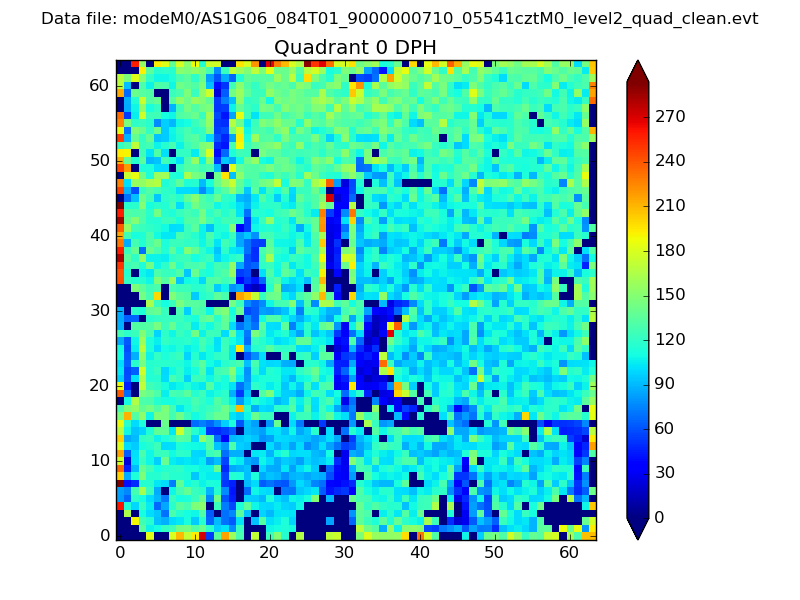 |
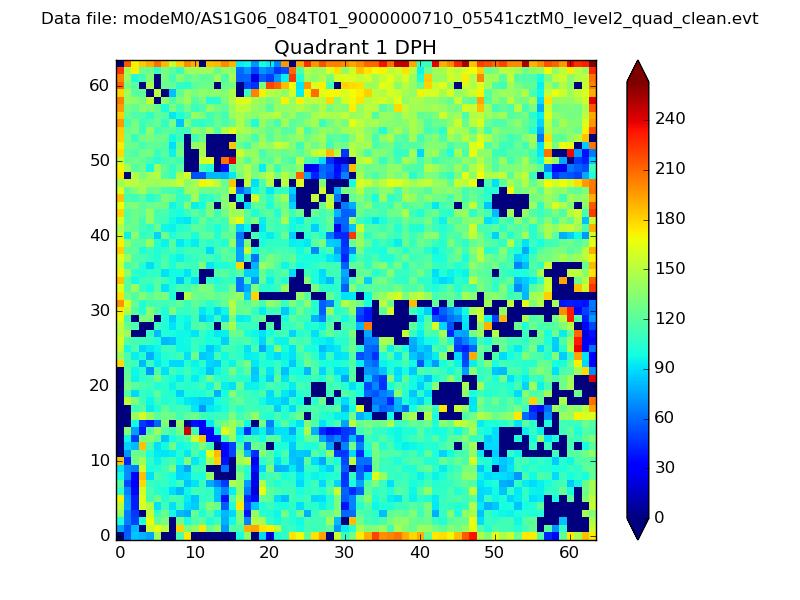 |
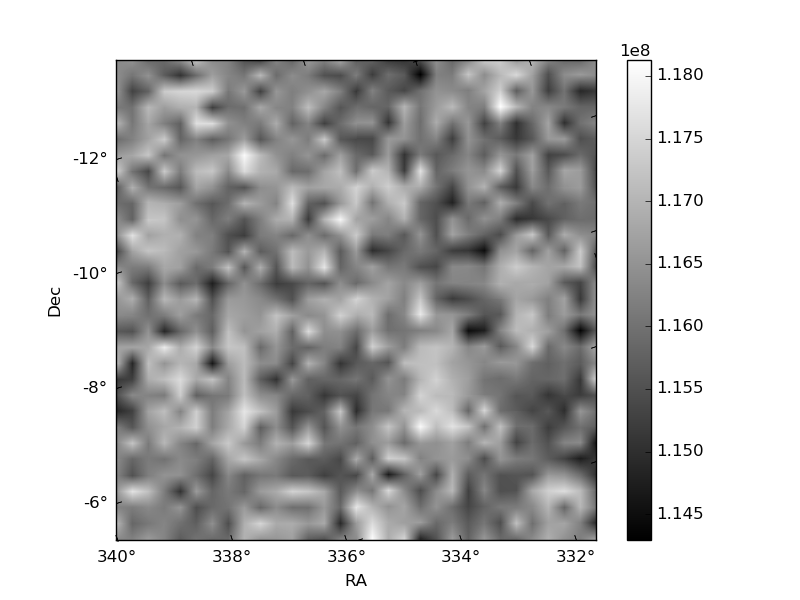
Quadrant B |
|---|---|---|---|
| Quadrant D | 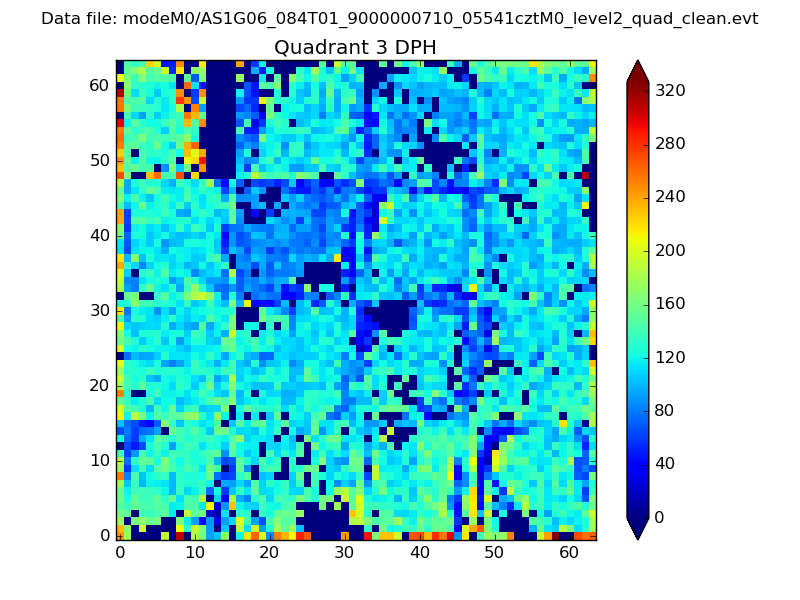 |
 |
Quadrant C |
| Plot type | Count rate plots | Images |
|---|---|---|
| Comparison with Poisson distribution Blue bars denote a histogram of data divided into 1 sec bins. Red curve is a Poisson curve with rate = median count rate of data. |
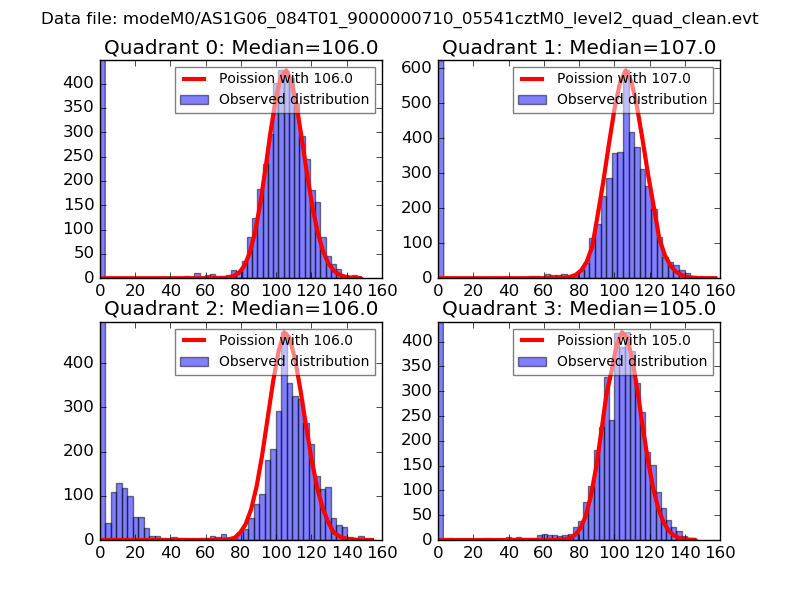 |
 |
| Quadrant-wise count rates Data is divided into 100 sec bins |
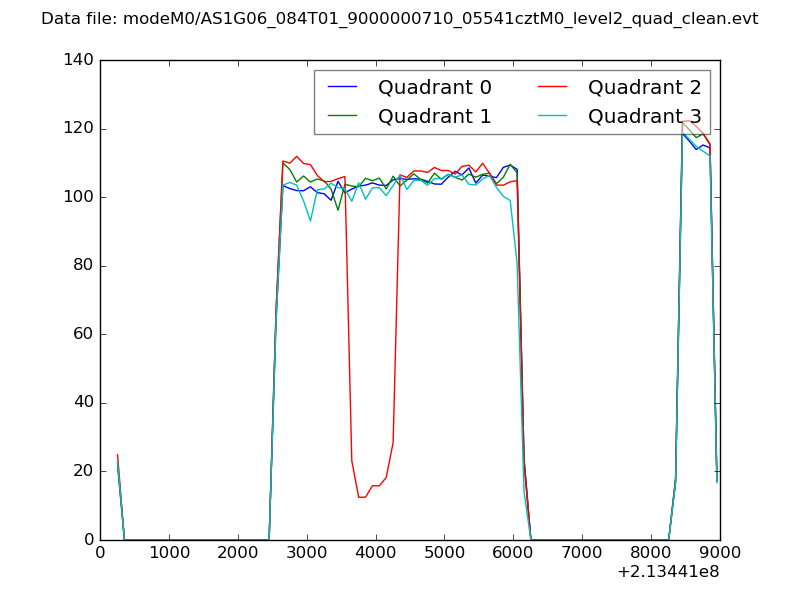 |
|
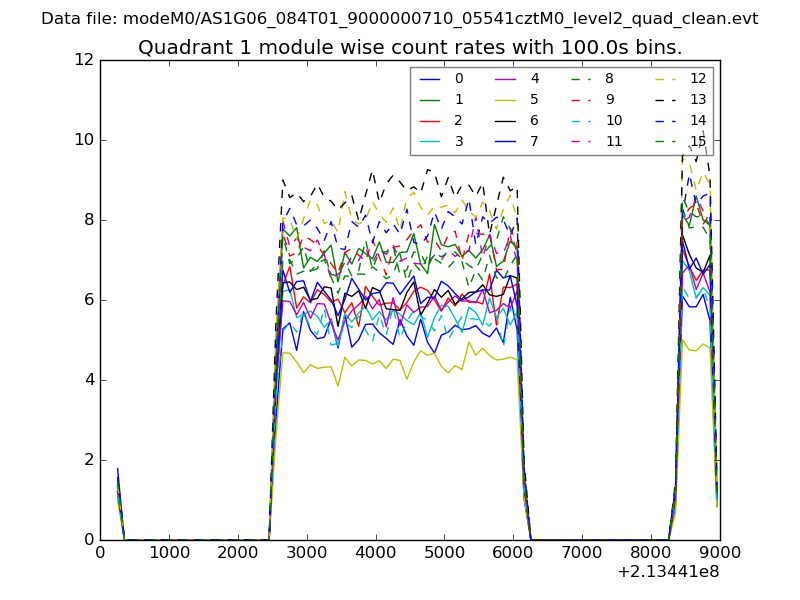
| Module-wise count rates for Quadrant A Data is divided into 100 sec bins |
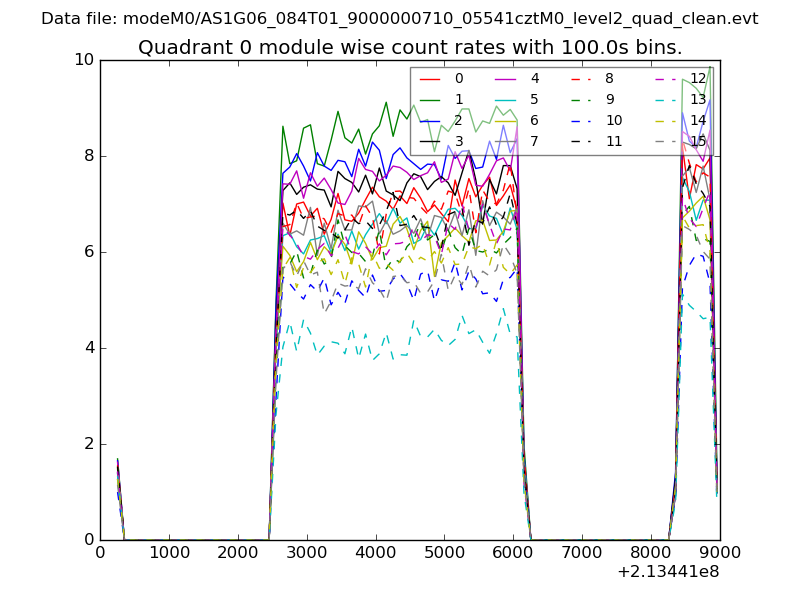 |
 |
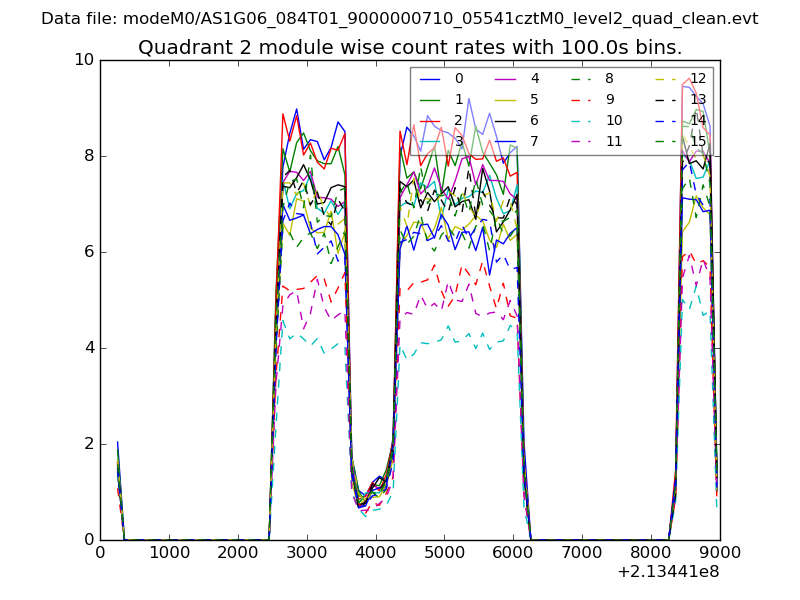
| Module-wise count rates for Quadrant B Data is divided into 100 sec bins |
 |
 |
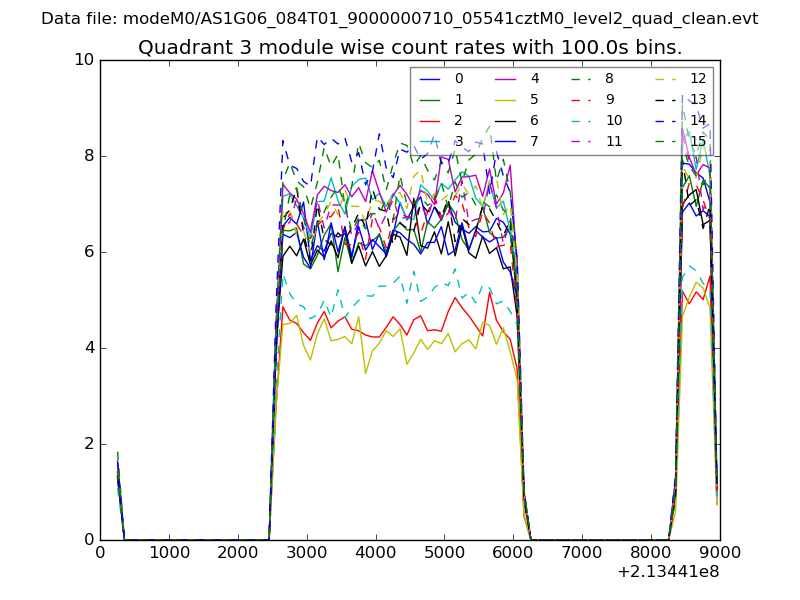
| Module-wise count rates for Quadrant C Data is divided into 100 sec bins |
 |
 |
| Module-wise count rates for Quadrant D Data is divided into 100 sec bins |
 |
 |
| Parameter | Plot |
|---|---|
| CZT HV Monitor | 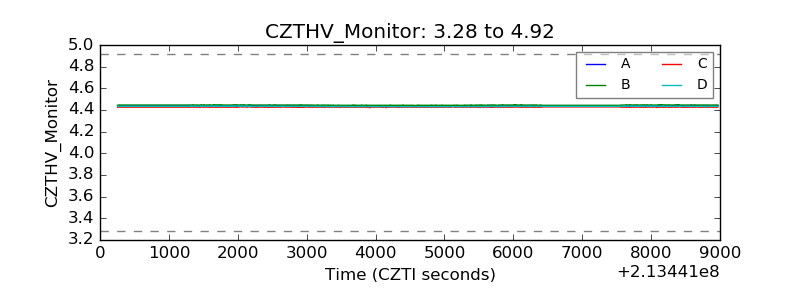 |
| D_VDD | 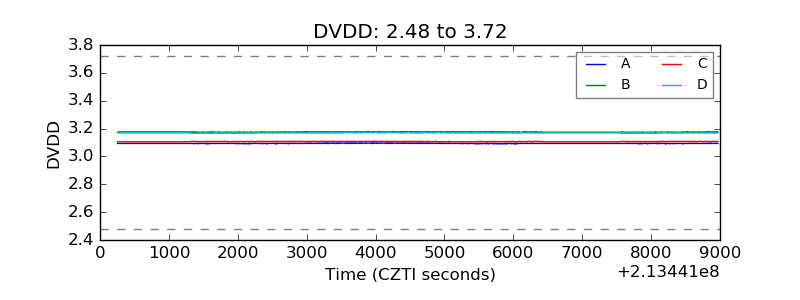 |
| Temperature 1 | 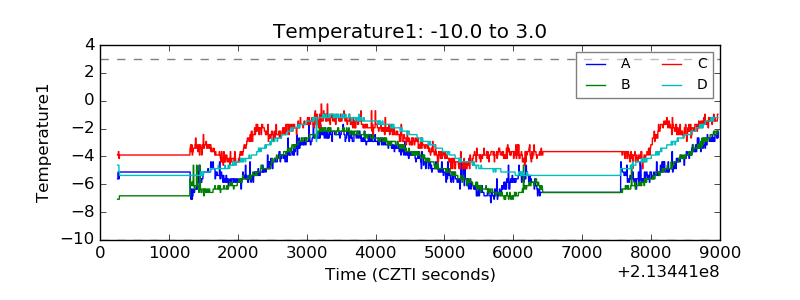 |
| Veto HV Monitor | 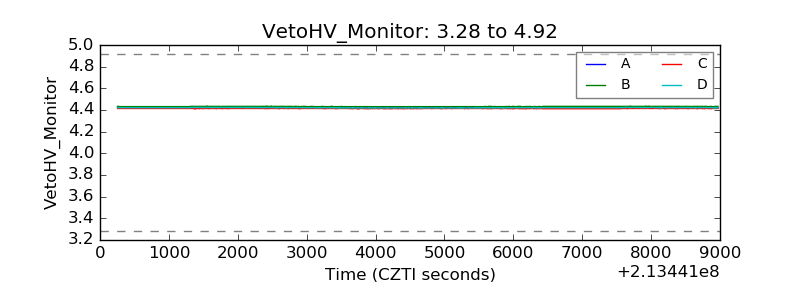 |
| Veto LLD | 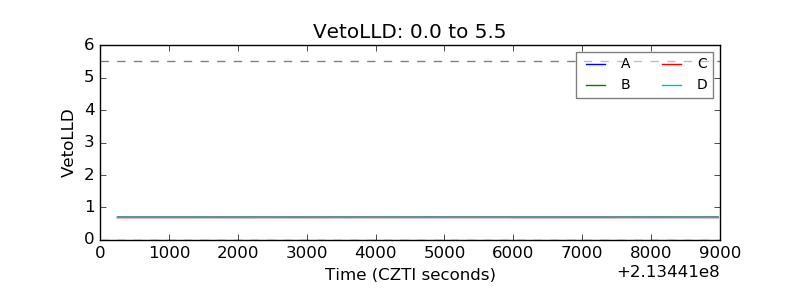 |
| Alpha Counter | 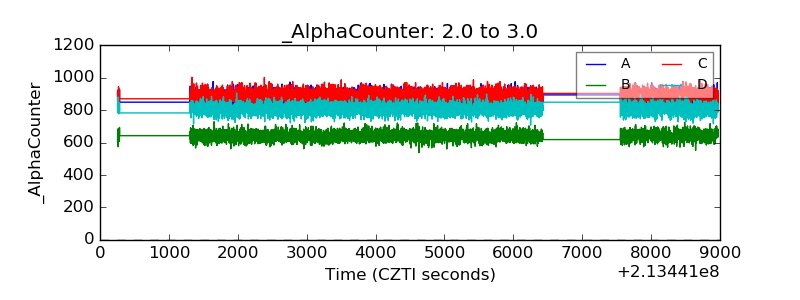 |
| _CPM_Rate | 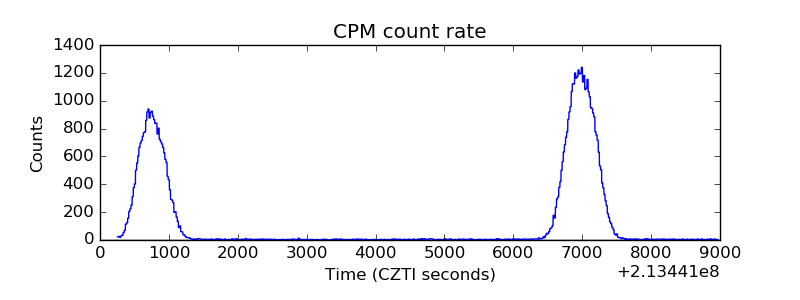 |
| CZT Counter | 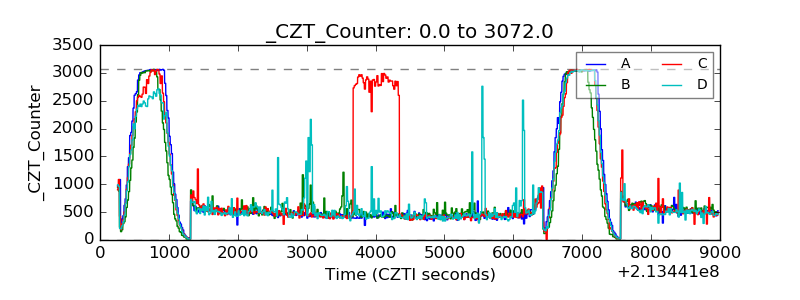 |
| +2.5 Volts monitor |  |
| +5 Volts monitor |  |
| _ROLL_ROT | 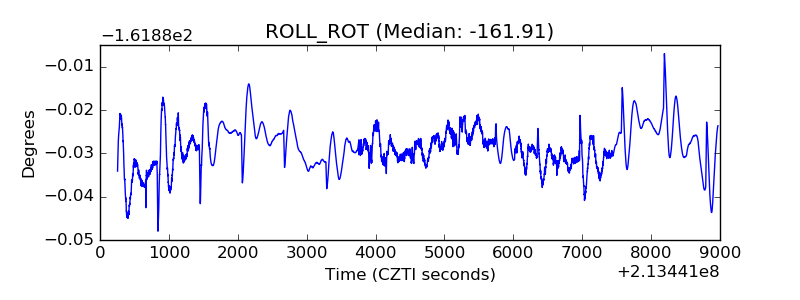 |
| _Roll_DEC | 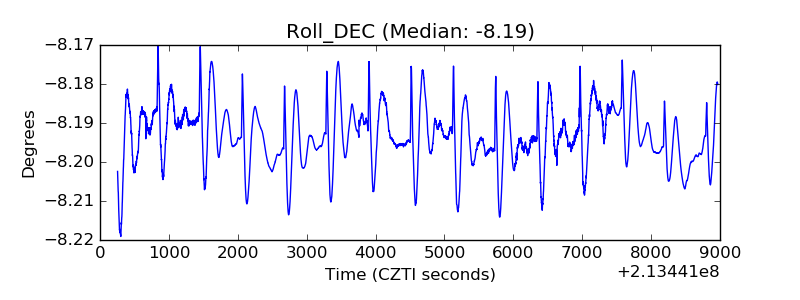 |
| _Roll_RA | 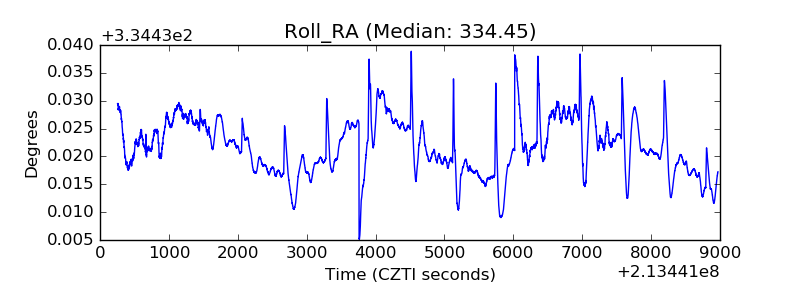 |
| Veto Counter | 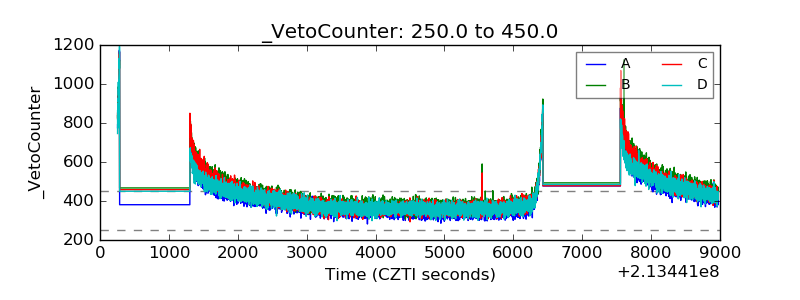 |