| Param | Original file | Final file |
|---|---|---|
| Filename | modeM0/AS1G06_084T01_9000000710_05542cztM0_level2.evt | modeM0/AS1G06_084T01_9000000710_05542cztM0_level2_quad_clean.evt |
| Size (bytes) | 432,319,680 | 81,198,720 |
| Size | 412.3 MB | 77.4 MB |
| Events in quadrant A | 2,938,524 | 508,836 |
| Events in quadrant B | 3,294,722 | 513,523 |
| Events in quadrant C | 2,968,477 | 516,827 |
| Events in quadrant D | 3,480,496 | 497,788 |
| Mode M0 | |||
|---|---|---|---|
| Quadrant | BADHDUFLAG | Total packets | Discarded packets |
| A | 0 | 12596 | 23 |
| B | 0 | 13572 | 9 |
| C | 0 | 12674 | 22 |
| D | 0 | 14220 | 17 |
| Mode M9 | |||
|---|---|---|---|
| Quadrant | BADHDUFLAG | Total packets | Discarded packets |
| A | 0 | 12 | 0 |
| B | 0 | 12 | 0 |
| C | 0 | 12 | 0 |
| D | 0 | 12 | 0 |
| Mode SS | |||
|---|---|---|---|
| Quadrant | BADHDUFLAG | Total packets | Discarded packets |
| A | 0 | 124 | 0 |
| B | 0 | 124 | 0 |
| C | 0 | 124 | 2 |
| D | 0 | 124 | 0 |
| Quadrant | Total seconds | Saturated seconds | Saturation percentage |
|---|---|---|---|
| A | 6037 | 77 | 1.275468% |
| B | 6043 | 90 | 1.489326% |
| C | 6037 | 52 | 0.861355% |
| D | 6042 | 132 | 2.184707% |
Noise dominated data is calculated using 1-second bins in cleaned event files. If a bin has >2000 counts, and if more than 50% of those come from <1% of pixels, then it is considered to be noise-dominated and hence unusable.
| Quadrant | # 1 sec bins | Bins with >0 counts | Bins with >2000 counts | High rate bins dominated by noise | Noise dominated (total time) | Noise dominated (detector-on time) | Marked lightcurve |
|---|---|---|---|---|---|---|---|
| A | 7257 | 6048 | 0 | 0 | 0.00% | 0.00% | 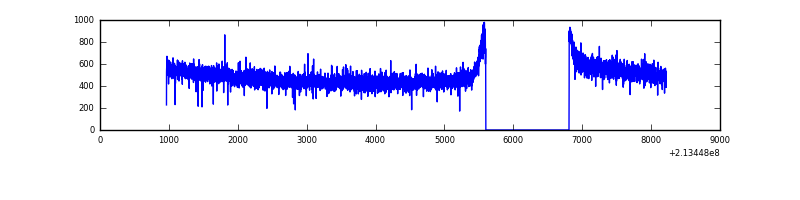 |
| B | 7257 | 6048 | 8 | 8 | 0.11% | 0.13% | 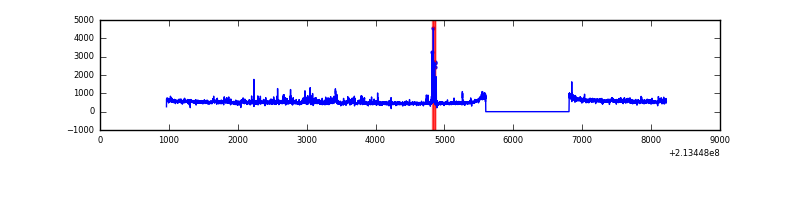 |
| C | 7257 | 6048 | 1 | 1 | 0.01% | 0.02% | 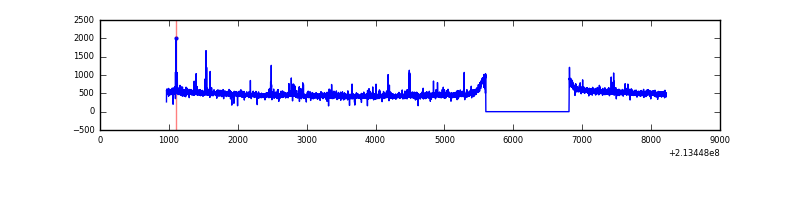 |
| D | 7257 | 6048 | 67 | 67 | 0.92% | 1.11% | 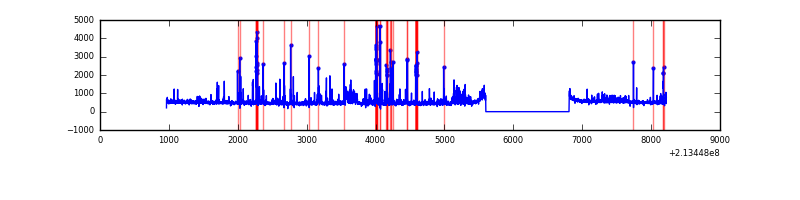 |
Top three noisy pixels from each quadrant. If the there are fewer than three noisy pixels in the level2.evt file, extra rows are filled as -1
| Pixel properties | Quadrant properties | ||||||
|---|---|---|---|---|---|---|---|
| Quadrant | DetID | PixID | Counts | Sigma | Mean | Median | Sigma |
| A | 12 | 194 | 7624 | 44.14 | 763 | 747 | 155.8 |
| A | 0 | 226 | 7512 | 43.42 | 763 | 747 | 155.8 |
| A | 3 | 1 | 2815 | 13.27 | 763 | 747 | 155.8 |
| B | 15 | 204 | 207528 | 1401.51 | 766 | 749 | 147.5 |
| B | 4 | 48 | 57951 | 387.7 | 766 | 749 | 147.5 |
| B | 11 | 51 | 27902 | 184.04 | 766 | 749 | 147.5 |
| C | 9 | 16 | 46579 | 271.07 | 734 | 740 | 169.1 |
| C | 1 | 16 | 38065 | 220.72 | 734 | 740 | 169.1 |
| C | 1 | 241 | 15357 | 86.44 | 734 | 740 | 169.1 |
| D | 2 | 33 | 358466 | 1974.36 | 741 | 717 | 181.2 |
| D | 2 | 152 | 161062 | 884.92 | 741 | 717 | 181.2 |
| D | 2 | 136 | 50549 | 275.01 | 741 | 717 | 181.2 |
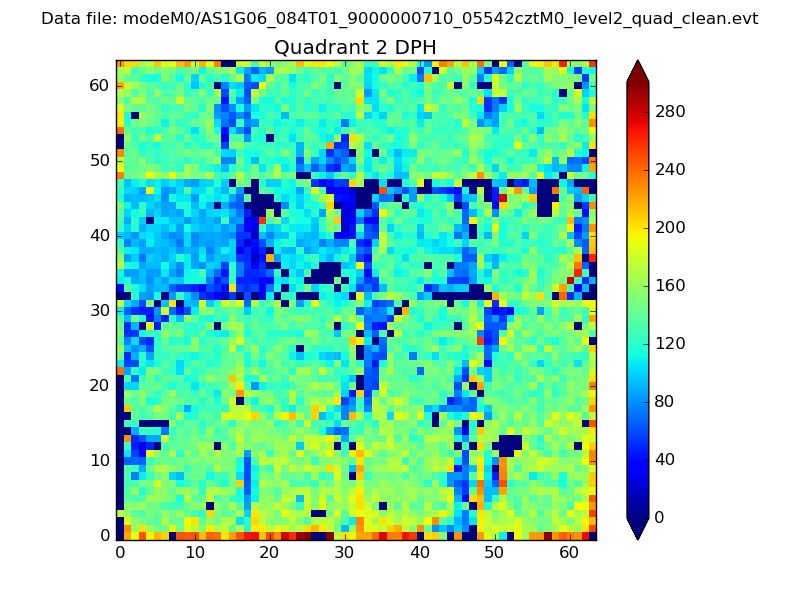
Histogram calculated using DETX and DETY for each event in the final _common_clean file
| Quadrant A | 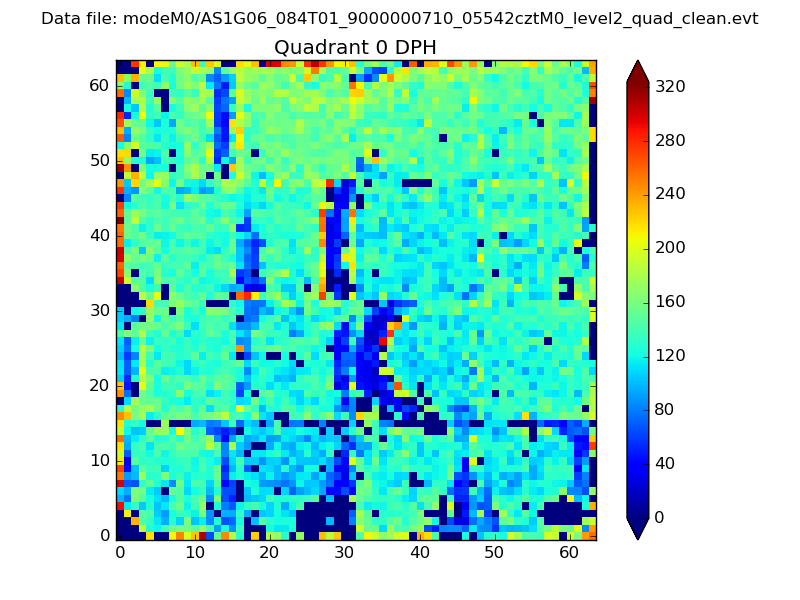 |
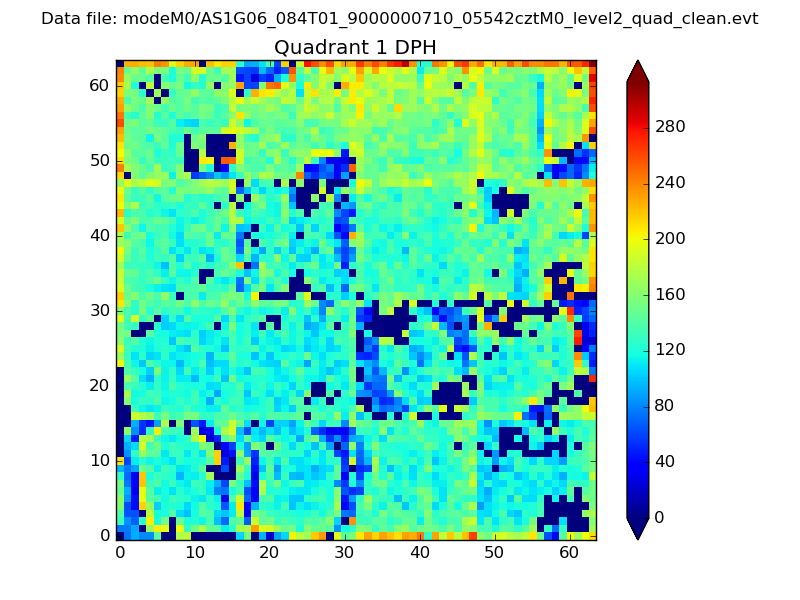 |
Quadrant B |
|---|---|---|---|
| Quadrant D | 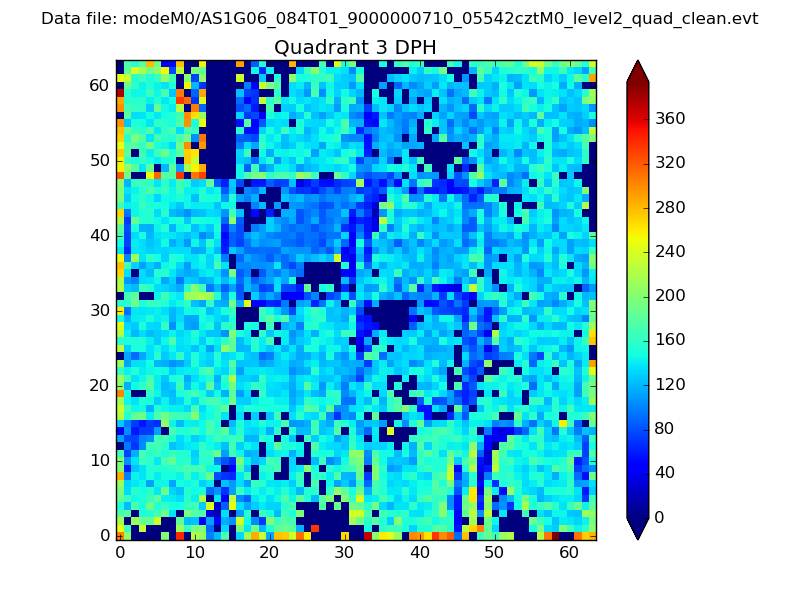 |
 |
Quadrant C |
| Plot type | Count rate plots | Images |
|---|---|---|
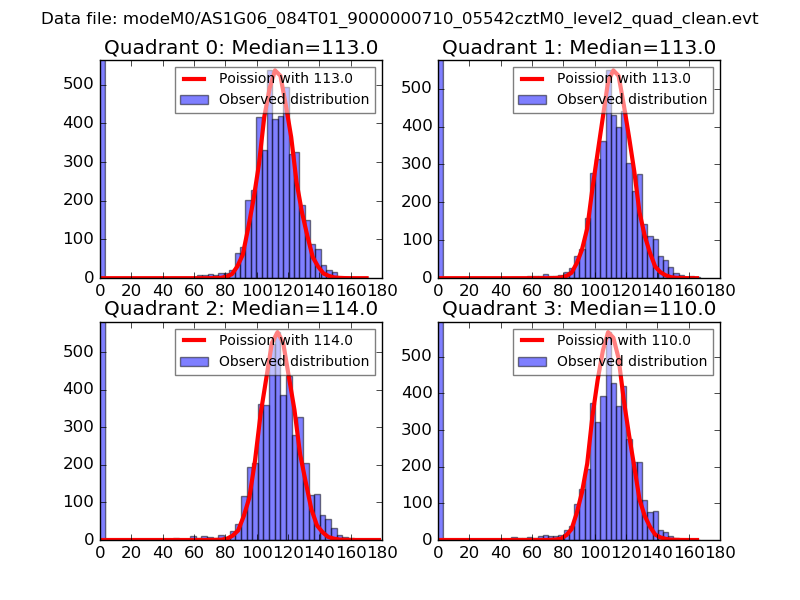
| Comparison with Poisson distribution Blue bars denote a histogram of data divided into 1 sec bins. Red curve is a Poisson curve with rate = median count rate of data. |
 |
 |
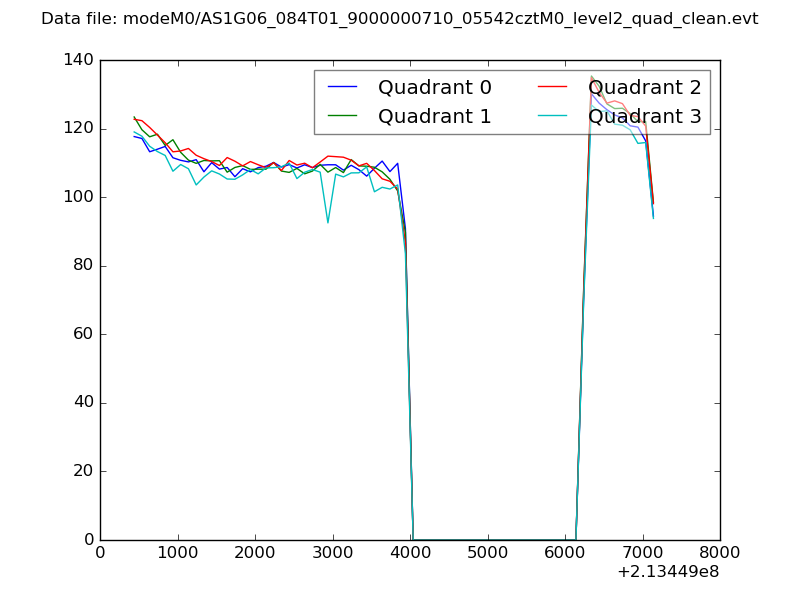
| Quadrant-wise count rates Data is divided into 100 sec bins |
 |
|
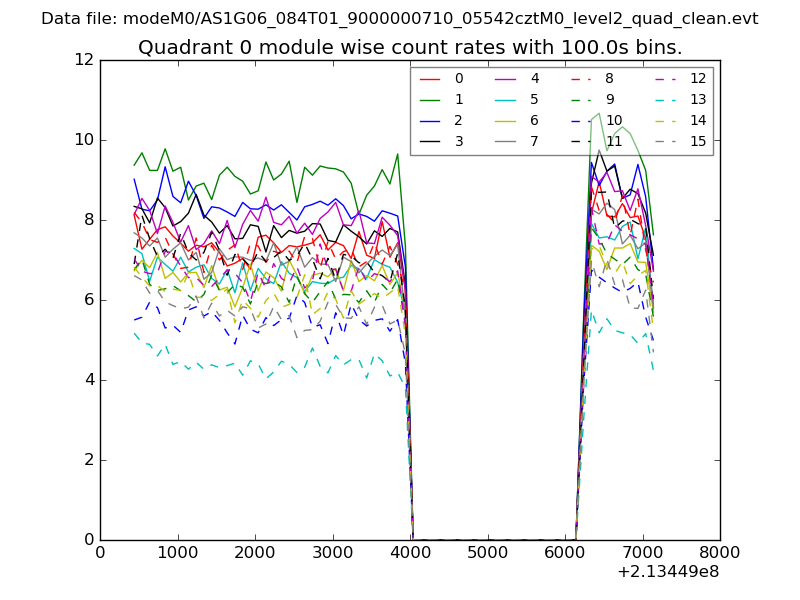
| Module-wise count rates for Quadrant A Data is divided into 100 sec bins |
 |
 |
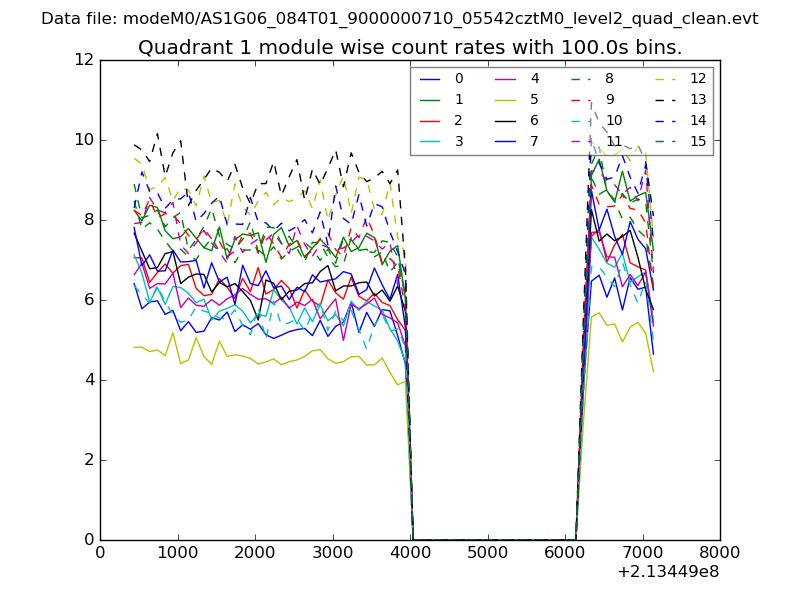
| Module-wise count rates for Quadrant B Data is divided into 100 sec bins |
 |
 |
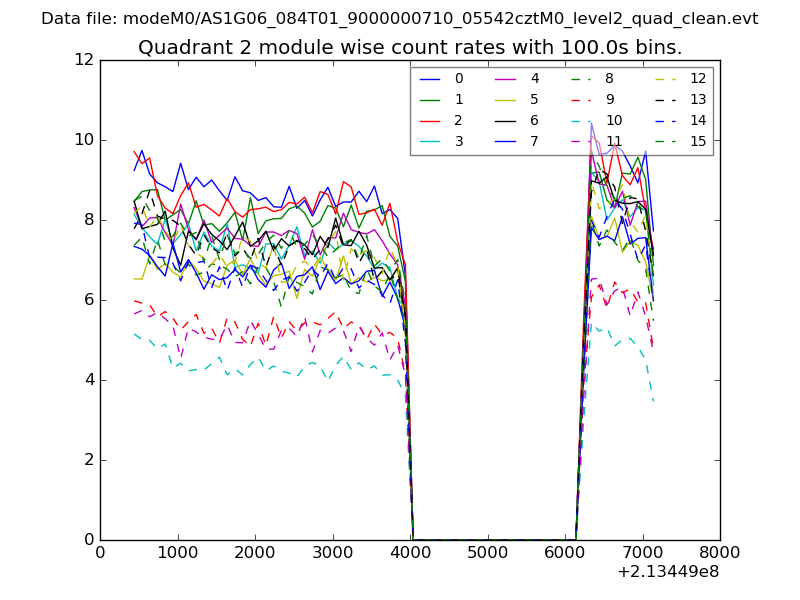
| Module-wise count rates for Quadrant C Data is divided into 100 sec bins |
 |
 |
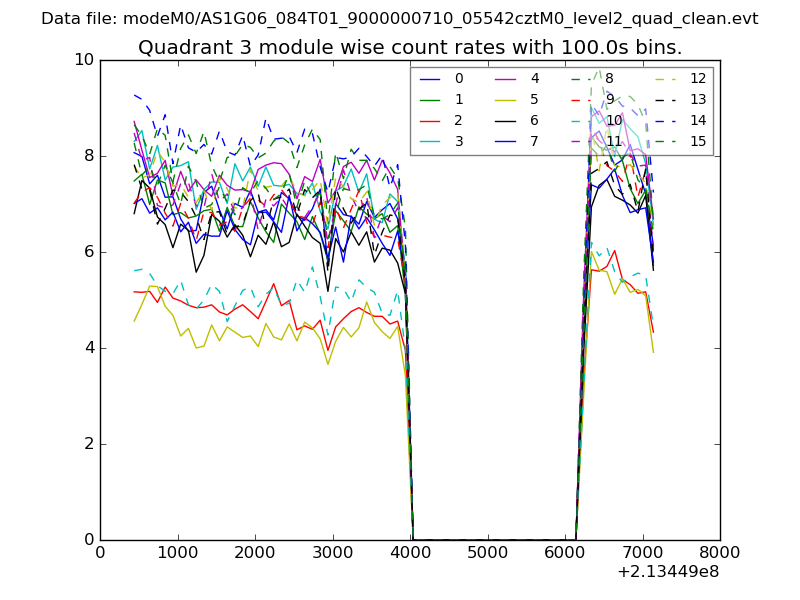
| Module-wise count rates for Quadrant D Data is divided into 100 sec bins |
 |
 |
| Parameter | Plot |
|---|---|
| CZT HV Monitor | 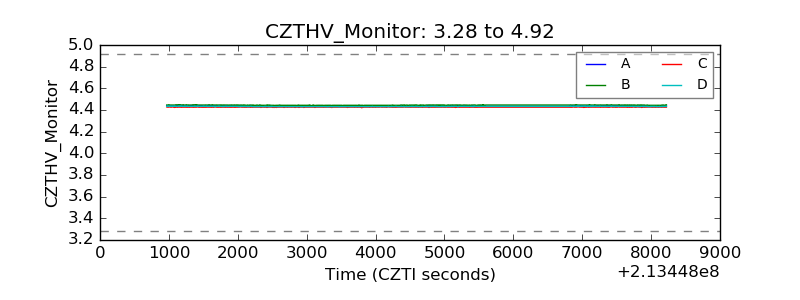 |
| D_VDD | 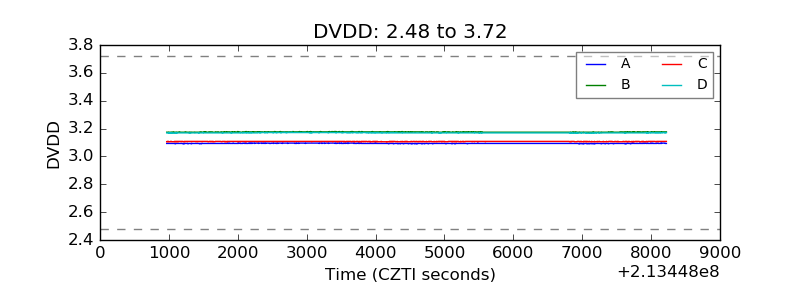 |
| Temperature 1 | 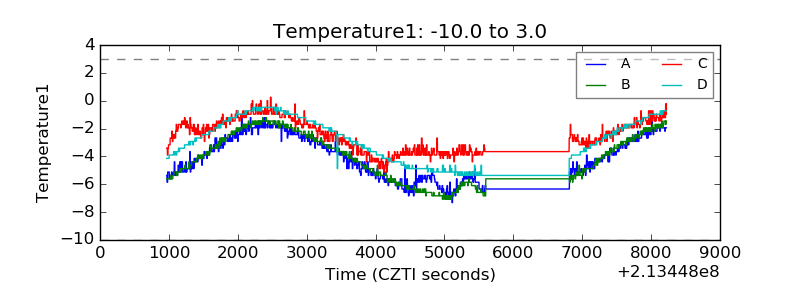 |
| Veto HV Monitor | 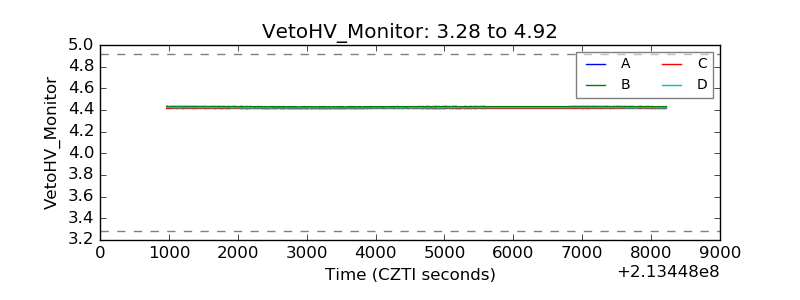 |
| Veto LLD | 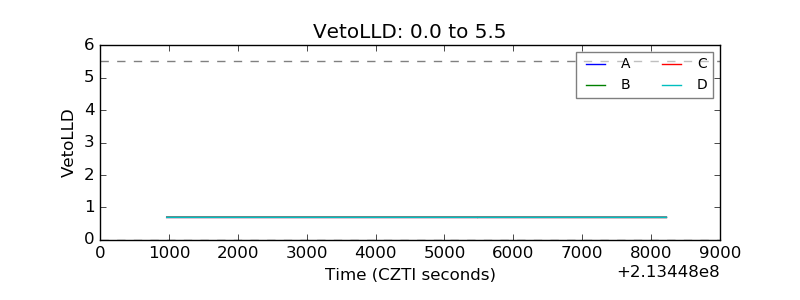 |
| Alpha Counter | 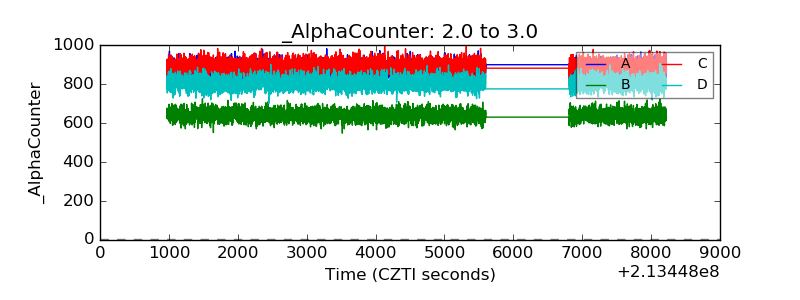 |
| _CPM_Rate | 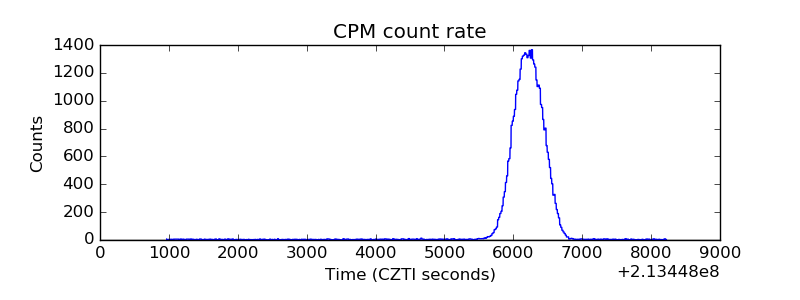 |
| CZT Counter | 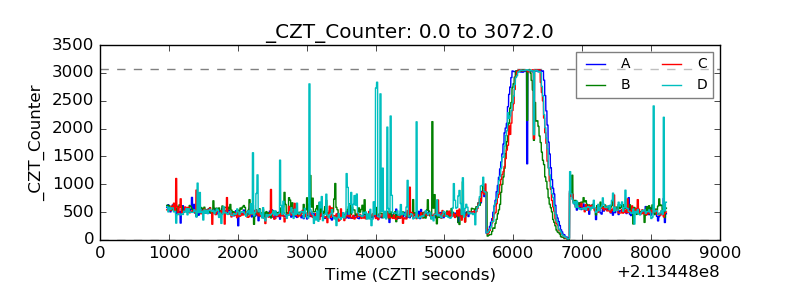 |
| +2.5 Volts monitor | 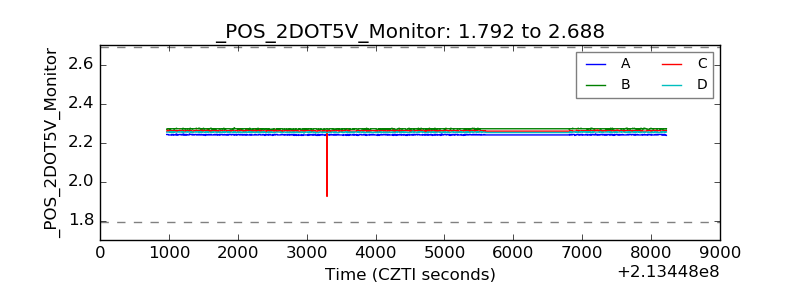 |
| +5 Volts monitor |  |
| _ROLL_ROT | 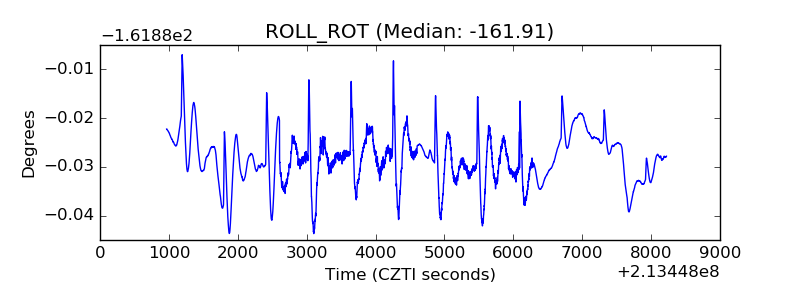 |
| _Roll_DEC | 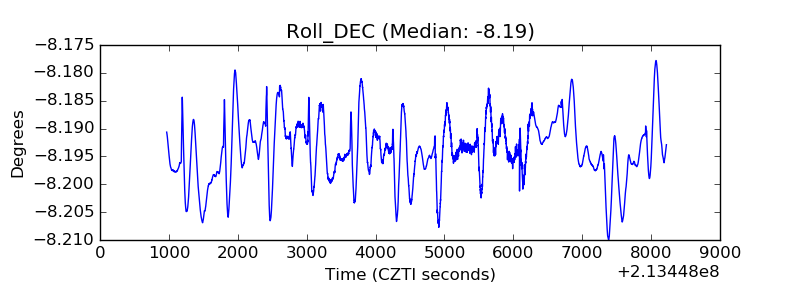 |
| _Roll_RA |  |
| Veto Counter | 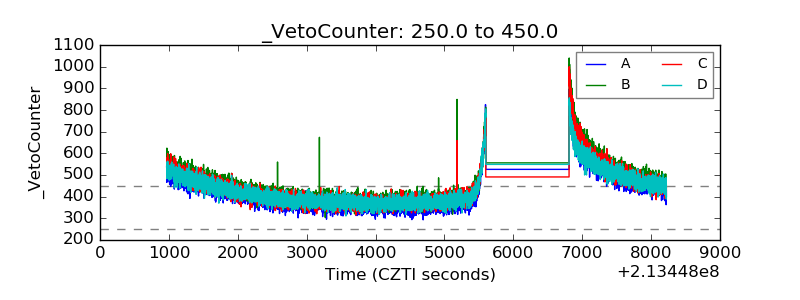 |