| Param | Original file | Final file |
|---|---|---|
| Filename | modeM0/AS1G06_084T01_9000000710_05545cztM0_level2.evt | modeM0/AS1G06_084T01_9000000710_05545cztM0_level2_quad_clean.evt |
| Size (bytes) | 495,146,880 | 84,274,560 |
| Size | 472.2 MB | 80.4 MB |
| Events in quadrant A | 3,182,538 | 526,346 |
| Events in quadrant B | 3,868,687 | 524,780 |
| Events in quadrant C | 3,201,268 | 530,073 |
| Events in quadrant D | 4,285,441 | 500,941 |
| Mode M0 | |||
|---|---|---|---|
| Quadrant | BADHDUFLAG | Total packets | Discarded packets |
| A | 0 | 14051 | 3 |
| B | 0 | 15880 | 2 |
| C | 0 | 14226 | 2 |
| D | 0 | 17383 | 2 |
| Mode M9 | |||
|---|---|---|---|
| Quadrant | BADHDUFLAG | Total packets | Discarded packets |
| A | 0 | 13 | 0 |
| B | 0 | 13 | 0 |
| C | 0 | 13 | 0 |
| D | 0 | 14 | 0 |
| Mode SS | |||
|---|---|---|---|
| Quadrant | BADHDUFLAG | Total packets | Discarded packets |
| A | 0 | 138 | 0 |
| B | 0 | 138 | 0 |
| C | 0 | 138 | 0 |
| D | 0 | 138 | 0 |
| Quadrant | Total seconds | Saturated seconds | Saturation percentage |
|---|---|---|---|
| A | 6735 | 92 | 1.365999% |
| B | 6735 | 187 | 2.776540% |
| C | 6735 | 83 | 1.232368% |
| D | 6735 | 295 | 4.380104% |
Noise dominated data is calculated using 1-second bins in cleaned event files. If a bin has >2000 counts, and if more than 50% of those come from <1% of pixels, then it is considered to be noise-dominated and hence unusable.
| Quadrant | # 1 sec bins | Bins with >0 counts | Bins with >2000 counts | High rate bins dominated by noise | Noise dominated (total time) | Noise dominated (detector-on time) | Marked lightcurve |
|---|---|---|---|---|---|---|---|
| A | 7790 | 6736 | 1 | 1 | 0.01% | 0.01% |  |
| B | 7790 | 6736 | 46 | 46 | 0.59% | 0.68% | 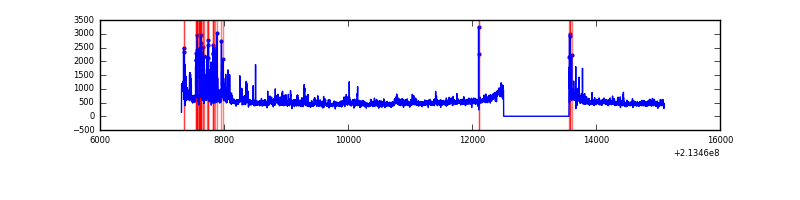 |
| C | 7790 | 6736 | 19 | 19 | 0.24% | 0.28% | 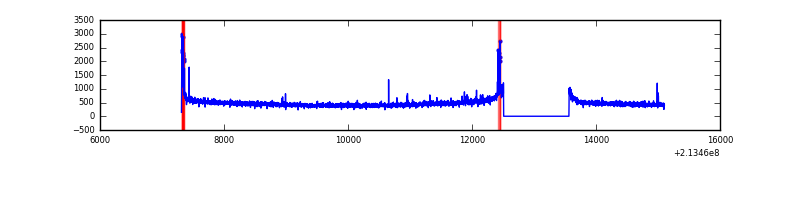 |
| D | 7790 | 6736 | 171 | 171 | 2.20% | 2.54% | 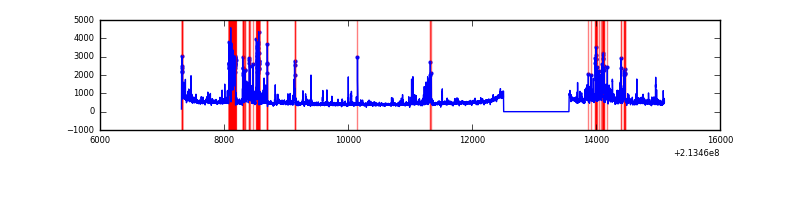 |
Top three noisy pixels from each quadrant. If the there are fewer than three noisy pixels in the level2.evt file, extra rows are filled as -1
| Pixel properties | Quadrant properties | ||||||
|---|---|---|---|---|---|---|---|
| Quadrant | DetID | PixID | Counts | Sigma | Mean | Median | Sigma |
| A | 0 | 50 | 9854 | 53.28 | 823 | 804 | 169.8 |
| A | 12 | 194 | 8227 | 43.7 | 823 | 804 | 169.8 |
| A | 0 | 226 | 8179 | 43.42 | 823 | 804 | 169.8 |
| B | 15 | 204 | 328496 | 2057.35 | 822 | 801 | 159.3 |
| B | 10 | 246 | 274935 | 1721.08 | 822 | 801 | 159.3 |
| B | 11 | 51 | 27362 | 166.76 | 822 | 801 | 159.3 |
| C | 9 | 16 | 89856 | 484.39 | 789 | 793 | 183.9 |
| C | 1 | 16 | 32276 | 171.23 | 789 | 793 | 183.9 |
| C | 13 | 61 | 6413 | 30.57 | 789 | 793 | 183.9 |
| D | 2 | 63 | 642767 | 3331.86 | 784 | 759 | 192.7 |
| D | 2 | 152 | 429733 | 2226.26 | 784 | 759 | 192.7 |
| D | 8 | 195 | 110042 | 567.15 | 784 | 759 | 192.7 |
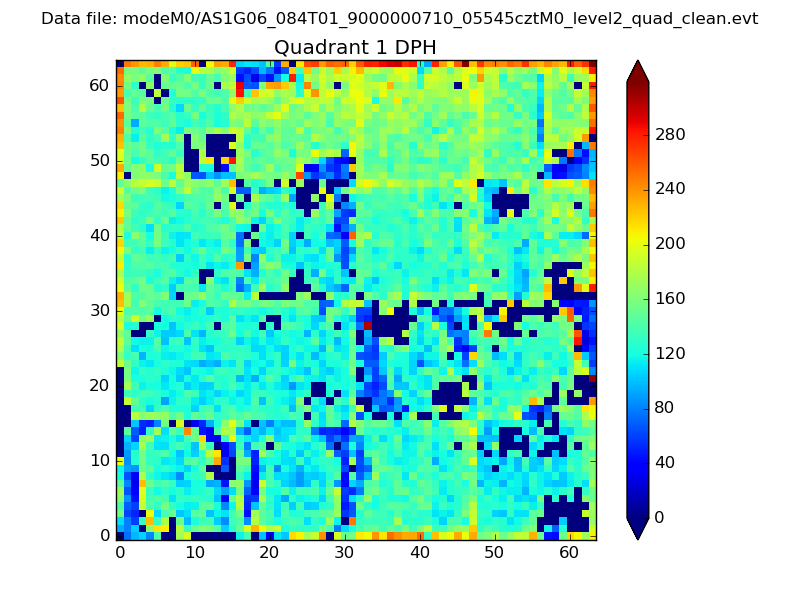
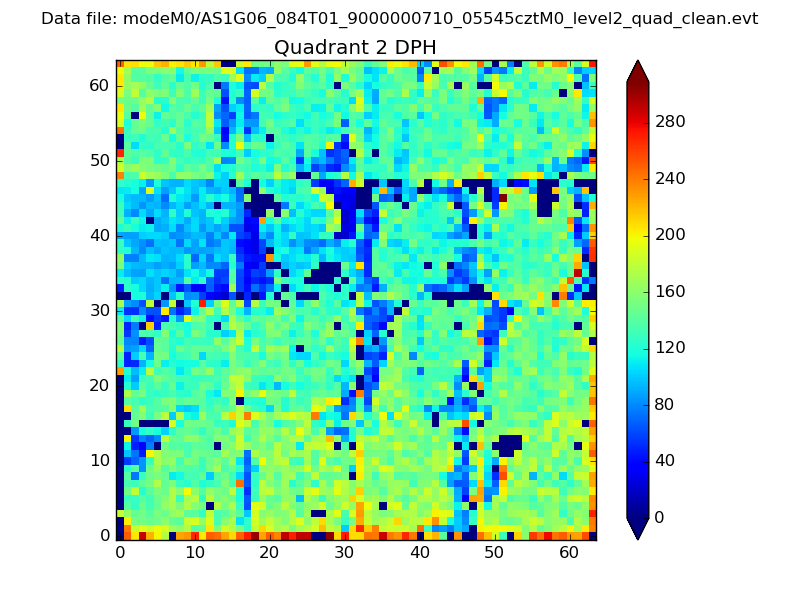
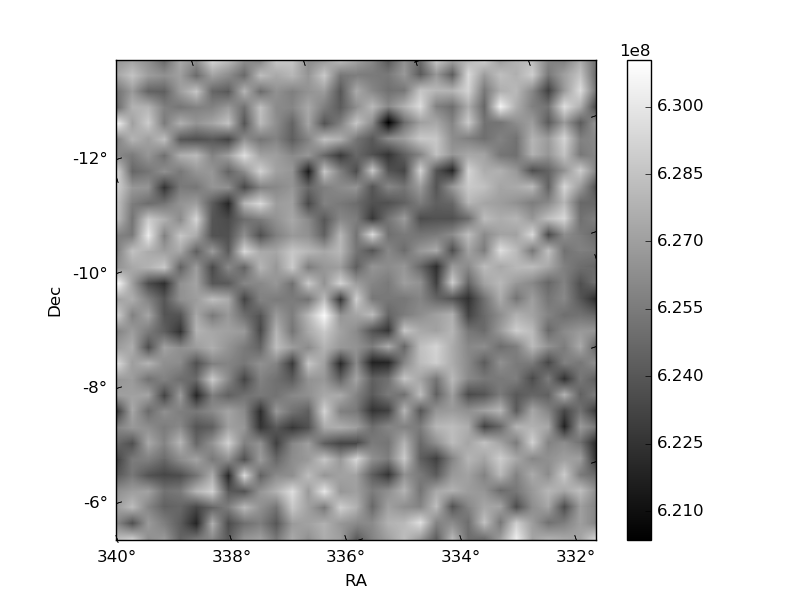
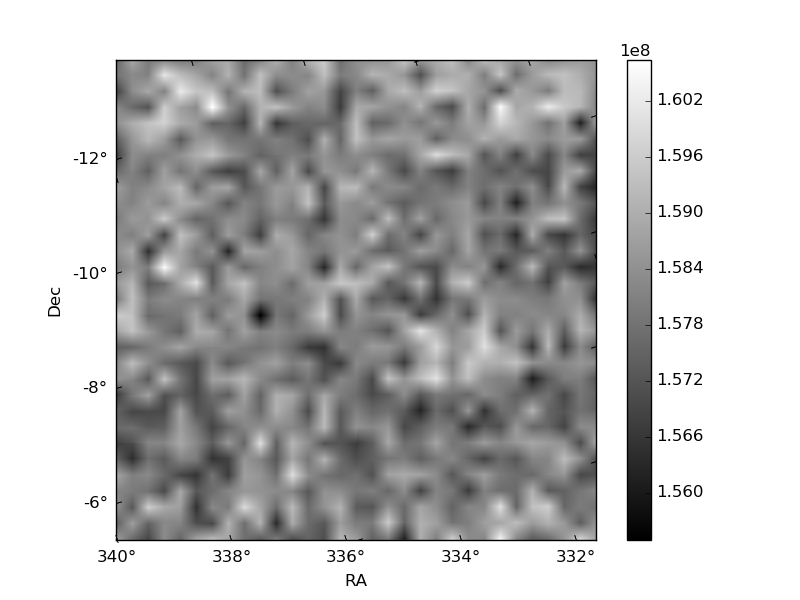
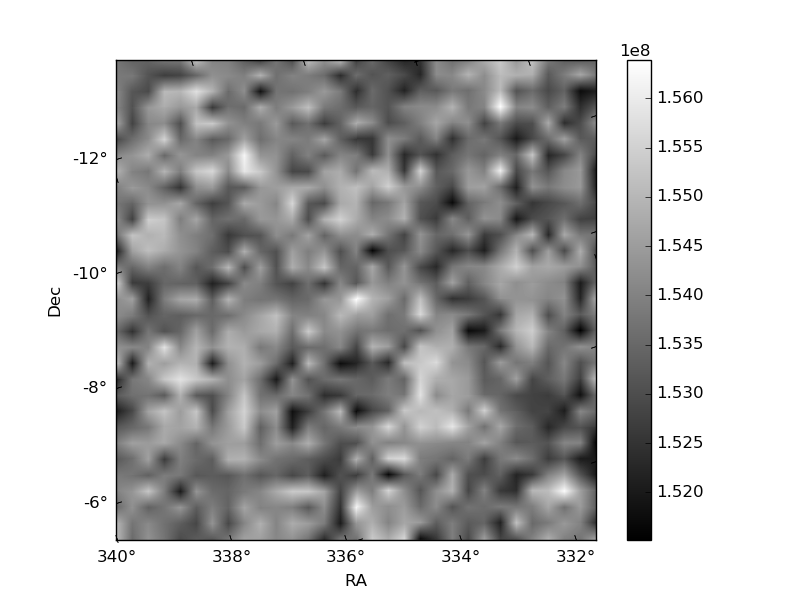
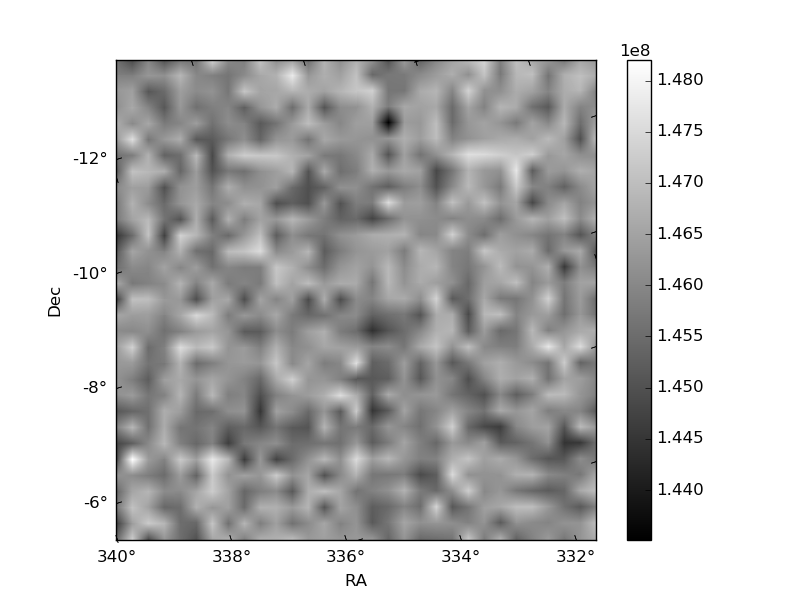
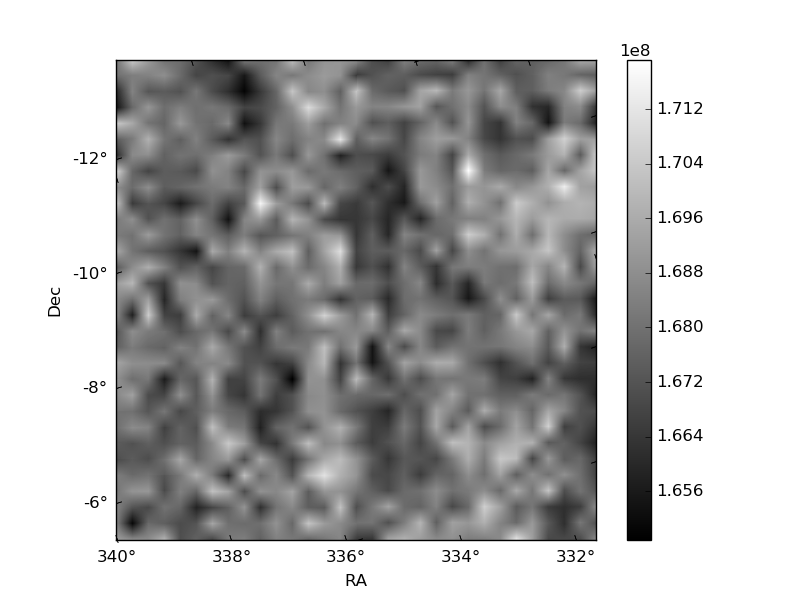
Histogram calculated using DETX and DETY for each event in the final _common_clean file
| Quadrant A | 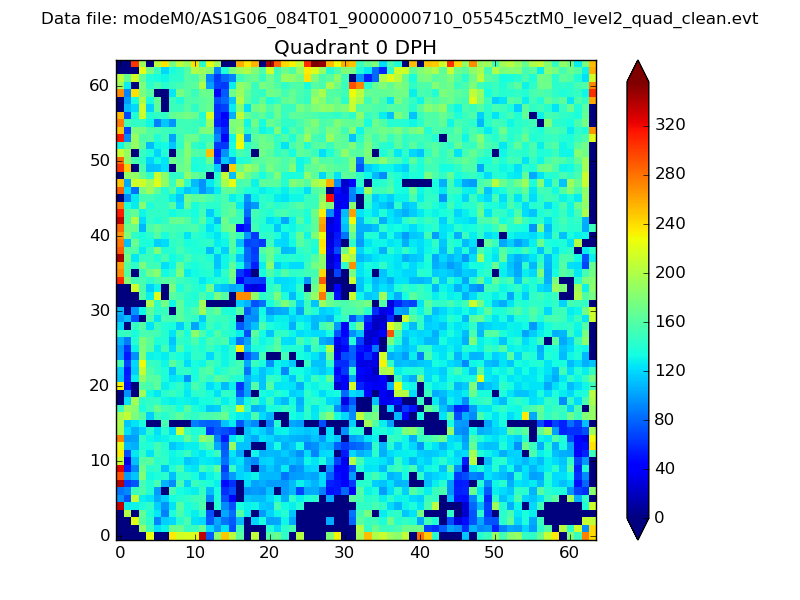 |
 |
Quadrant B |
|---|---|---|---|
| Quadrant D | 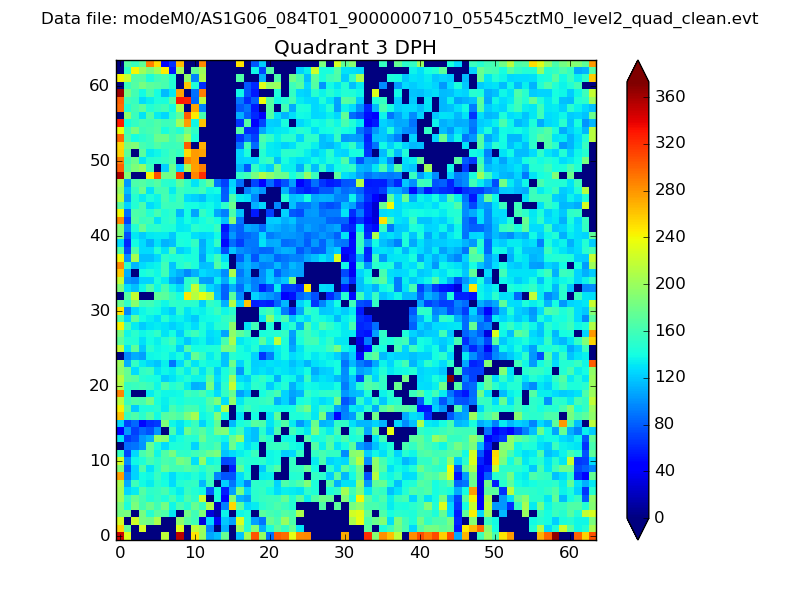 |
 |
Quadrant C |
| Plot type | Count rate plots | Images |
|---|---|---|
| Comparison with Poisson distribution Blue bars denote a histogram of data divided into 1 sec bins. Red curve is a Poisson curve with rate = median count rate of data. |
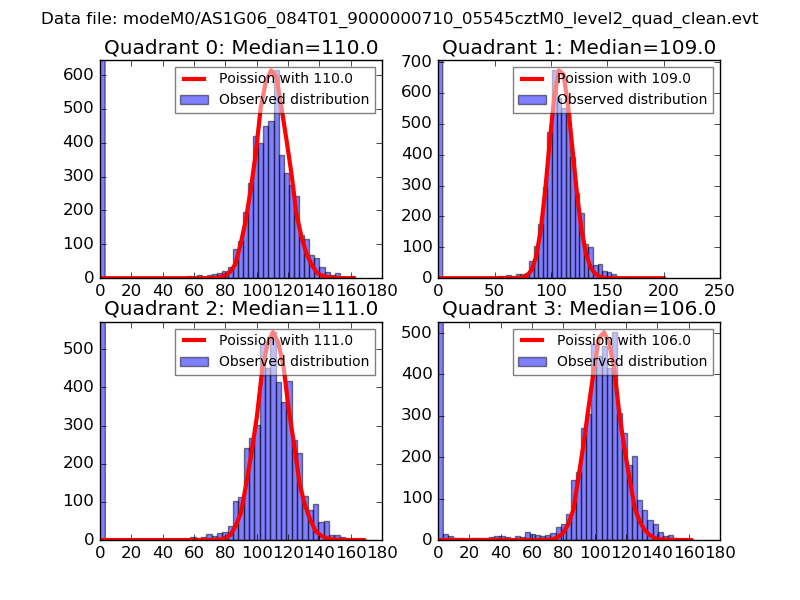 |
 |
| Quadrant-wise count rates Data is divided into 100 sec bins |
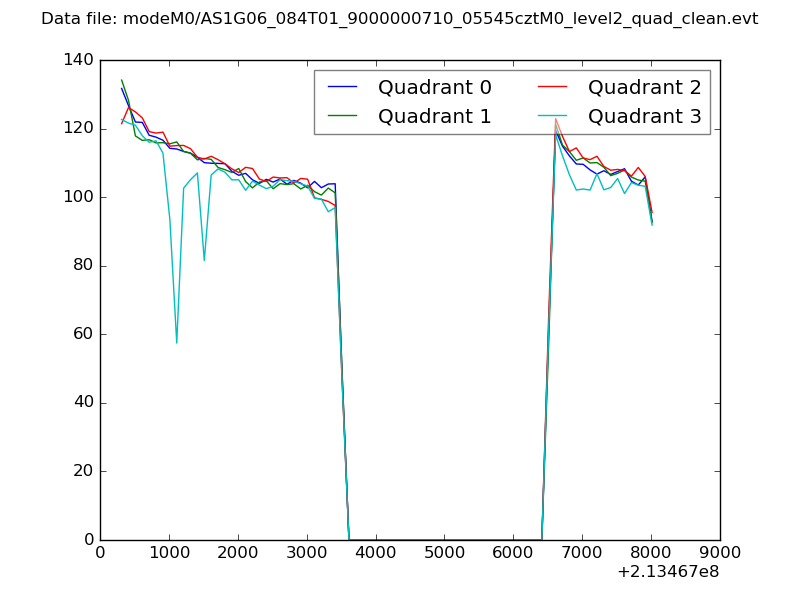 |
|
| Module-wise count rates for Quadrant A Data is divided into 100 sec bins |
 |
 |
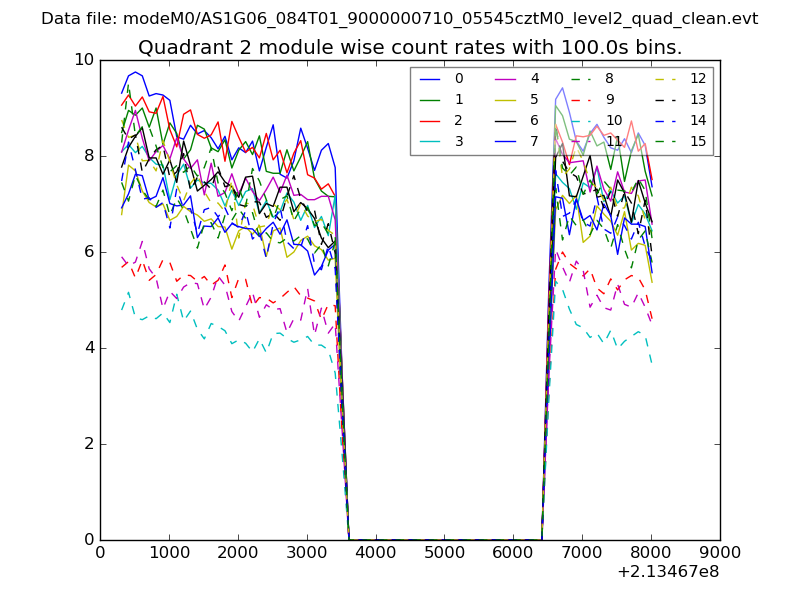
| Module-wise count rates for Quadrant B Data is divided into 100 sec bins |
 |
 |
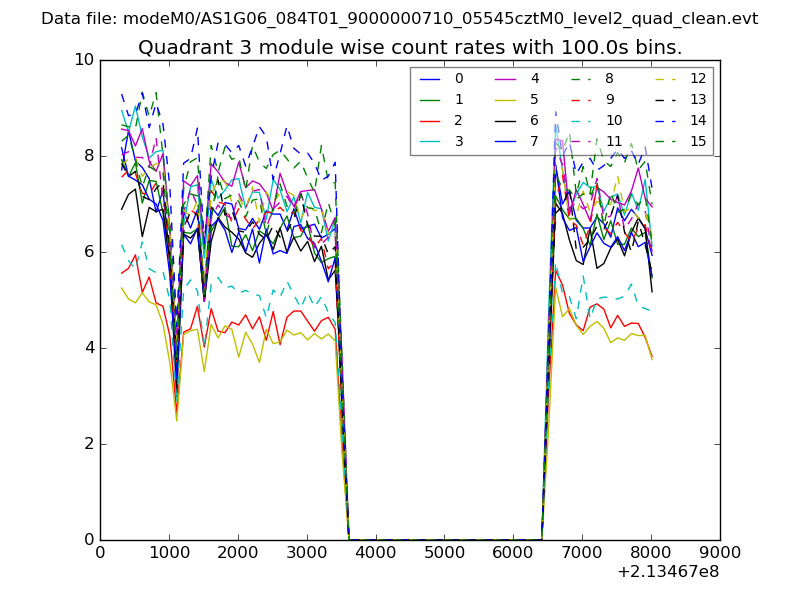
| Module-wise count rates for Quadrant C Data is divided into 100 sec bins |
 |
 |
| Module-wise count rates for Quadrant D Data is divided into 100 sec bins |
 |
 |
| Parameter | Plot |
|---|---|
| CZT HV Monitor | 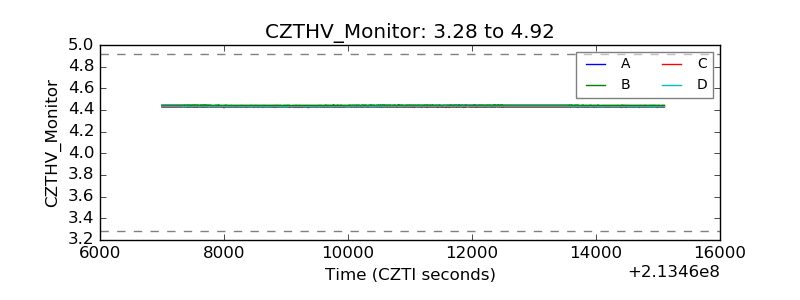 |
| D_VDD | 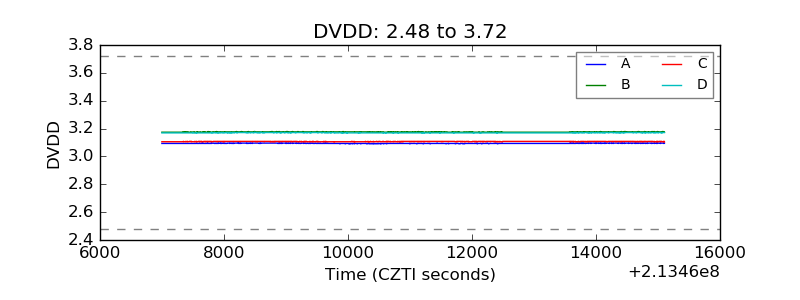 |
| Temperature 1 | 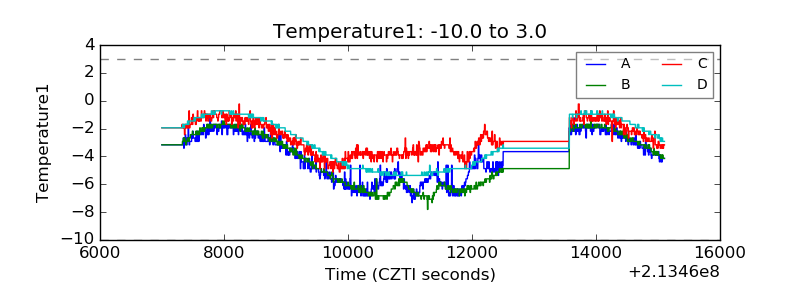 |
| Veto HV Monitor | 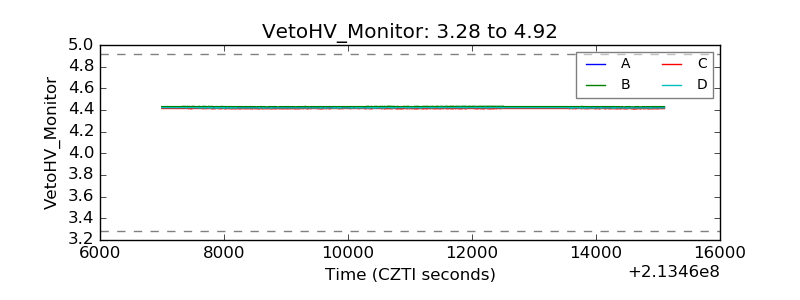 |
| Veto LLD | 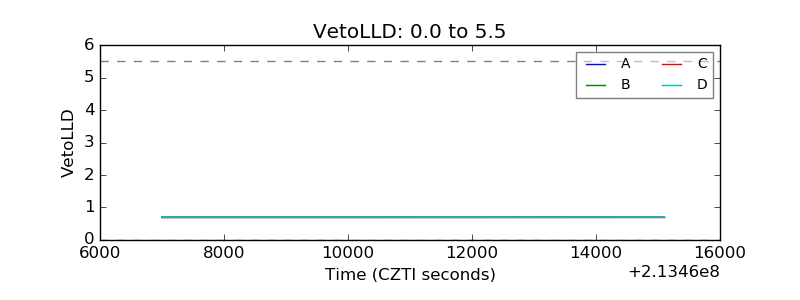 |
| Alpha Counter | 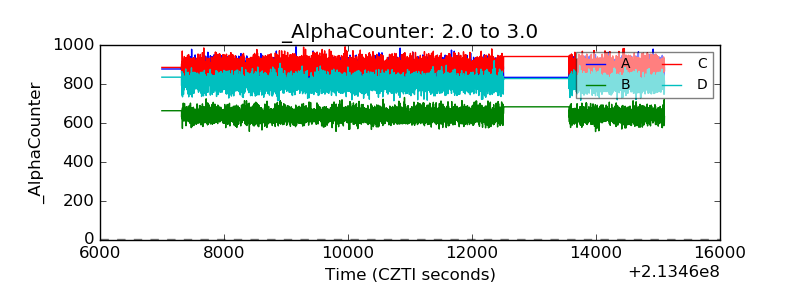 |
| _CPM_Rate | 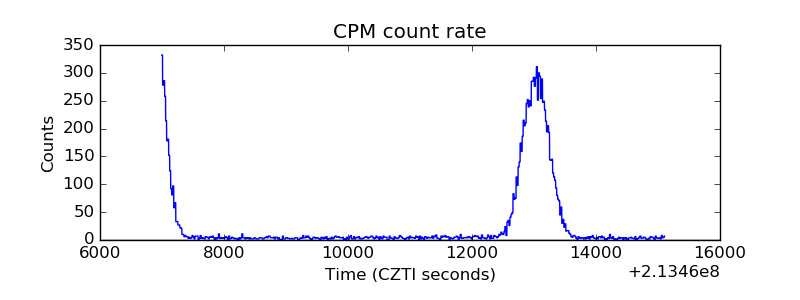 |
| CZT Counter | 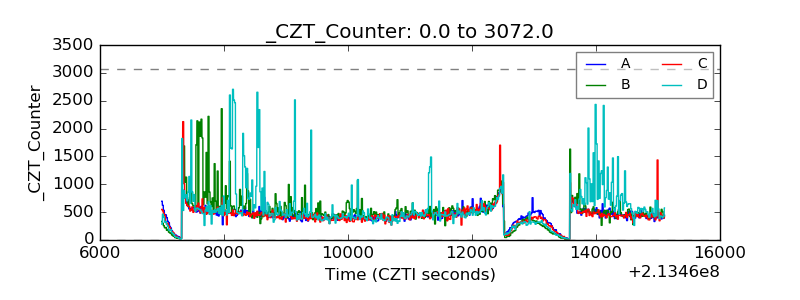 |
| +2.5 Volts monitor |  |
| +5 Volts monitor | 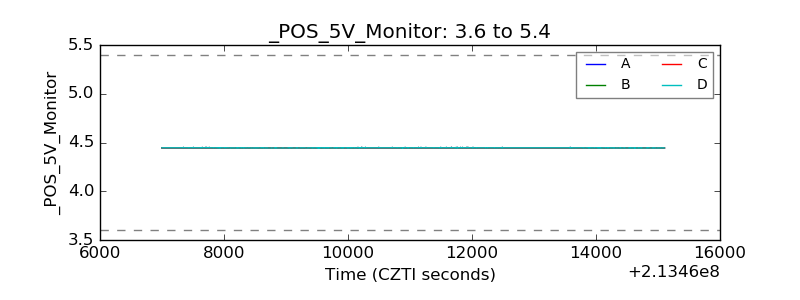 |
| _ROLL_ROT | 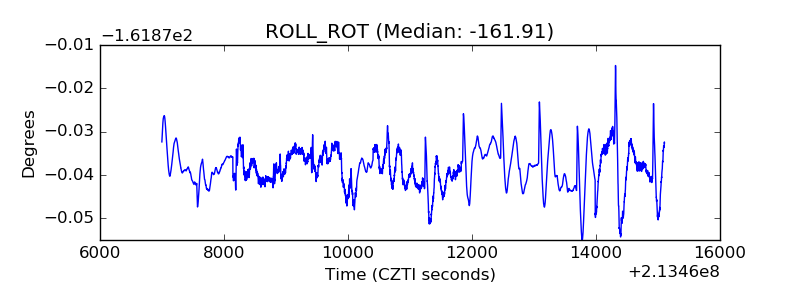 |
| _Roll_DEC | 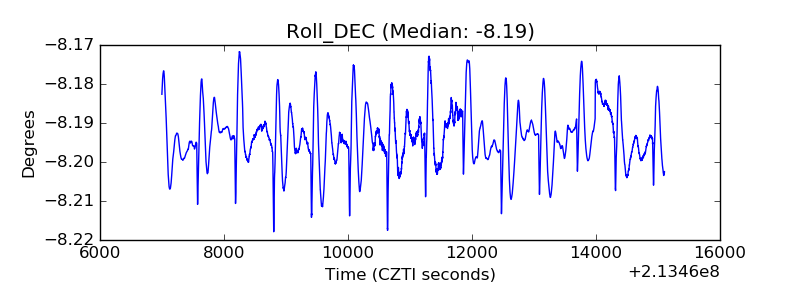 |
| _Roll_RA | 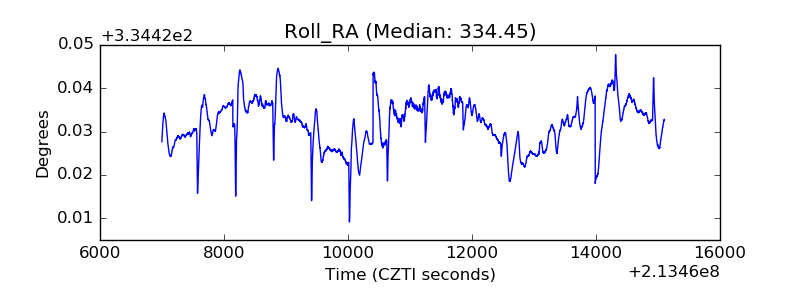 |
| Veto Counter | 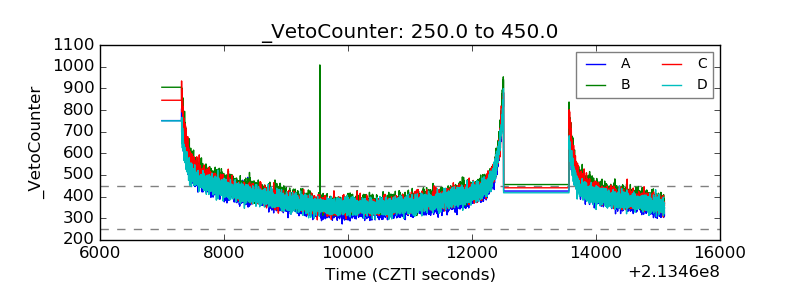 |