| Param | Original file | Final file |
|---|---|---|
| Filename | modeM0/AS1G06_084T01_9000000710_05546cztM0_level2.evt | modeM0/AS1G06_084T01_9000000710_05546cztM0_level2_quad_clean.evt |
| Size (bytes) | 151,850,880 | 34,058,880 |
| Size | 144.8 MB | 32.5 MB |
| Events in quadrant A | 972,158 | 220,328 |
| Events in quadrant B | 1,089,462 | 220,300 |
| Events in quadrant C | 961,318 | 224,884 |
| Events in quadrant D | 1,431,298 | 213,969 |
| Mode M0 | |||
|---|---|---|---|
| Quadrant | BADHDUFLAG | Total packets | Discarded packets |
| A | 0 | 4318 | 1 |
| B | 0 | 4610 | 1 |
| C | 0 | 4338 | 1 |
| D | 0 | 5685 | 1 |
| Mode M9 | |||
|---|---|---|---|
| Quadrant | BADHDUFLAG | Total packets | Discarded packets |
| A | 0 | 10 | 0 |
| B | 0 | 10 | 0 |
| C | 0 | 10 | 0 |
| D | 0 | 10 | 0 |
| Mode SS | |||
|---|---|---|---|
| Quadrant | BADHDUFLAG | Total packets | Discarded packets |
| A | 0 | 46 | 0 |
| B | 0 | 46 | 0 |
| C | 0 | 46 | 0 |
| D | 0 | 46 | 0 |
| Quadrant | Total seconds | Saturated seconds | Saturation percentage |
|---|---|---|---|
| A | 2082 | 37 | 1.777137% |
| B | 2082 | 57 | 2.737752% |
| C | 2082 | 25 | 1.200768% |
| D | 2082 | 71 | 3.410183% |
Noise dominated data is calculated using 1-second bins in cleaned event files. If a bin has >2000 counts, and if more than 50% of those come from <1% of pixels, then it is considered to be noise-dominated and hence unusable.
| Quadrant | # 1 sec bins | Bins with >0 counts | Bins with >2000 counts | High rate bins dominated by noise | Noise dominated (total time) | Noise dominated (detector-on time) | Marked lightcurve |
|---|---|---|---|---|---|---|---|
| A | 3137 | 2083 | 0 | 0 | 0.00% | 0.00% | 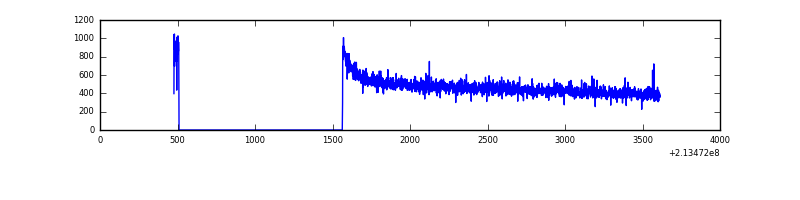 |
| B | 3137 | 2083 | 5 | 5 | 0.16% | 0.24% |  |
| C | 3137 | 2083 | 0 | 0 | 0.00% | 0.00% | 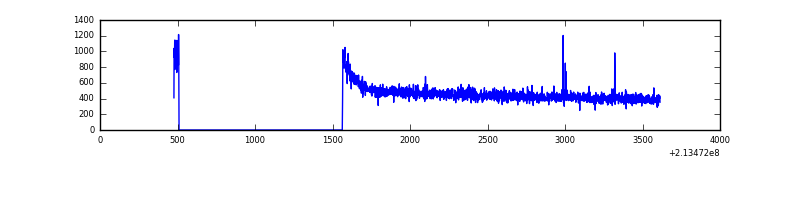 |
| D | 3137 | 2083 | 32 | 32 | 1.02% | 1.54% |  |
Top three noisy pixels from each quadrant. If the there are fewer than three noisy pixels in the level2.evt file, extra rows are filled as -1
| Pixel properties | Quadrant properties | ||||||
|---|---|---|---|---|---|---|---|
| Quadrant | DetID | PixID | Counts | Sigma | Mean | Median | Sigma |
| A | 0 | 226 | 2620 | 44.16 | 252 | 246 | 53.8 |
| A | 12 | 194 | 2583 | 43.47 | 252 | 246 | 53.8 |
| A | 0 | 50 | 748 | 9.34 | 252 | 246 | 53.8 |
| B | 15 | 204 | 72277 | 1424.39 | 250 | 244 | 50.6 |
| B | 10 | 246 | 12703 | 246.37 | 250 | 244 | 50.6 |
| B | 4 | 48 | 12361 | 239.6 | 250 | 244 | 50.6 |
| C | 1 | 16 | 13426 | 230.62 | 241 | 242 | 57.2 |
| C | 9 | 16 | 7114 | 120.21 | 241 | 242 | 57.2 |
| C | 13 | 61 | 1979 | 30.38 | 241 | 242 | 57.2 |
| D | 2 | 63 | 265901 | 4276.06 | 242 | 234 | 62.1 |
| D | 2 | 152 | 140246 | 2253.57 | 242 | 234 | 62.1 |
| D | 8 | 195 | 42206 | 675.56 | 242 | 234 | 62.1 |
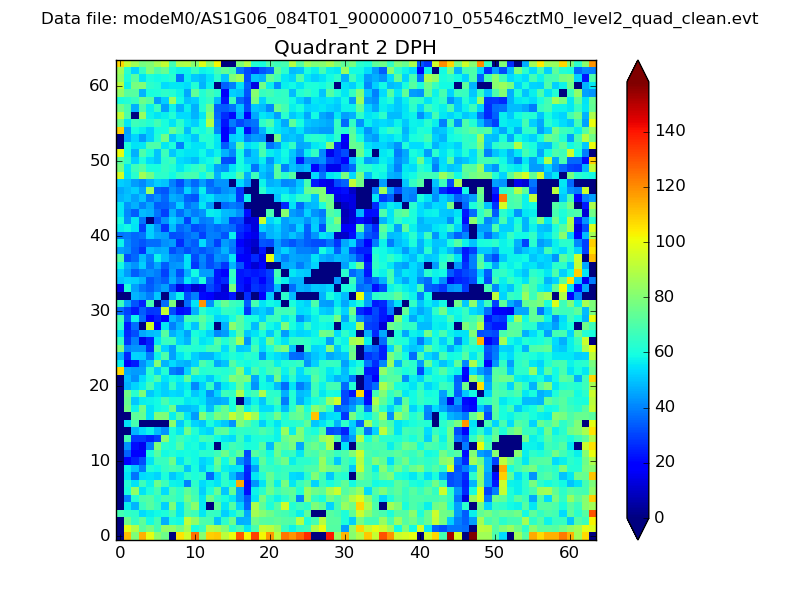
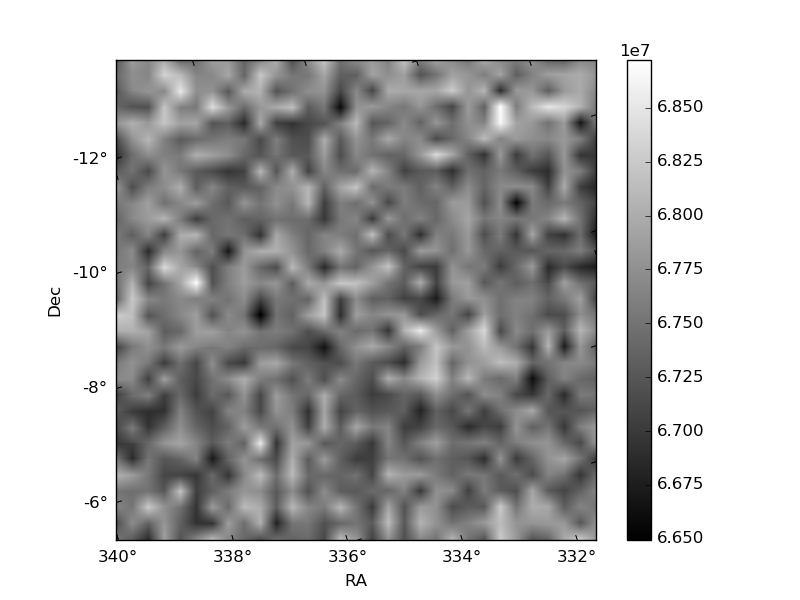
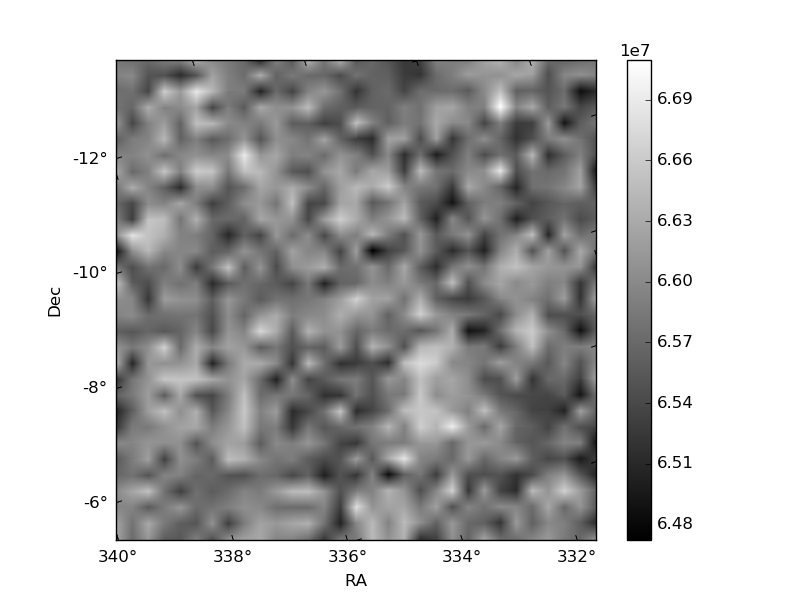
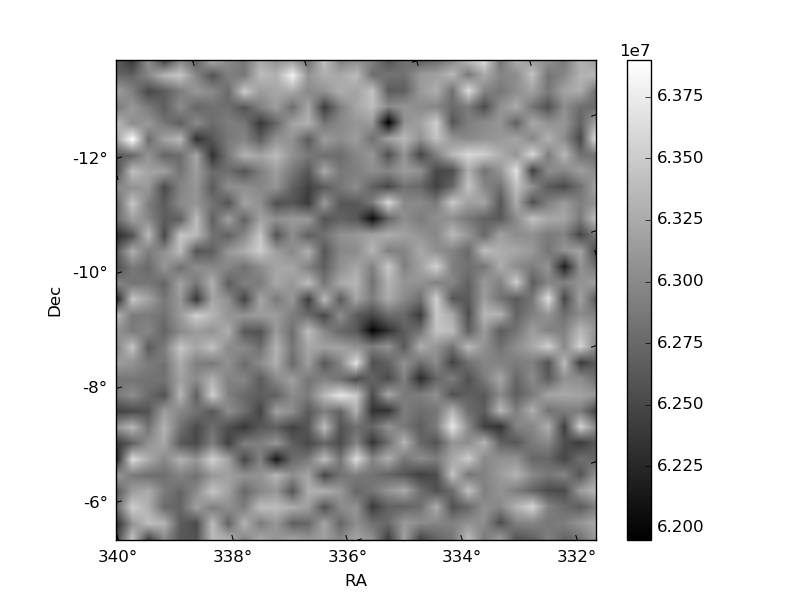
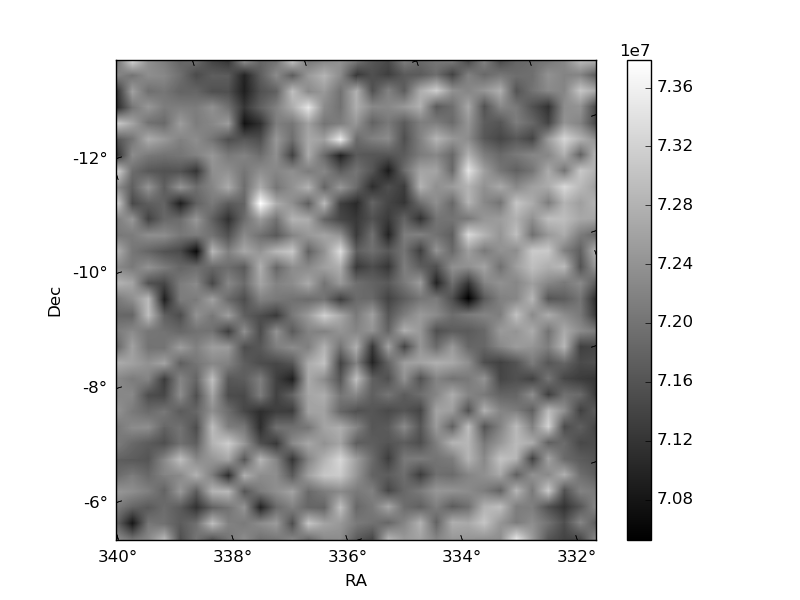
Histogram calculated using DETX and DETY for each event in the final _common_clean file
| Quadrant A | 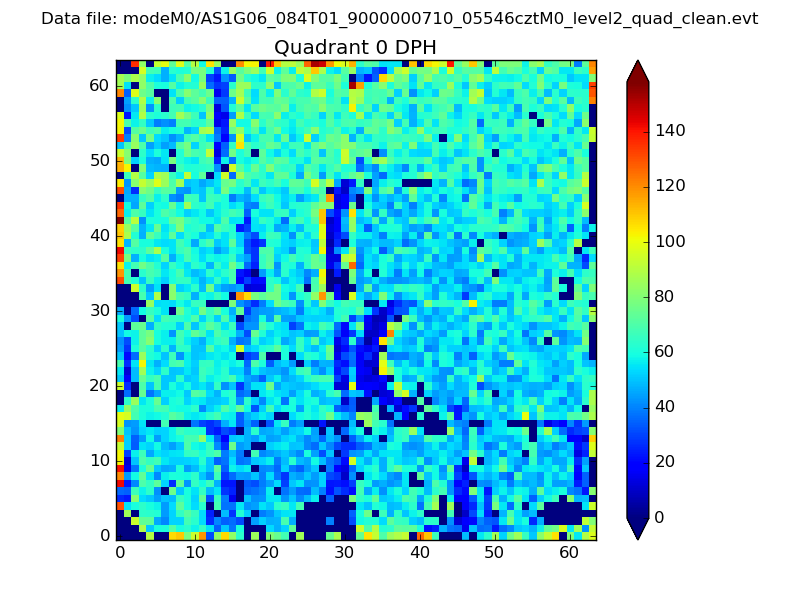 |
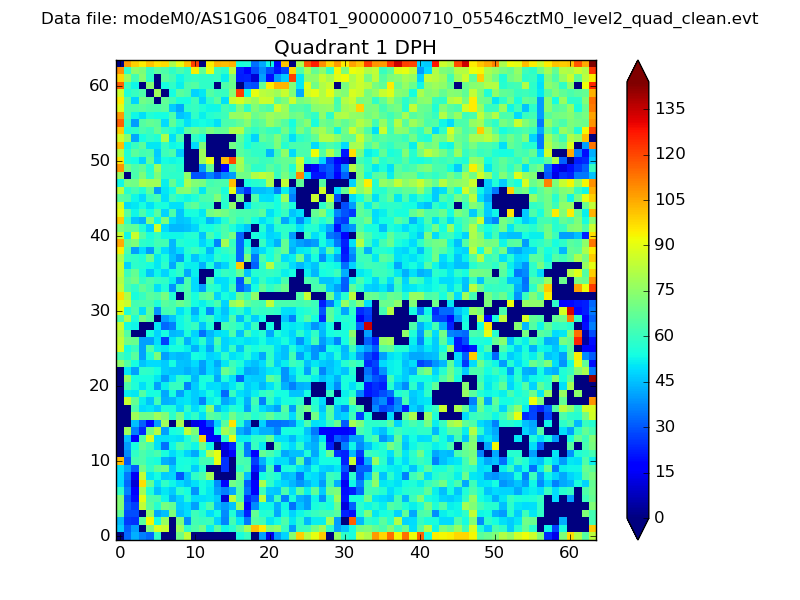 |
Quadrant B |
|---|---|---|---|
| Quadrant D | 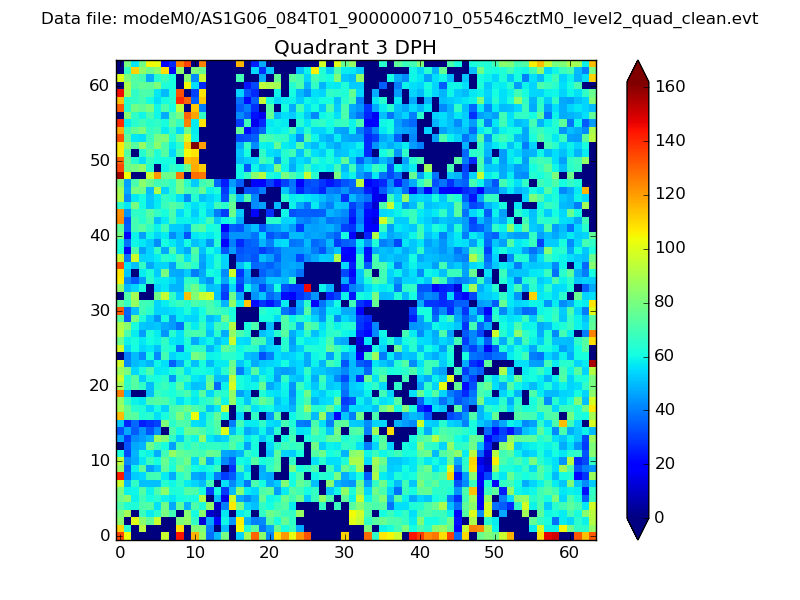 |
 |
Quadrant C |
| Plot type | Count rate plots | Images |
|---|---|---|
| Comparison with Poisson distribution Blue bars denote a histogram of data divided into 1 sec bins. Red curve is a Poisson curve with rate = median count rate of data. |
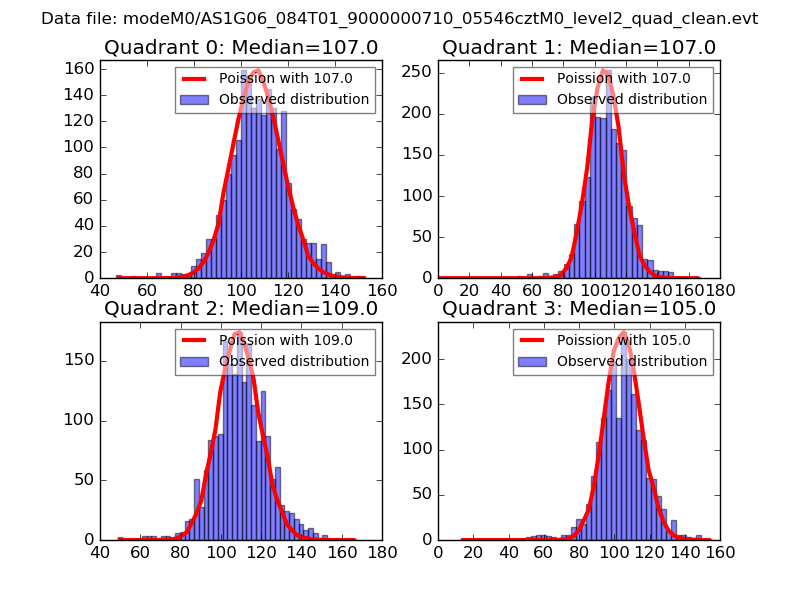 |
 |
| Quadrant-wise count rates Data is divided into 100 sec bins |
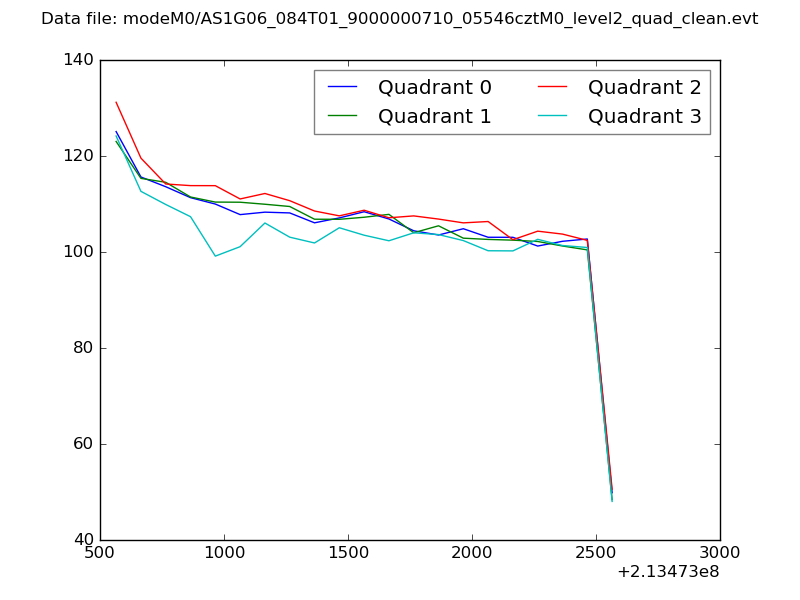 |
|
| Module-wise count rates for Quadrant A Data is divided into 100 sec bins |
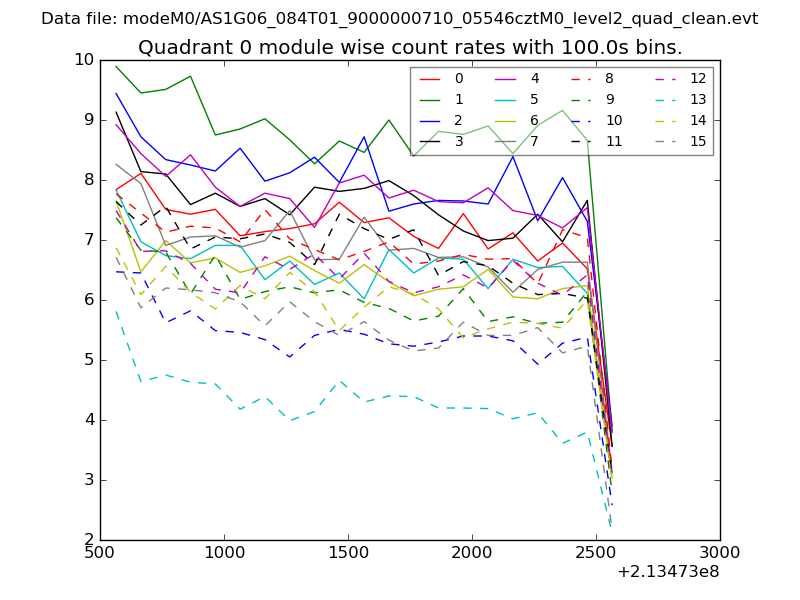 |
 |
| Module-wise count rates for Quadrant B Data is divided into 100 sec bins |
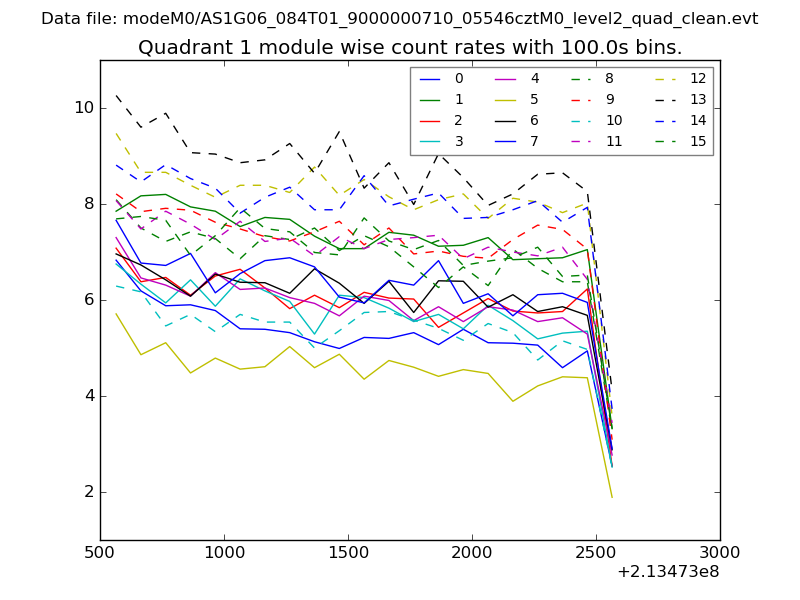 |
 |
| Module-wise count rates for Quadrant C Data is divided into 100 sec bins |
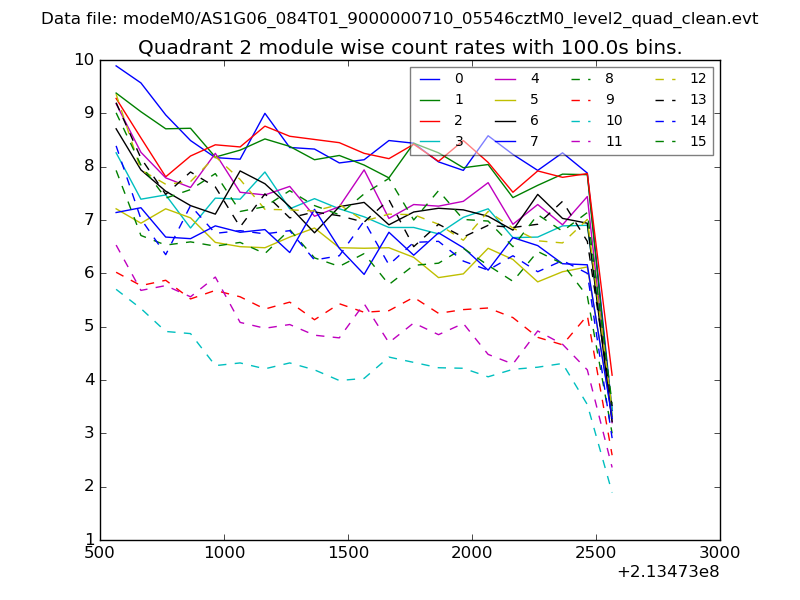 |
 |
| Module-wise count rates for Quadrant D Data is divided into 100 sec bins |
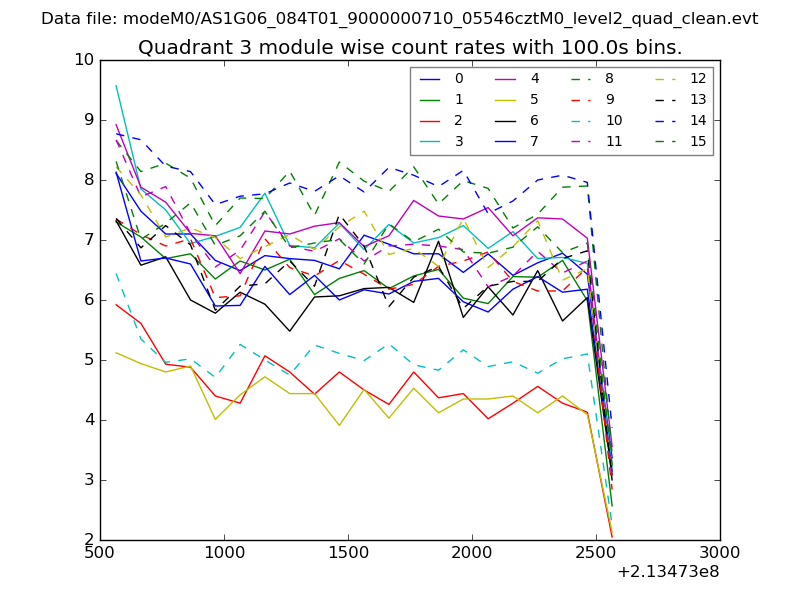 |
 |
| Parameter | Plot |
|---|---|
| CZT HV Monitor | 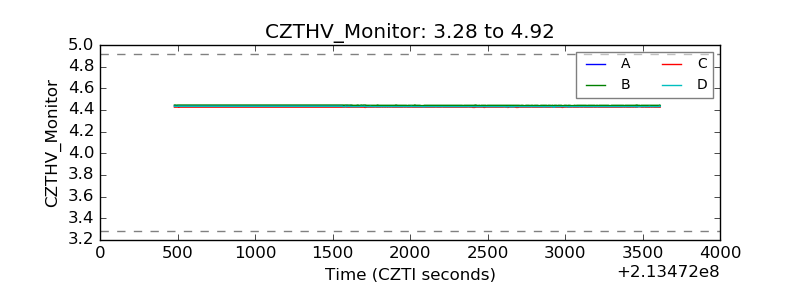 |
| D_VDD | 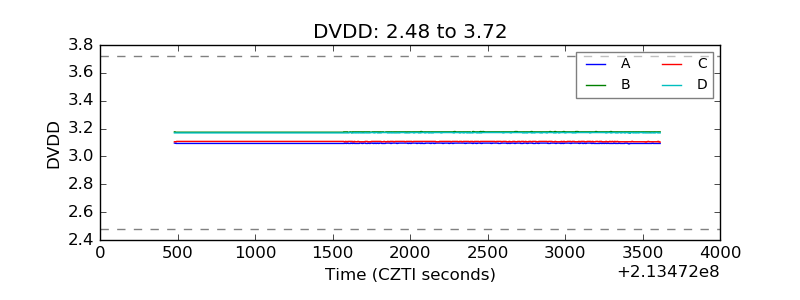 |
| Temperature 1 | 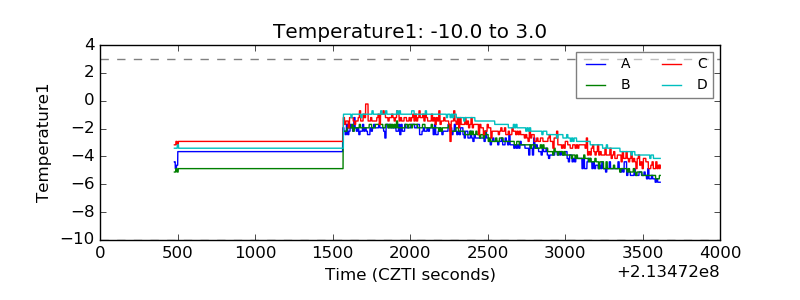 |
| Veto HV Monitor | 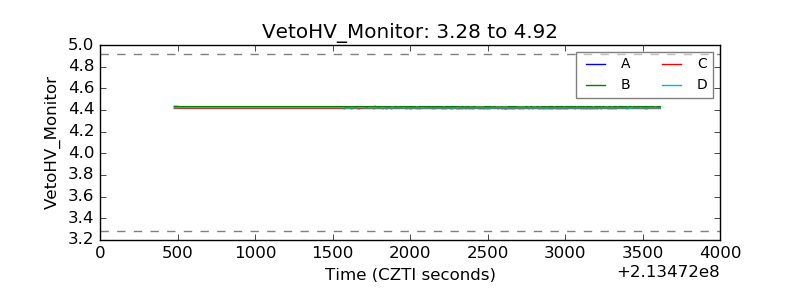 |
| Veto LLD |  |
| Alpha Counter | 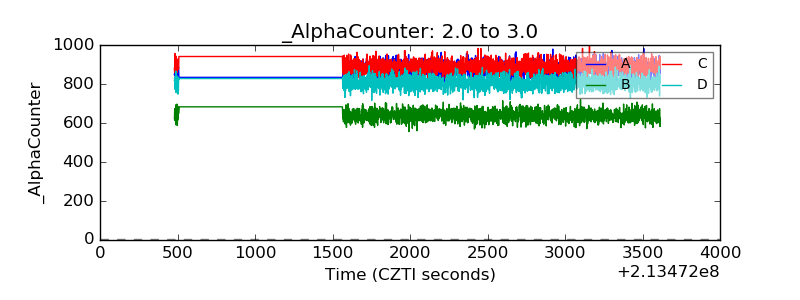 |
| _CPM_Rate | 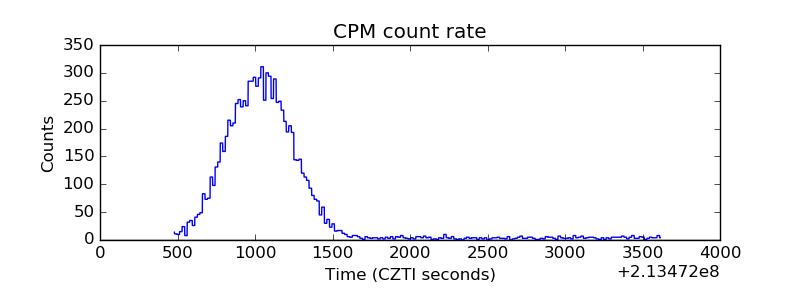 |
| CZT Counter | 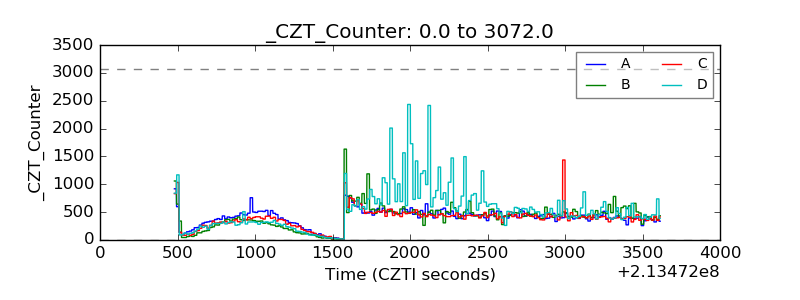 |
| +2.5 Volts monitor |  |
| +5 Volts monitor |  |
| _ROLL_ROT | 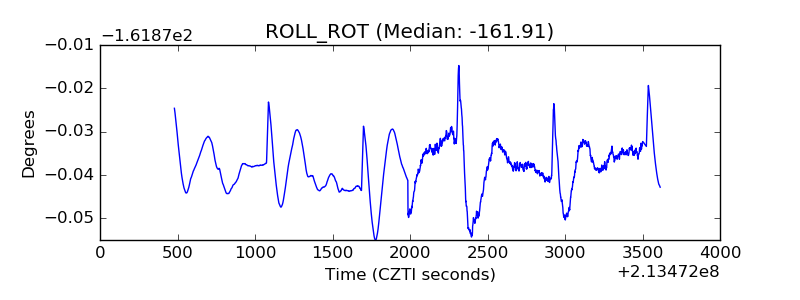 |
| _Roll_DEC | 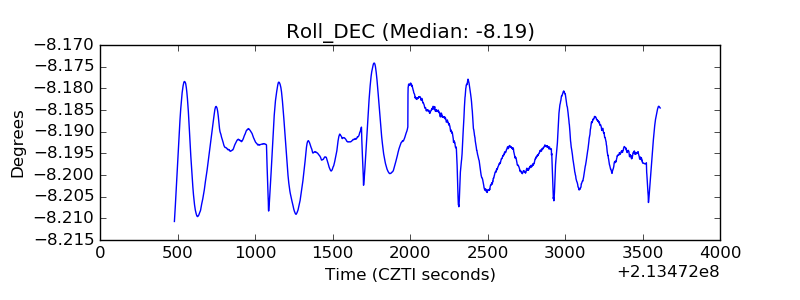 |
| _Roll_RA | 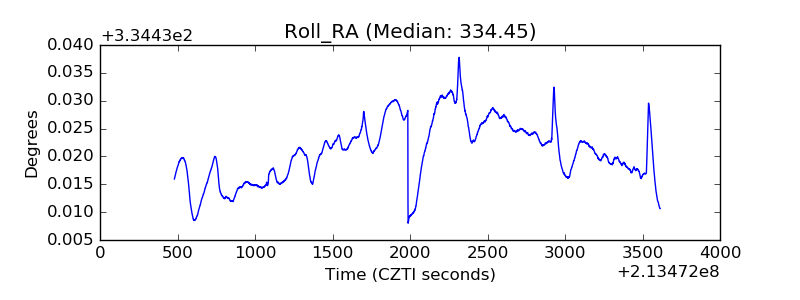 |
| Veto Counter | 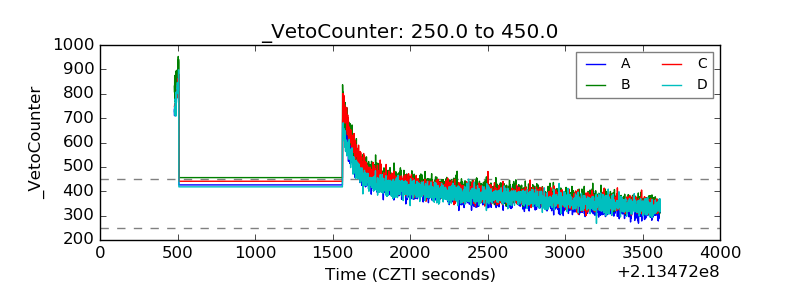 |