| Param | Original file | Final file |
|---|---|---|
| Filename | modeM0/AS1A02_086T01_9000000714cztM0_level2.fits | modeM0/AS1A02_086T01_9000000714cztM0_level2_quad_clean.evt |
| Size (bytes) | 539,352,000 | 533,730,240 |
| Size | 514.4 MB | 509.0 MB |
| Events in quadrant A | 3,243,952 | 3,157,264 |
| Events in quadrant B | 3,119,612 | 3,132,989 |
| Events in quadrant C | 3,205,474 | 3,076,011 |
| Events in quadrant D | 2,730,516 | 2,764,363 |
| Mode M9 | |||
|---|---|---|---|
| Quadrant | BADHDUFLAG | Total packets | Discarded packets |
| A | 0 | 97 | 0 |
| B | 0 | 97 | 0 |
| C | 0 | 97 | 0 |
| D | 0 | 97 | 0 |
| Mode M0 | |||
|---|---|---|---|
| Quadrant | BADHDUFLAG | Total packets | Discarded packets |
| A | 0 | 126044 | 0 |
| B | 0 | 140557 | 0 |
| C | 0 | 121547 | 0 |
| D | 0 | 146870 | 0 |
| Mode SS | |||
|---|---|---|---|
| Quadrant | BADHDUFLAG | Total packets | Discarded packets |
| A | 0 | 1202 | 0 |
| B | 0 | 1202 | 0 |
| C | 0 | 1202 | 0 |
| D | 0 | 1202 | 0 |
| Quadrant | Total seconds | Saturated seconds | Saturation percentage |
|---|---|---|---|
| A | 58797 | 1114 | 1.894654% |
| B | 58797 | 1552 | 2.639590% |
| C | 58797 | 560 | 0.952430% |
| D | 58797 | 2080 | 3.537595% |
Noise dominated data is calculated using 1-second bins in cleaned event files. If a bin has >2000 counts, and if more than 50% of those come from <1% of pixels, then it is considered to be noise-dominated and hence unusable.
| Quadrant | # 1 sec bins | Bins with >0 counts | Bins with >2000 counts | High rate bins dominated by noise | Noise dominated (total time) | Noise dominated (detector-on time) | Marked lightcurve |
|---|---|---|---|---|---|---|---|
| A | 72435 | 58795 | 0 | 0 | 0.00% | 0.00% |  |
| B | 72435 | 58788 | 0 | 0 | 0.00% | 0.00% |  |
| C | 72435 | 58798 | 0 | 0 | 0.00% | 0.00% |  |
| D | 72435 | 58782 | 0 | 0 | 0.00% | 0.00% |  |
Top three noisy pixels from each quadrant. If the there are fewer than three noisy pixels in the level2.evt file, extra rows are filled as -1
| Pixel properties | Quadrant properties | ||||||
|---|---|---|---|---|---|---|---|
| Quadrant | DetID | PixID | Counts | Sigma | Mean | Median | Sigma |
| A | 14 | 188 | 3329 | 11.83 | 842 | 786 | 214.9 |
| A | 0 | 29 | 3244 | 11.44 | 842 | 786 | 214.9 |
| A | 14 | 204 | 2950 | 10.07 | 842 | 786 | 214.9 |
| B | 2 | 9 | 2712 | 11.74 | 823 | 781 | 164.5 |
| B | 12 | 226 | 2205 | 8.65 | 823 | 781 | 164.5 |
| B | 5 | 128 | 2180 | 8.5 | 823 | 781 | 164.5 |
| C | 1 | 81 | 2364 | 7.1 | 845 | 779 | 223.2 |
| C | 1 | 80 | 2330 | 6.95 | 845 | 779 | 223.2 |
| C | 12 | 241 | 2254 | 6.61 | 845 | 779 | 223.2 |
| D | 3 | 14 | 2019 | 6.31 | 778 | 707 | 207.9 |
| D | 7 | 5 | 2003 | 6.23 | 778 | 707 | 207.9 |
| D | 11 | 82 | 2002 | 6.23 | 778 | 707 | 207.9 |
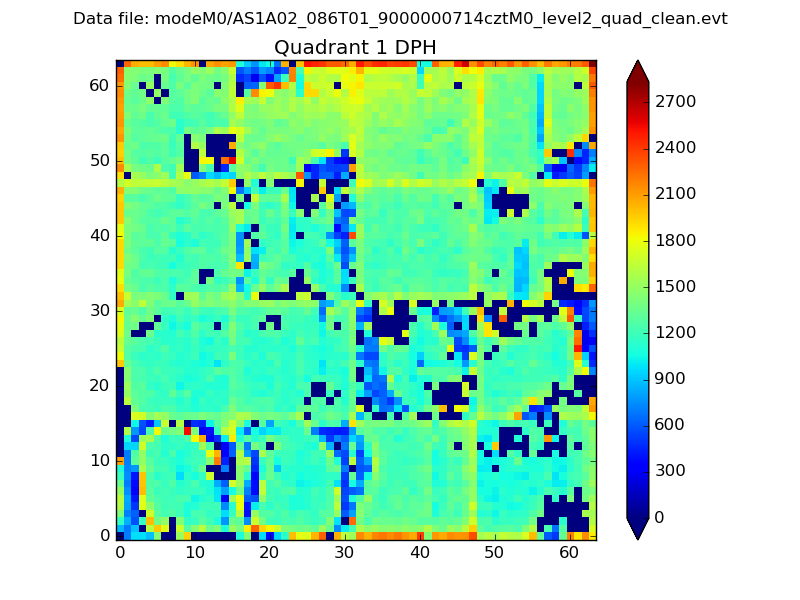
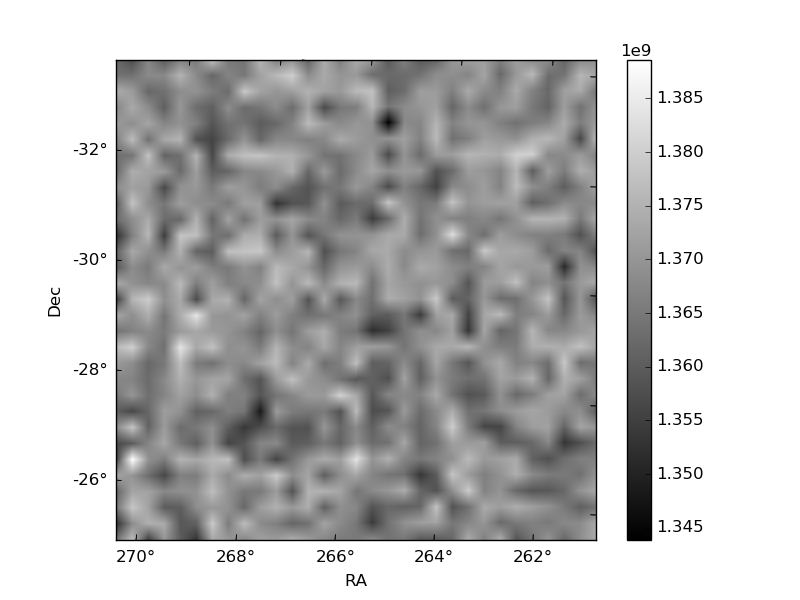
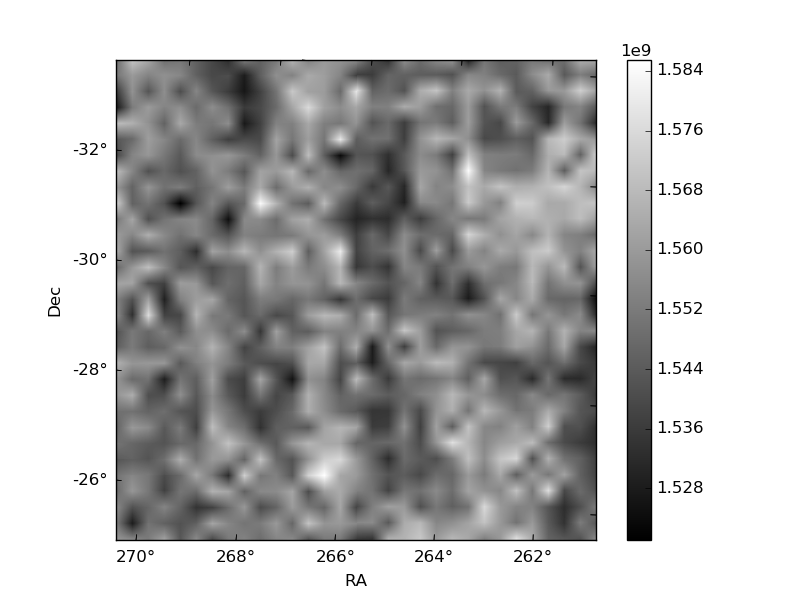
Histogram calculated using DETX and DETY for each event in the final _common_clean file
| Quadrant A |  |
 |
Quadrant B |
|---|---|---|---|
| Quadrant D | 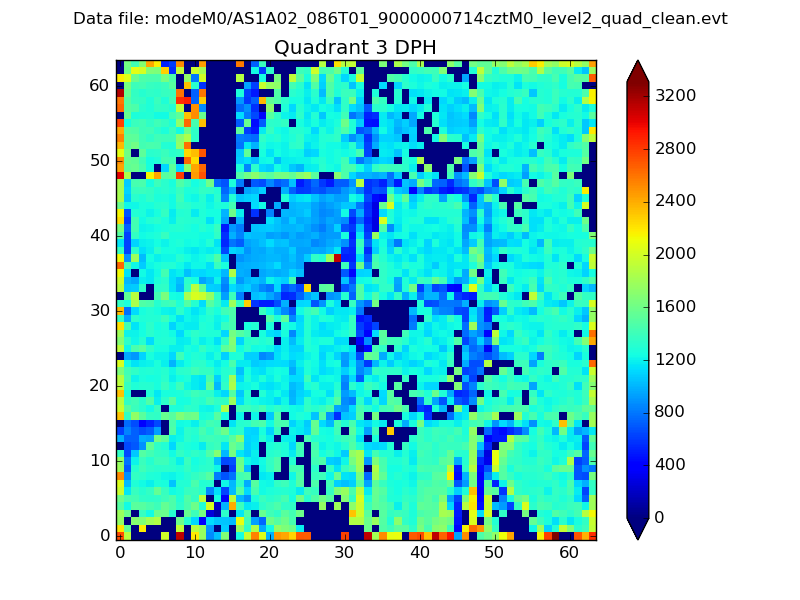 |
 |
Quadrant C |
| Plot type | Count rate plots | Images |
|---|---|---|
| Comparison with Poisson distribution Blue bars denote a histogram of data divided into 1 sec bins. Red curve is a Poisson curve with rate = median count rate of data. |
 |
 |
| Quadrant-wise count rates Data is divided into 100 sec bins |
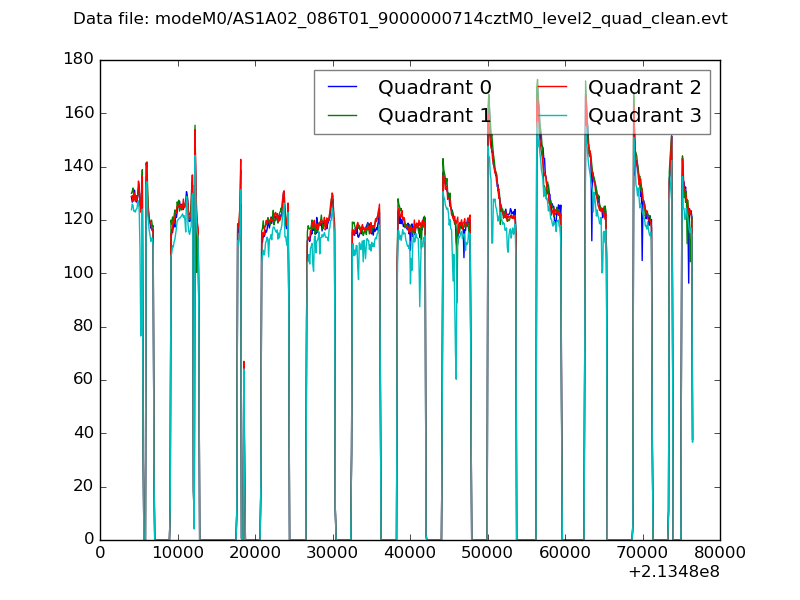 |
|
| Module-wise count rates for Quadrant A Data is divided into 100 sec bins |
 |
 |
| Module-wise count rates for Quadrant B Data is divided into 100 sec bins |
 |
 |
| Module-wise count rates for Quadrant C Data is divided into 100 sec bins |
 |
 |
| Module-wise count rates for Quadrant D Data is divided into 100 sec bins |
 |
 |
| Parameter | Plot |
|---|---|
| CZT HV Monitor |  |
| D_VDD | 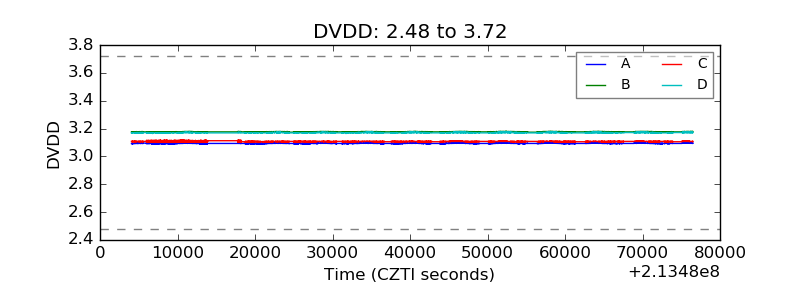 |
| Temperature 1 |  |
| Veto HV Monitor |  |
| Veto LLD |  |
| Alpha Counter |  |
| _CPM_Rate | 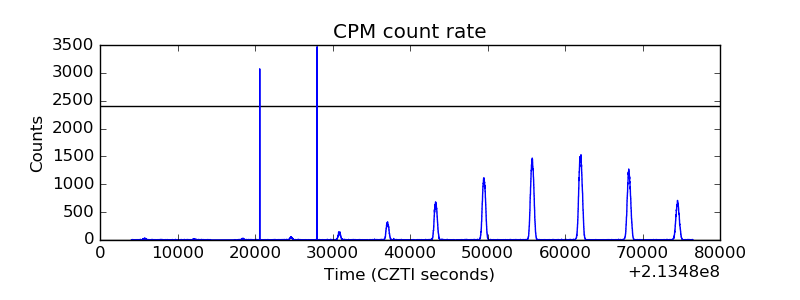 |
| CZT Counter |  |
| +2.5 Volts monitor |  |
| +5 Volts monitor |  |
| _ROLL_ROT |  |
| _Roll_DEC |  |
| _Roll_RA | 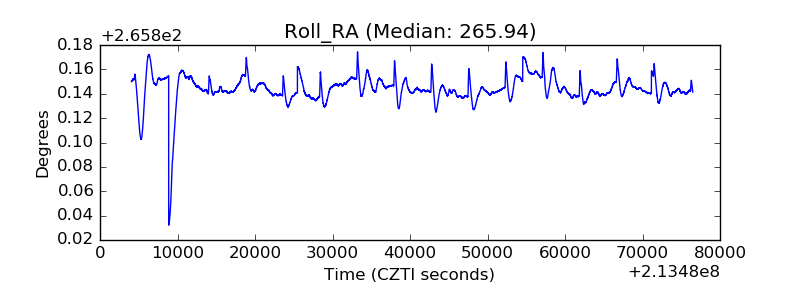 |
| Veto Counter |  |