| Param | Original file | Final file |
|---|---|---|
| Filename | modeM0/AS1A02_086T01_9000000714_05547cztM0_level2.evt | modeM0/AS1A02_086T01_9000000714_05547cztM0_level2_quad_clean.evt |
| Size (bytes) | 228,104,640 | 43,989,120 |
| Size | 217.5 MB | 42.0 MB |
| Events in quadrant A | 1,483,024 | 281,863 |
| Events in quadrant B | 1,653,000 | 283,212 |
| Events in quadrant C | 1,465,418 | 281,787 |
| Events in quadrant D | 2,094,681 | 264,682 |
| Mode M9 | |||
|---|---|---|---|
| Quadrant | BADHDUFLAG | Total packets | Discarded packets |
| A | 0 | 4 | 0 |
| B | 0 | 4 | 0 |
| C | 0 | 4 | 0 |
| D | 0 | 4 | 0 |
| Mode M0 | |||
|---|---|---|---|
| Quadrant | BADHDUFLAG | Total packets | Discarded packets |
| A | 0 | 6466 | 2 |
| B | 0 | 6883 | 1 |
| C | 0 | 6477 | 1 |
| D | 0 | 8391 | 1 |
| Mode SS | |||
|---|---|---|---|
| Quadrant | BADHDUFLAG | Total packets | Discarded packets |
| A | 0 | 64 | 0 |
| B | 0 | 64 | 0 |
| C | 0 | 64 | 0 |
| D | 0 | 64 | 0 |
| Quadrant | Total seconds | Saturated seconds | Saturation percentage |
|---|---|---|---|
| A | 3092 | 36 | 1.164295% |
| B | 3092 | 67 | 2.166882% |
| C | 3092 | 18 | 0.582147% |
| D | 3092 | 209 | 6.759379% |
Noise dominated data is calculated using 1-second bins in cleaned event files. If a bin has >2000 counts, and if more than 50% of those come from <1% of pixels, then it is considered to be noise-dominated and hence unusable.
| Quadrant | # 1 sec bins | Bins with >0 counts | Bins with >2000 counts | High rate bins dominated by noise | Noise dominated (total time) | Noise dominated (detector-on time) | Marked lightcurve |
|---|---|---|---|---|---|---|---|
| A | 3472 | 3093 | 0 | 0 | 0.00% | 0.00% | 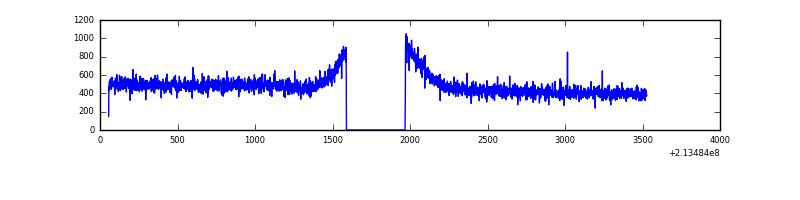 |
| B | 3472 | 3093 | 1 | 1 | 0.03% | 0.03% | 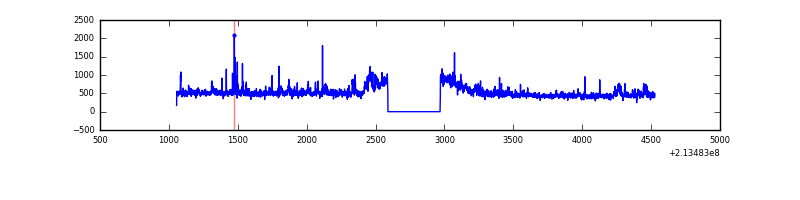 |
| C | 3472 | 3093 | 0 | 0 | 0.00% | 0.00% | 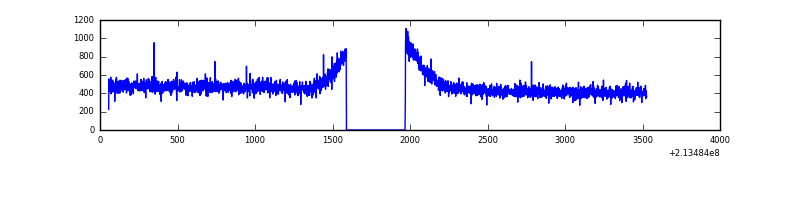 |
| D | 3472 | 3093 | 136 | 136 | 3.92% | 4.40% | 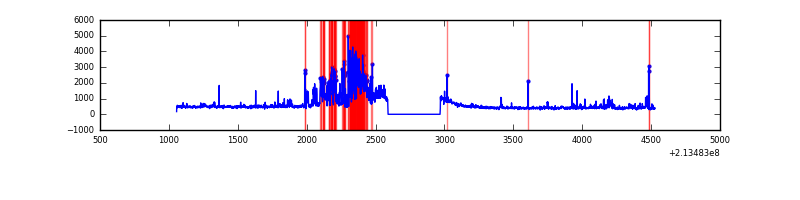 |
Top three noisy pixels from each quadrant. If the there are fewer than three noisy pixels in the level2.evt file, extra rows are filled as -1
| Pixel properties | Quadrant properties | ||||||
|---|---|---|---|---|---|---|---|
| Quadrant | DetID | PixID | Counts | Sigma | Mean | Median | Sigma |
| A | 12 | 194 | 3774 | 41.64 | 385 | 375 | 81.6 |
| A | 0 | 226 | 3769 | 41.58 | 385 | 375 | 81.6 |
| A | 13 | 14 | 1422 | 12.83 | 385 | 375 | 81.6 |
| B | 15 | 204 | 110586 | 1414.97 | 386 | 376 | 77.9 |
| B | 10 | 246 | 28293 | 358.42 | 386 | 376 | 77.9 |
| B | 12 | 111 | 7196 | 87.56 | 386 | 376 | 77.9 |
| C | 1 | 16 | 7523 | 81.26 | 371 | 373 | 88.0 |
| C | 8 | 128 | 5380 | 56.9 | 371 | 373 | 88.0 |
| C | 13 | 61 | 3032 | 30.22 | 371 | 373 | 88.0 |
| D | 2 | 152 | 685110 | 7530.5 | 364 | 353 | 90.9 |
| D | 2 | 206 | 15202 | 163.3 | 364 | 353 | 90.9 |
| D | 8 | 195 | 12772 | 136.58 | 364 | 353 | 90.9 |
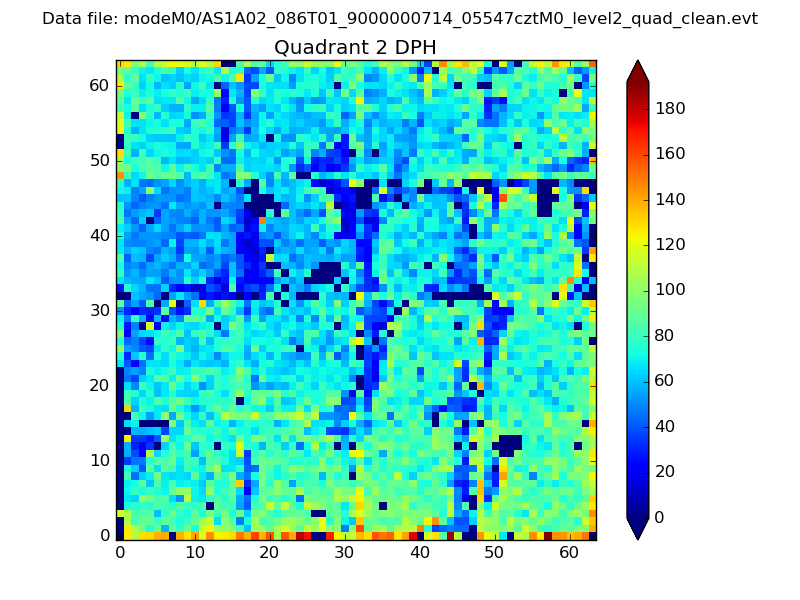
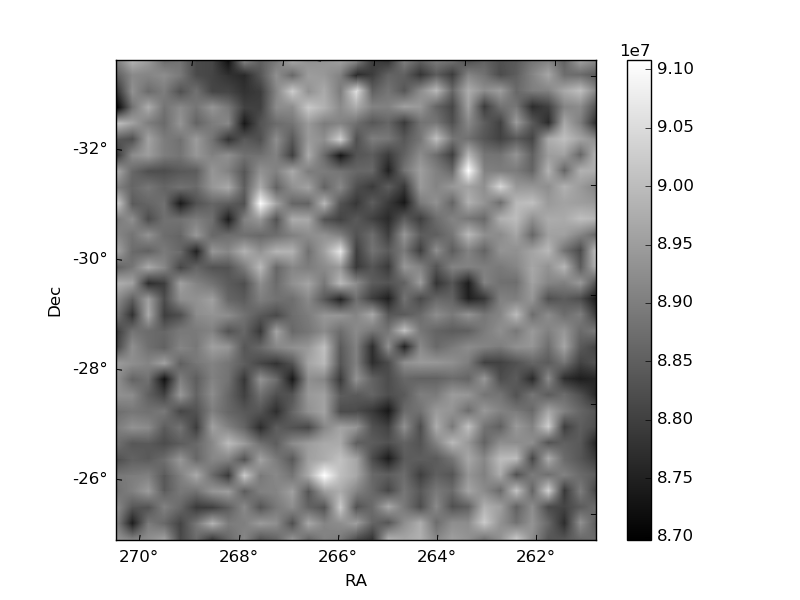
Histogram calculated using DETX and DETY for each event in the final _common_clean file
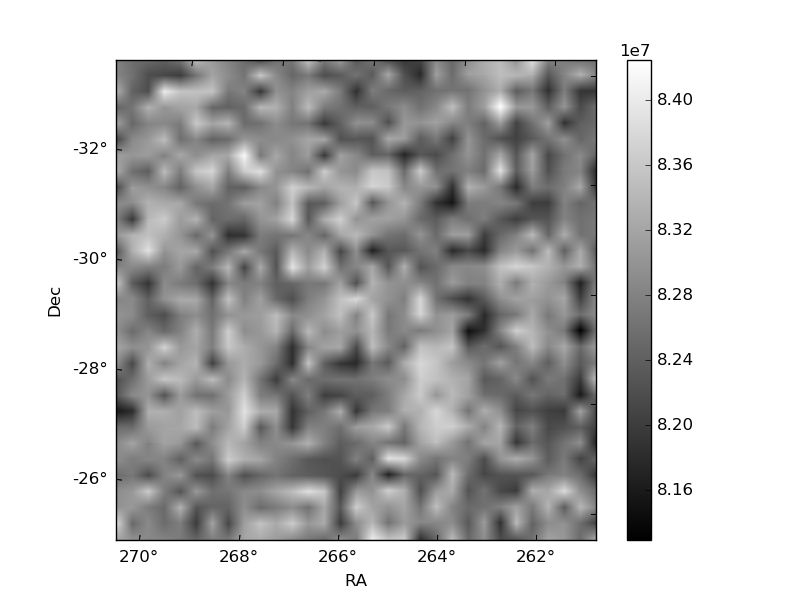
| Quadrant A | 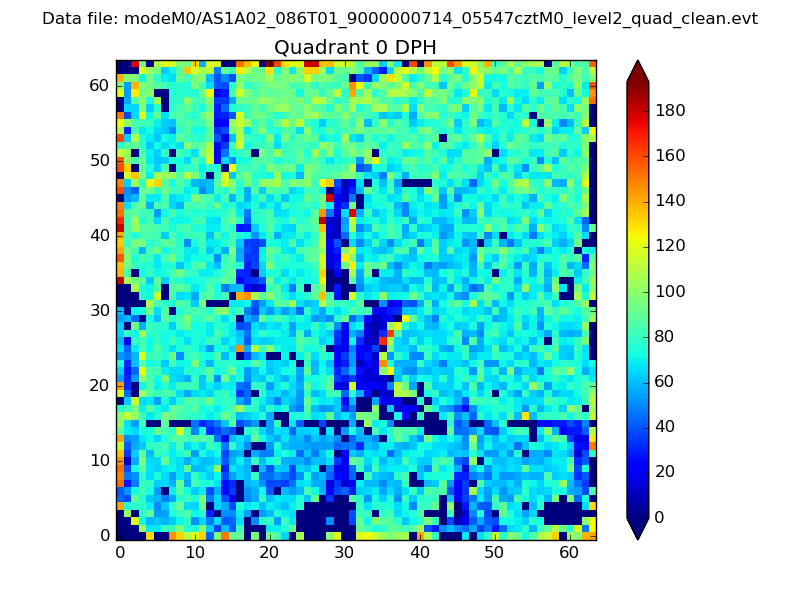 |
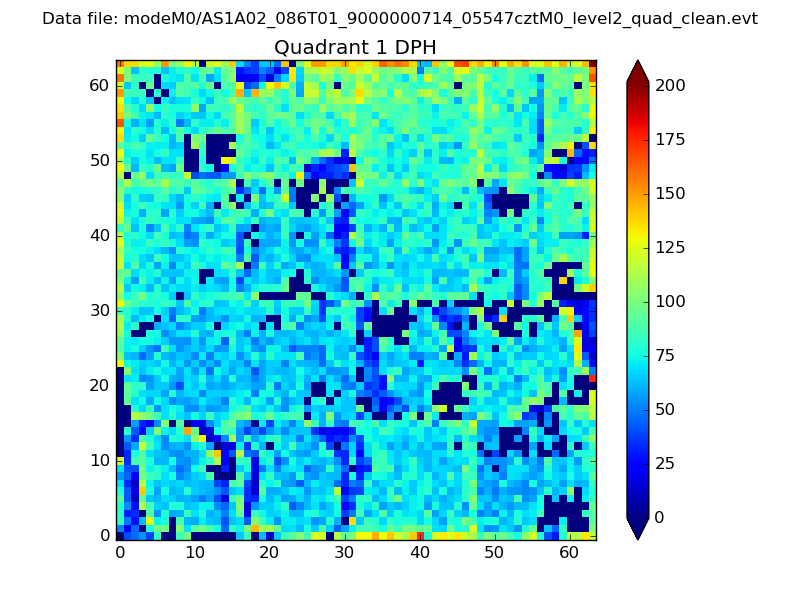 |
Quadrant B |
|---|---|---|---|
| Quadrant D | 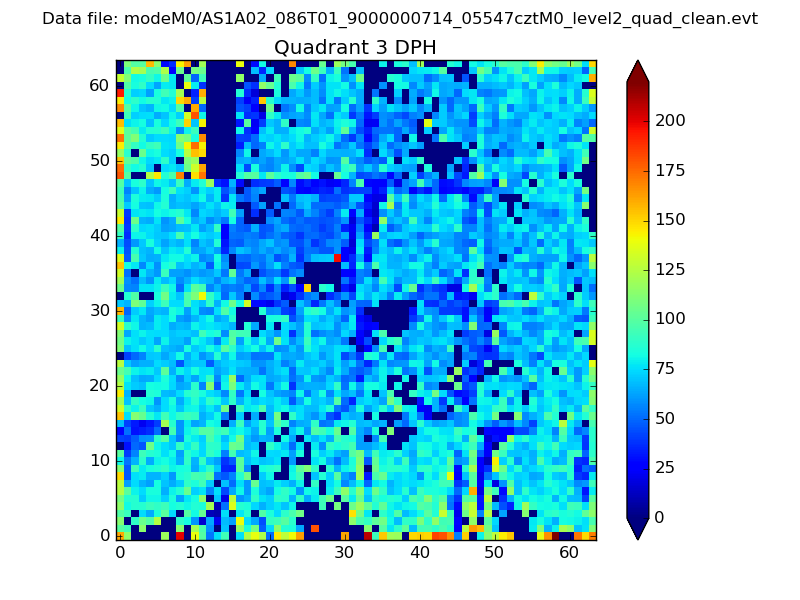 |
 |
Quadrant C |
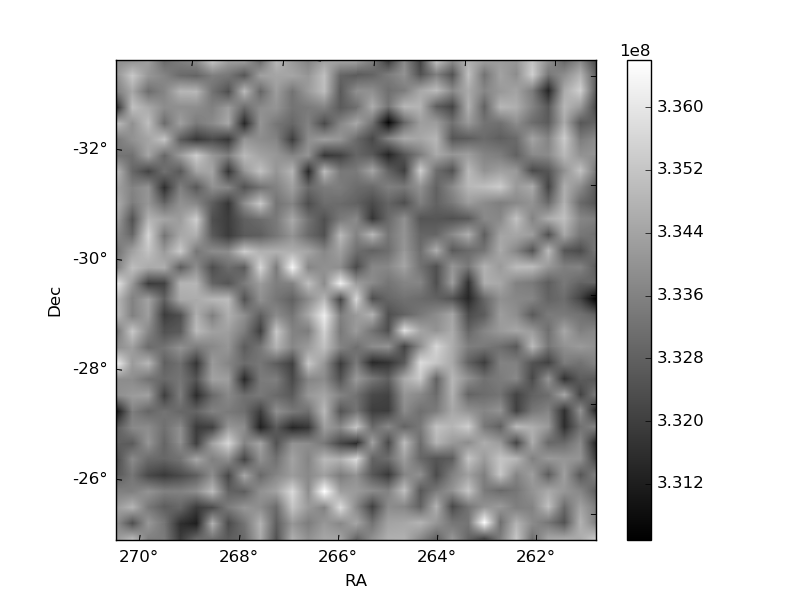
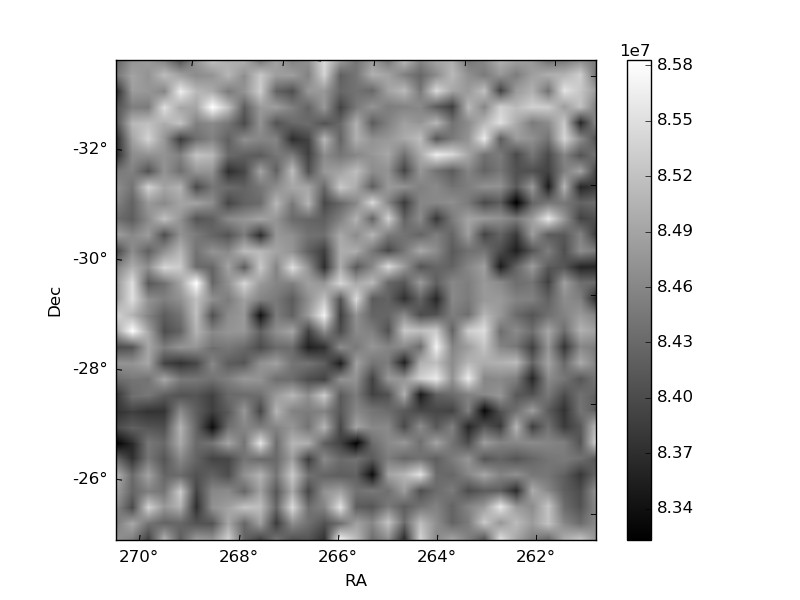
| Plot type | Count rate plots | Images |
|---|---|---|
| Comparison with Poisson distribution Blue bars denote a histogram of data divided into 1 sec bins. Red curve is a Poisson curve with rate = median count rate of data. |
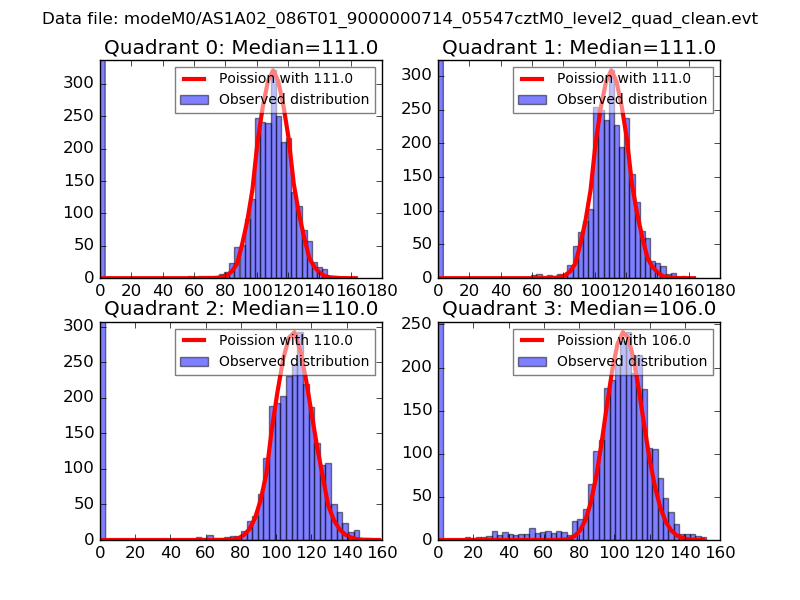 |
 |
| Quadrant-wise count rates Data is divided into 100 sec bins |
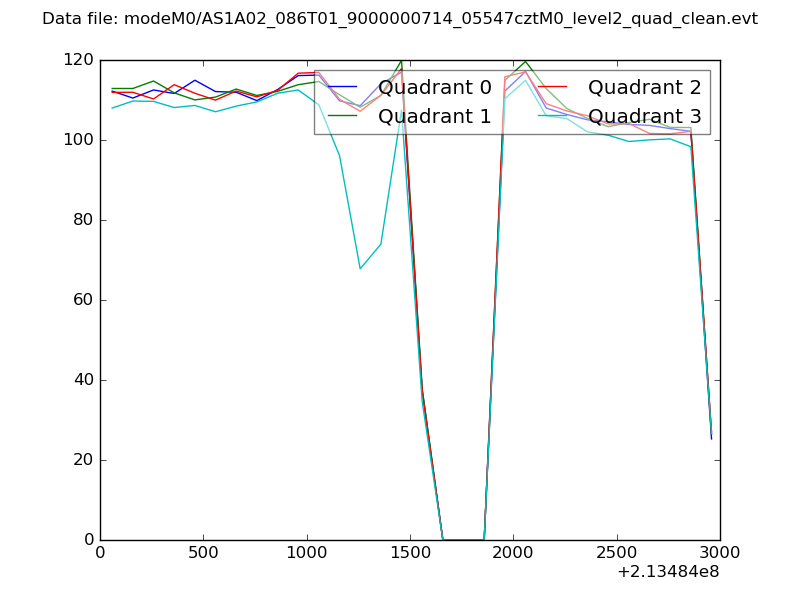 |
|
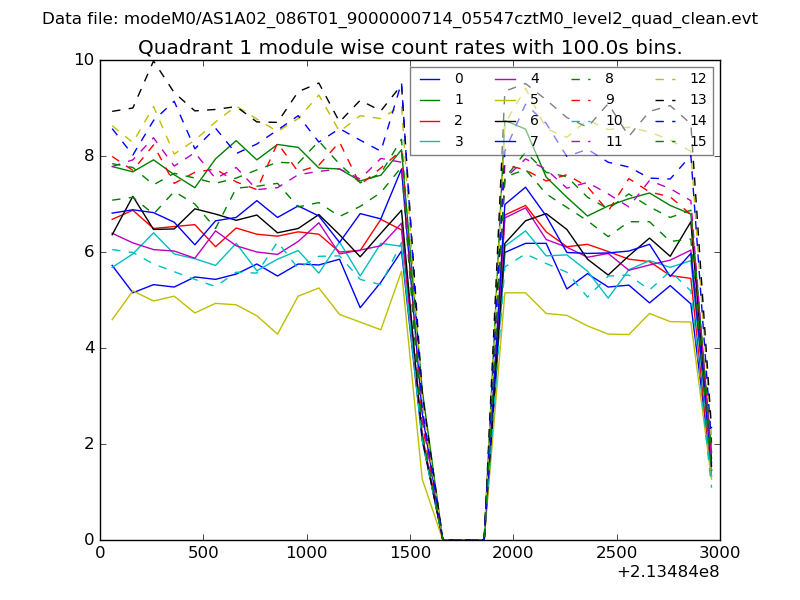
| Module-wise count rates for Quadrant A Data is divided into 100 sec bins |
 |
 |
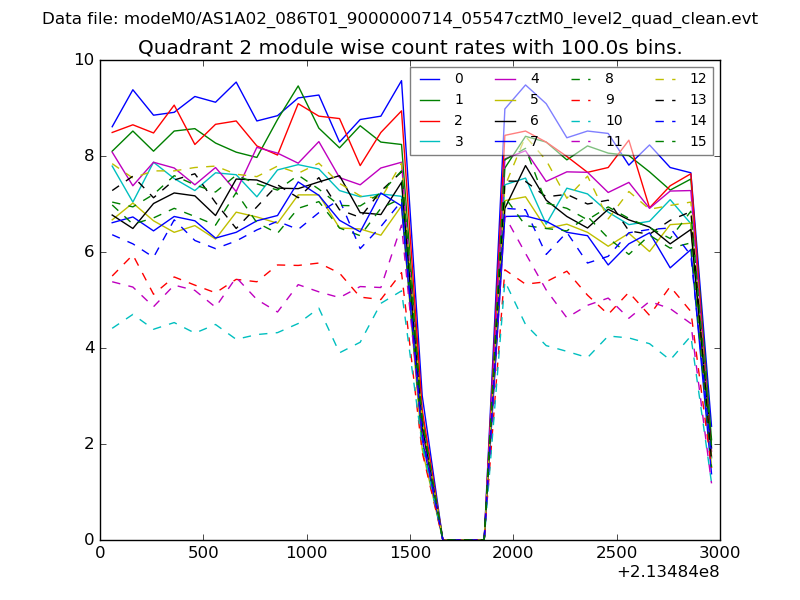
| Module-wise count rates for Quadrant B Data is divided into 100 sec bins |
 |
 |
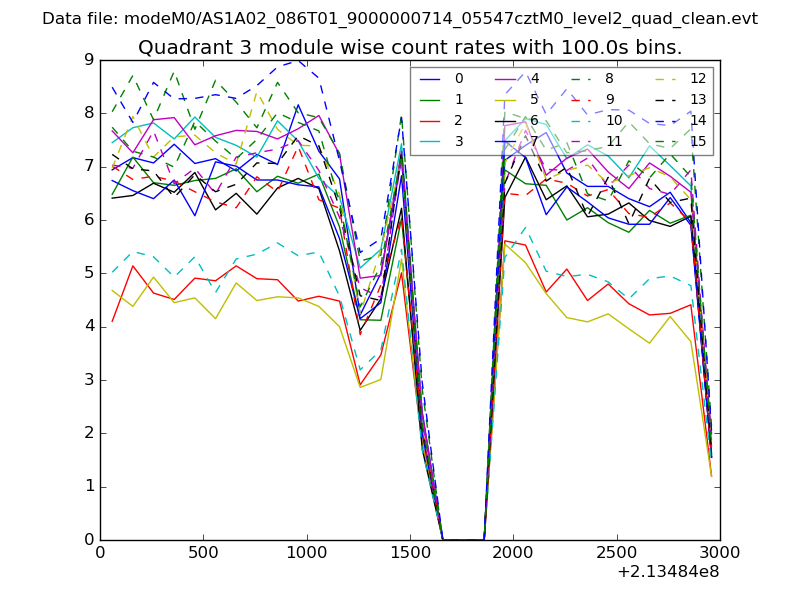
| Module-wise count rates for Quadrant C Data is divided into 100 sec bins |
 |
 |
| Module-wise count rates for Quadrant D Data is divided into 100 sec bins |
 |
 |
| Parameter | Plot |
|---|---|
| CZT HV Monitor | 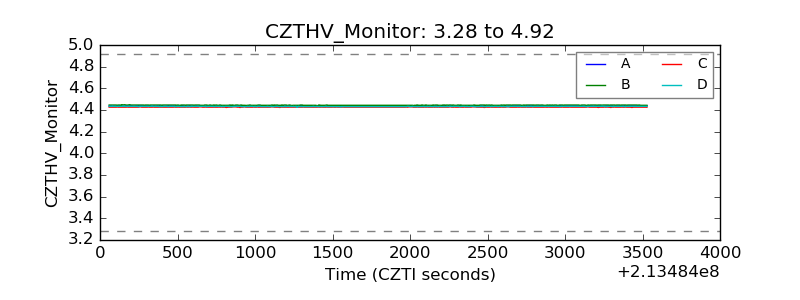 |
| D_VDD | 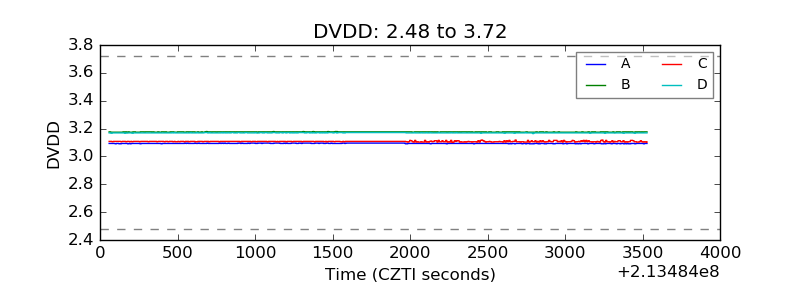 |
| Temperature 1 | 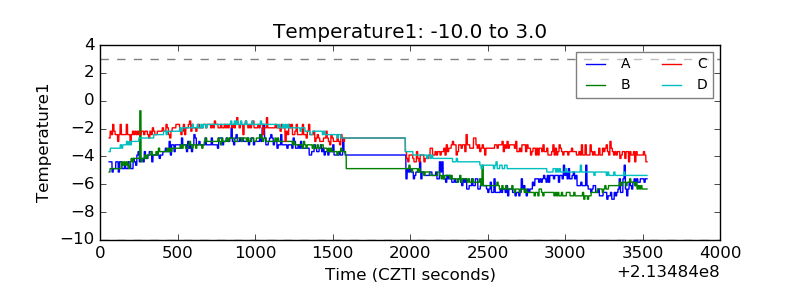 |
| Veto HV Monitor | 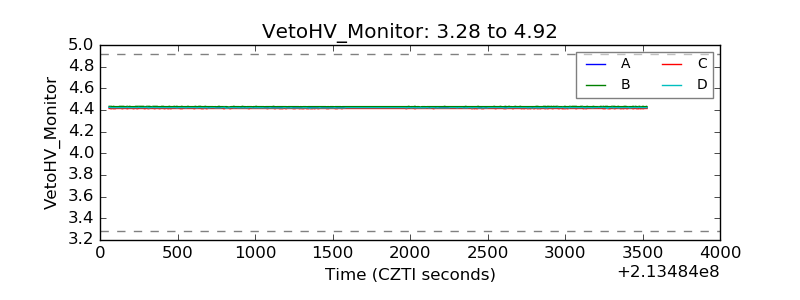 |
| Veto LLD | 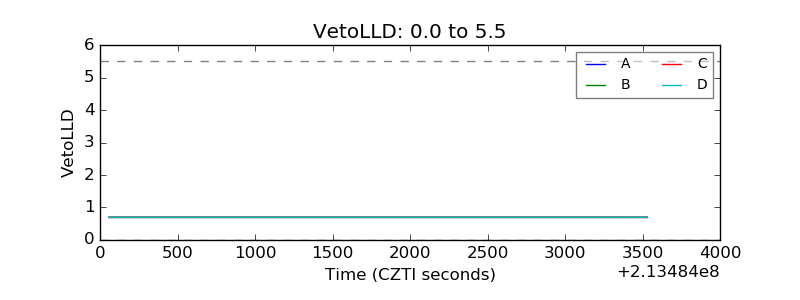 |
| Alpha Counter | 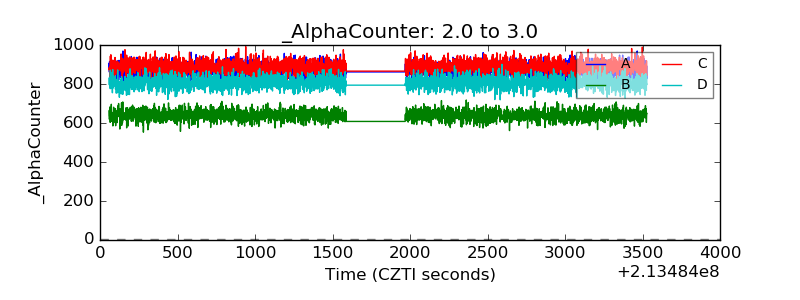 |
| _CPM_Rate | 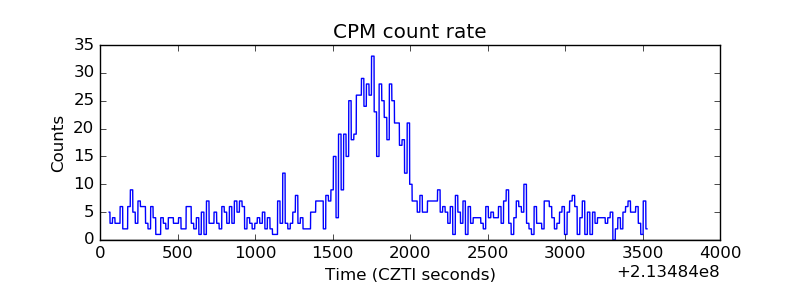 |
| CZT Counter | 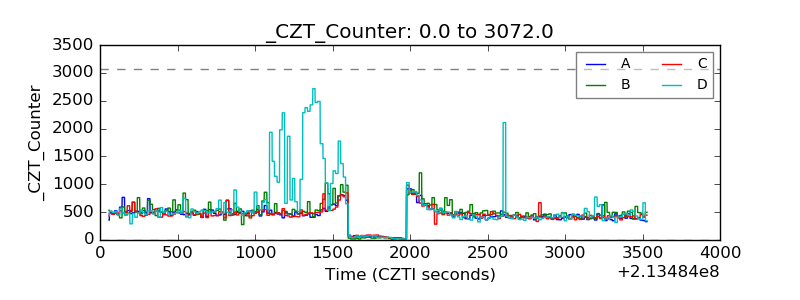 |
| +2.5 Volts monitor |  |
| +5 Volts monitor |  |
| _ROLL_ROT | 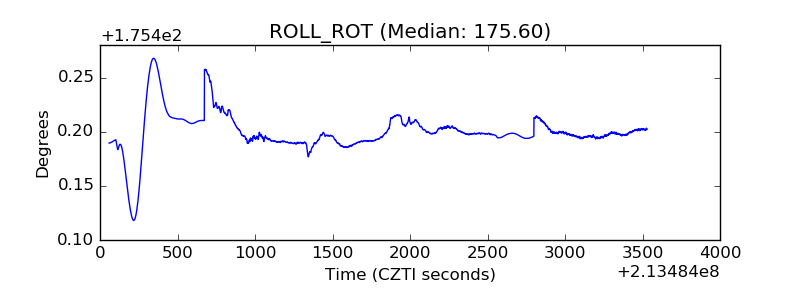 |
| _Roll_DEC | 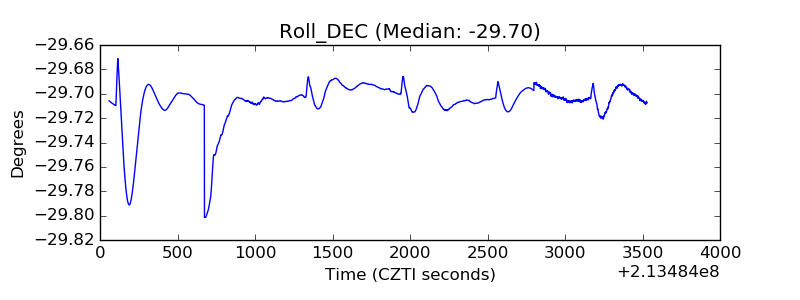 |
| _Roll_RA | 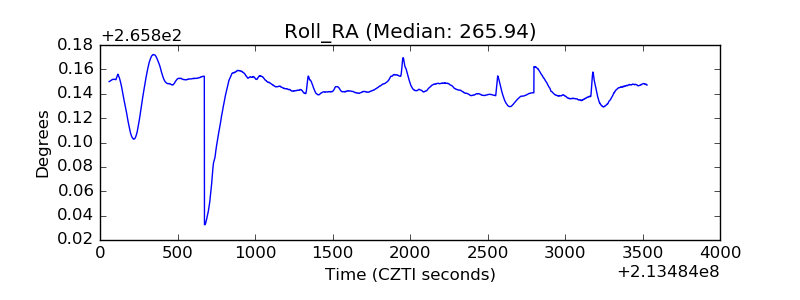 |
| Veto Counter | 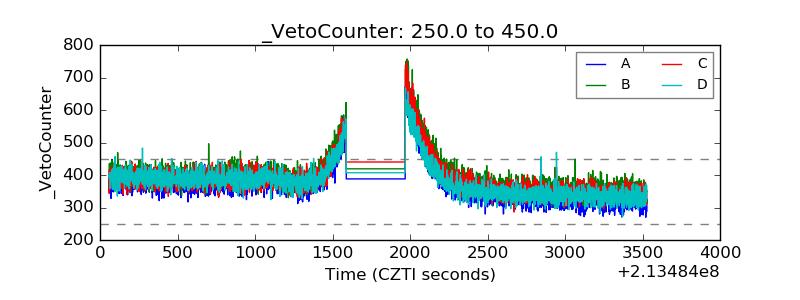 |