| Param | Original file | Final file |
|---|---|---|
| Filename | modeM0/AS1A02_086T01_9000000714_05556cztM0_level2.evt | modeM0/AS1A02_086T01_9000000714_05556cztM0_level2_quad_clean.evt |
| Size (bytes) | 1,361,580,480 | 224,138,880 |
| Size | 1.3 GB | 213.8 MB |
| Events in quadrant A | 9,163,307 | 1,365,551 |
| Events in quadrant B | 10,545,673 | 1,371,743 |
| Events in quadrant C | 8,895,806 | 1,375,671 |
| Events in quadrant D | 11,282,269 | 1,301,571 |
| Mode M9 | |||
|---|---|---|---|
| Quadrant | BADHDUFLAG | Total packets | Discarded packets |
| A | 0 | 24 | 0 |
| B | 0 | 24 | 0 |
| C | 0 | 24 | 0 |
| D | 0 | 24 | 0 |
| Mode M0 | |||
|---|---|---|---|
| Quadrant | BADHDUFLAG | Total packets | Discarded packets |
| A | 0 | 41137 | 5 |
| B | 0 | 43949 | 4 |
| C | 0 | 40769 | 4 |
| D | 0 | 47287 | 4 |
| Mode SS | |||
|---|---|---|---|
| Quadrant | BADHDUFLAG | Total packets | Discarded packets |
| A | 0 | 406 | 0 |
| B | 0 | 406 | 0 |
| C | 0 | 406 | 0 |
| D | 0 | 406 | 0 |
| Quadrant | Total seconds | Saturated seconds | Saturation percentage |
|---|---|---|---|
| A | 19949 | 267 | 1.338413% |
| B | 19949 | 325 | 1.629154% |
| C | 19949 | 220 | 1.102812% |
| D | 19949 | 455 | 2.280816% |
Noise dominated data is calculated using 1-second bins in cleaned event files. If a bin has >2000 counts, and if more than 50% of those come from <1% of pixels, then it is considered to be noise-dominated and hence unusable.
| Quadrant | # 1 sec bins | Bins with >0 counts | Bins with >2000 counts | High rate bins dominated by noise | Noise dominated (total time) | Noise dominated (detector-on time) | Marked lightcurve |
|---|---|---|---|---|---|---|---|
| A | 22274 | 19953 | 18 | 18 | 0.08% | 0.09% | 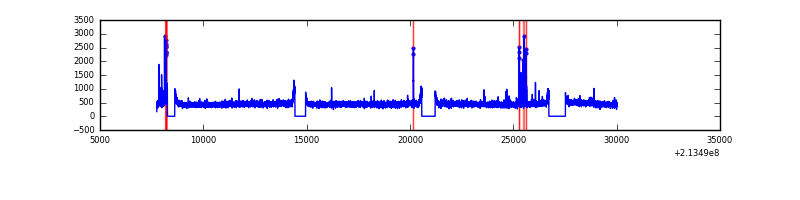 |
| B | 22274 | 19953 | 25 | 25 | 0.11% | 0.13% | 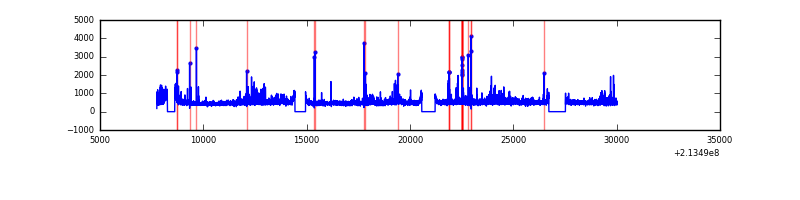 |
| C | 22274 | 19953 | 0 | 0 | 0.00% | 0.00% | 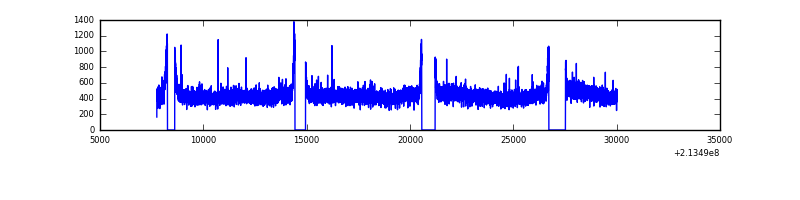 |
| D | 22274 | 19953 | 165 | 165 | 0.74% | 0.83% | 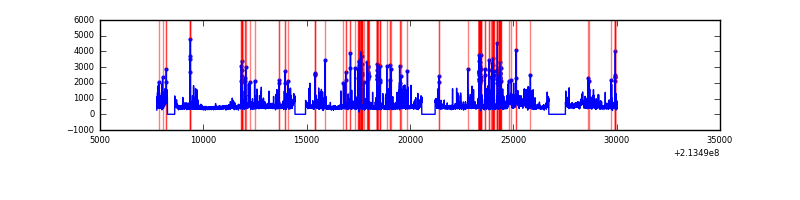 |
Top three noisy pixels from each quadrant. If the there are fewer than three noisy pixels in the level2.evt file, extra rows are filled as -1
| Pixel properties | Quadrant properties | ||||||
|---|---|---|---|---|---|---|---|
| Quadrant | DetID | PixID | Counts | Sigma | Mean | Median | Sigma |
| A | 0 | 50 | 130019 | 267.55 | 2332 | 2276 | 477.5 |
| A | 15 | 174 | 39770 | 78.53 | 2332 | 2276 | 477.5 |
| A | 0 | 226 | 23159 | 43.74 | 2332 | 2276 | 477.5 |
| B | 15 | 204 | 913392 | 2019.27 | 2353 | 2293 | 451.2 |
| B | 11 | 51 | 150408 | 328.27 | 2353 | 2293 | 451.2 |
| B | 0 | 182 | 97336 | 210.64 | 2353 | 2293 | 451.2 |
| C | 1 | 16 | 39003 | 70.0 | 2266 | 2278 | 524.6 |
| C | 13 | 61 | 18347 | 30.63 | 2266 | 2278 | 524.6 |
| C | 12 | 4 | 11342 | 17.28 | 2266 | 2278 | 524.6 |
| D | 2 | 63 | 801674 | 1443.74 | 2256 | 2186 | 553.8 |
| D | 2 | 136 | 499369 | 897.83 | 2256 | 2186 | 553.8 |
| D | 2 | 152 | 436143 | 783.65 | 2256 | 2186 | 553.8 |
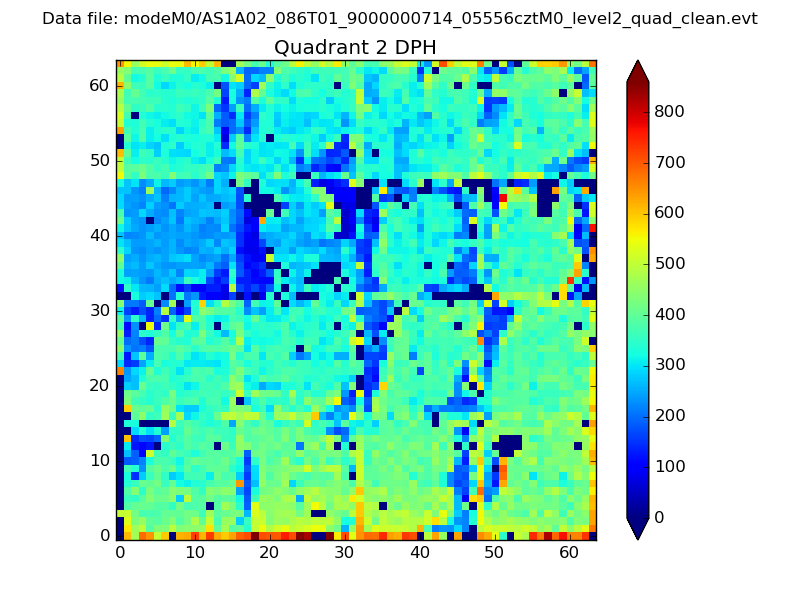
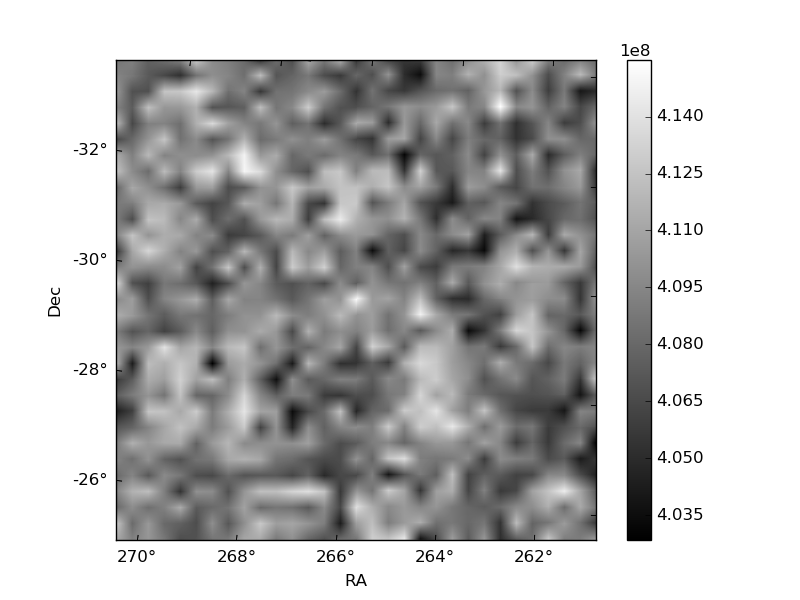
Histogram calculated using DETX and DETY for each event in the final _common_clean file
| Quadrant A | 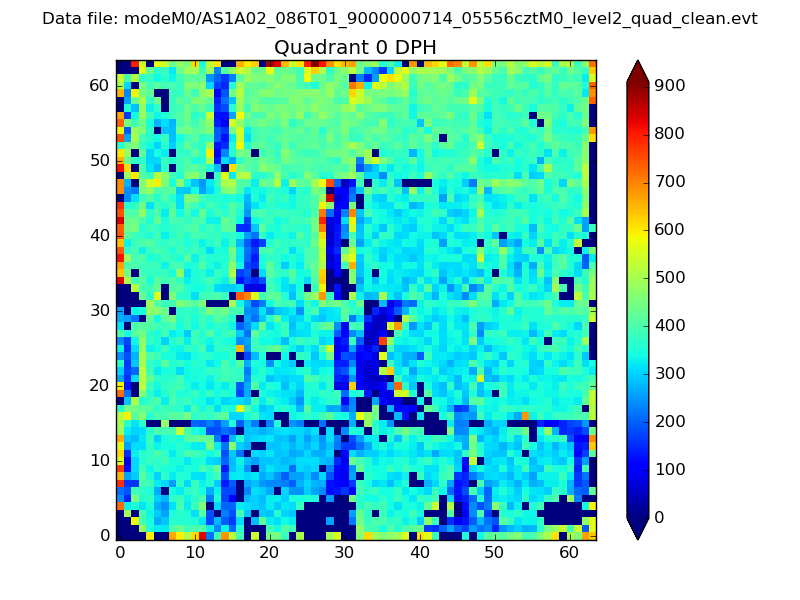 |
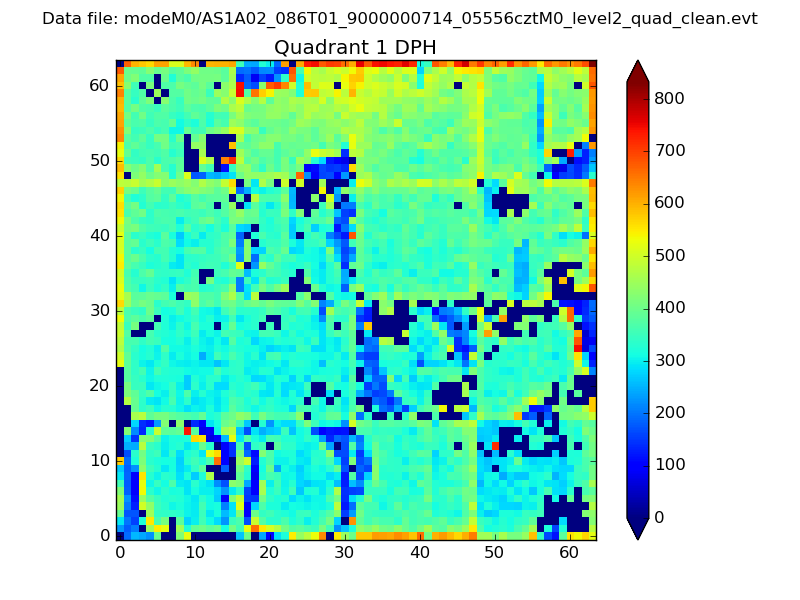 |
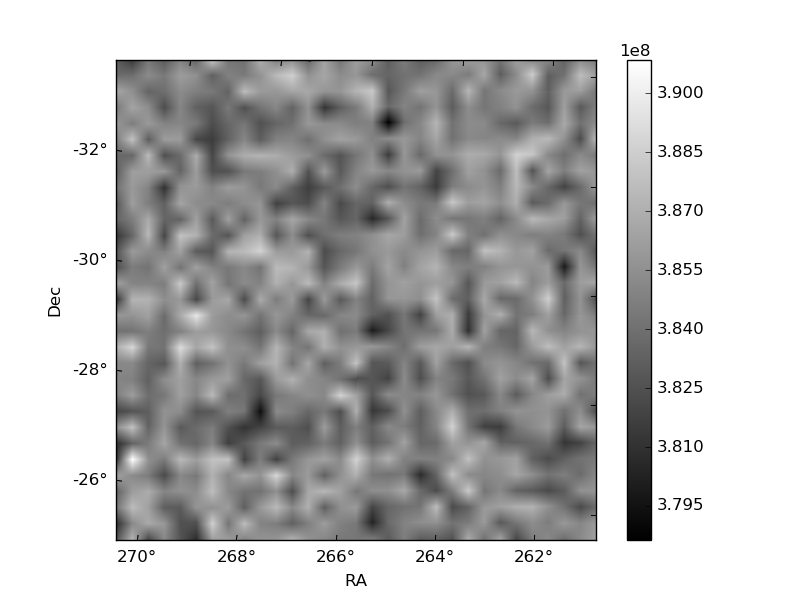
Quadrant B |
|---|---|---|---|
| Quadrant D | 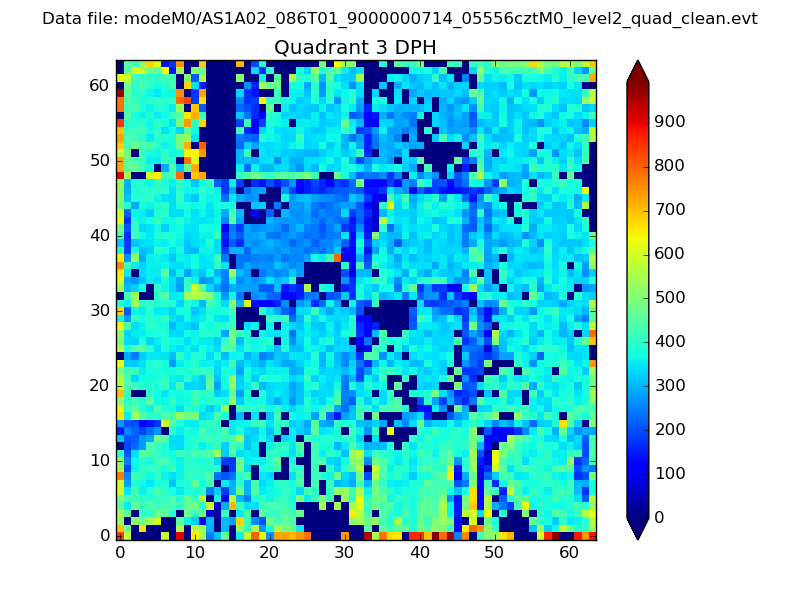 |
 |
Quadrant C |
| Plot type | Count rate plots | Images |
|---|---|---|
| Comparison with Poisson distribution Blue bars denote a histogram of data divided into 1 sec bins. Red curve is a Poisson curve with rate = median count rate of data. |
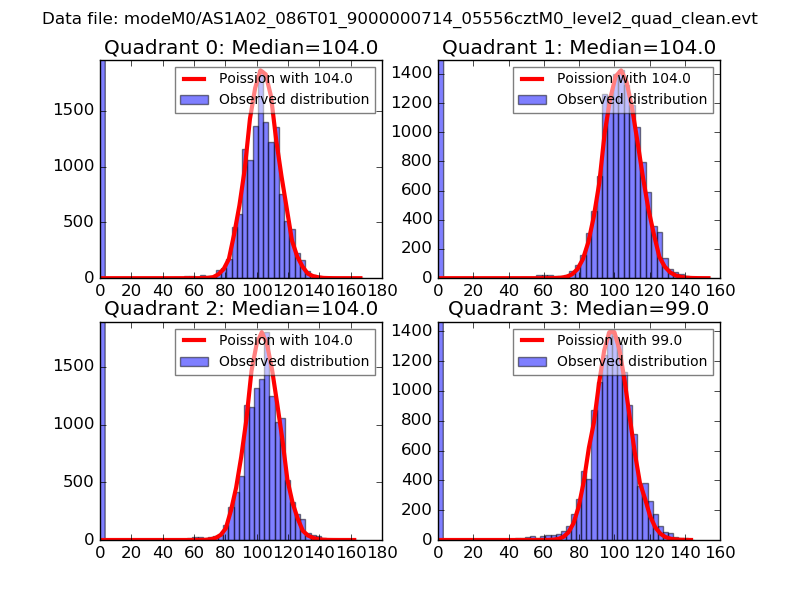 |
 |
| Quadrant-wise count rates Data is divided into 100 sec bins |
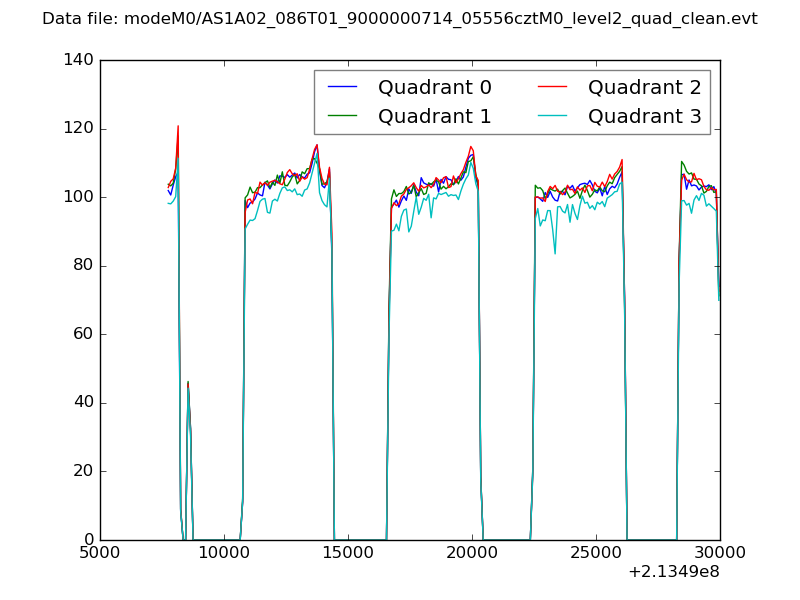 |
|
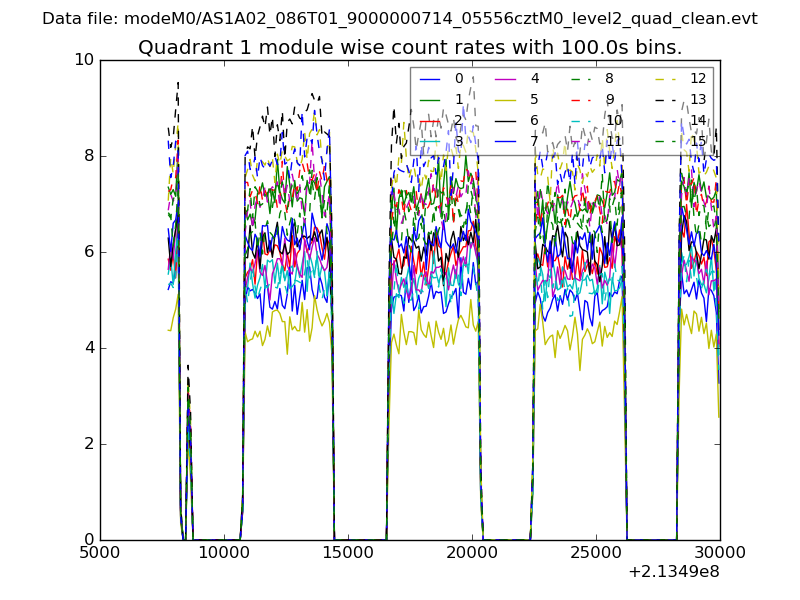
| Module-wise count rates for Quadrant A Data is divided into 100 sec bins |
 |
 |
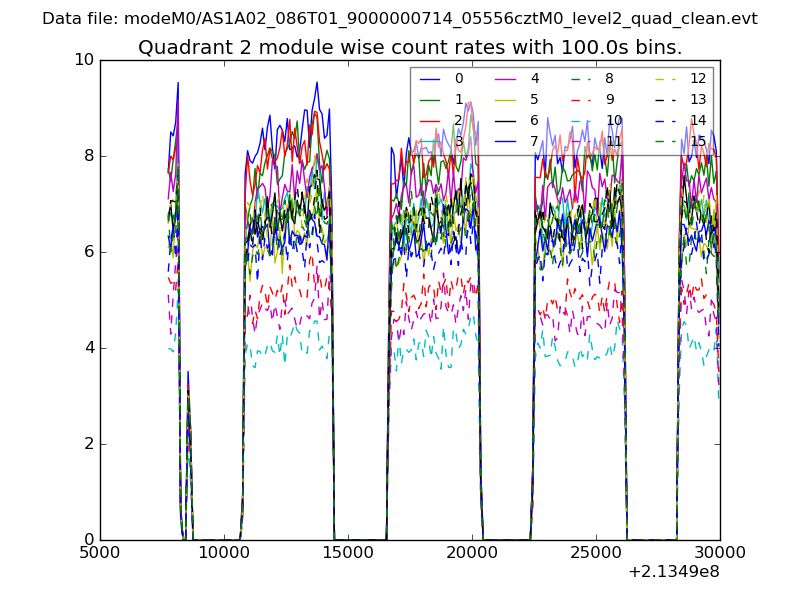
| Module-wise count rates for Quadrant B Data is divided into 100 sec bins |
 |
 |
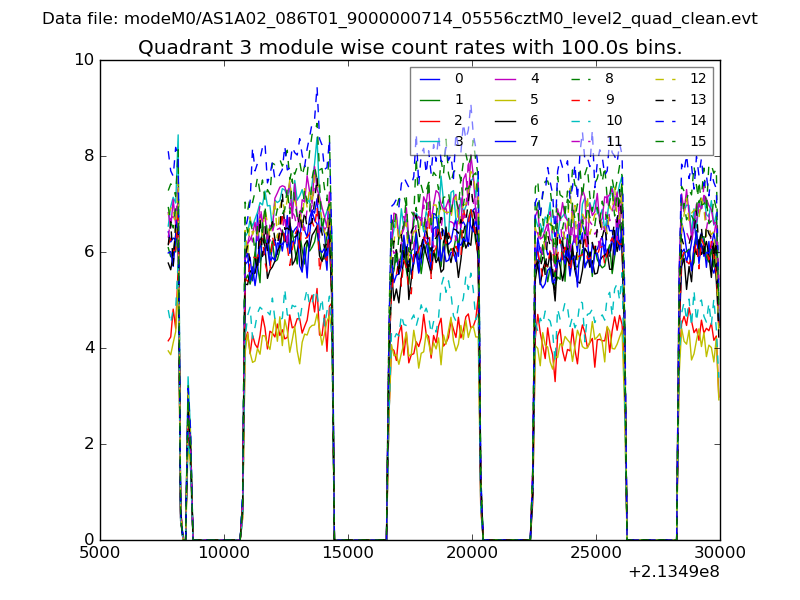
| Module-wise count rates for Quadrant C Data is divided into 100 sec bins |
 |
 |
| Module-wise count rates for Quadrant D Data is divided into 100 sec bins |
 |
 |
| Parameter | Plot |
|---|---|
| CZT HV Monitor | 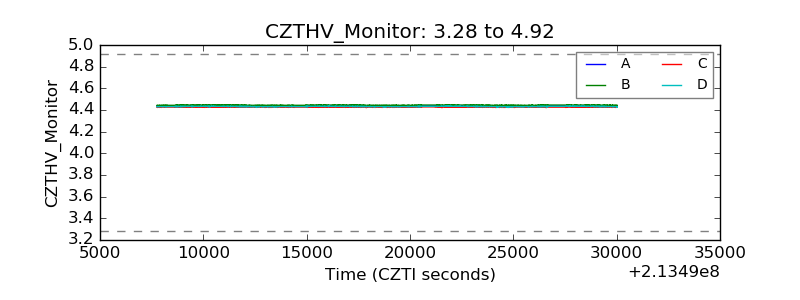 |
| D_VDD | 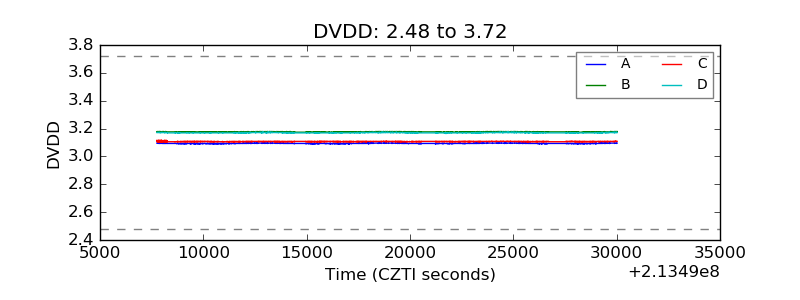 |
| Temperature 1 | 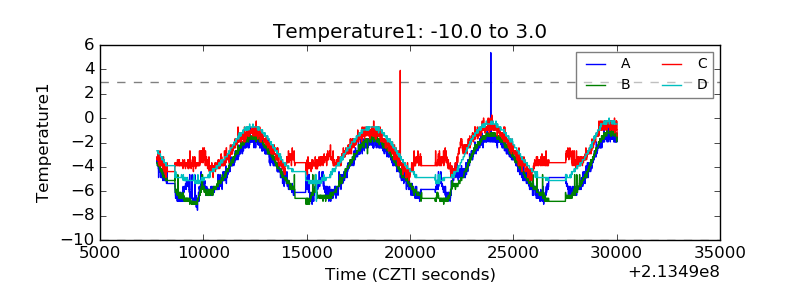 |
| Veto HV Monitor | 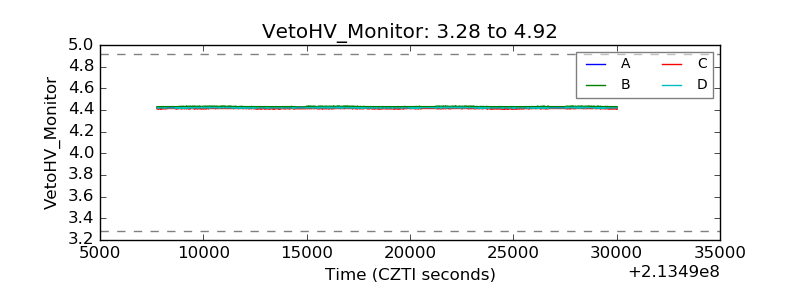 |
| Veto LLD | 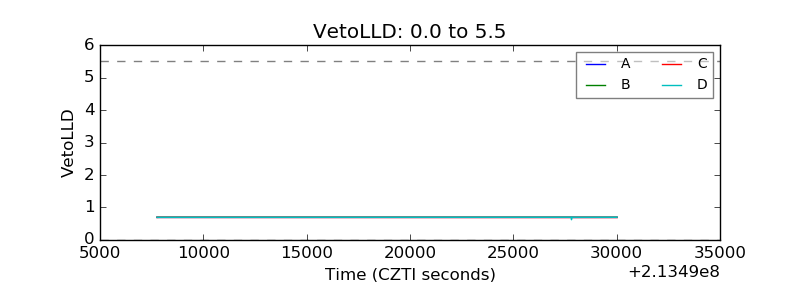 |
| Alpha Counter | 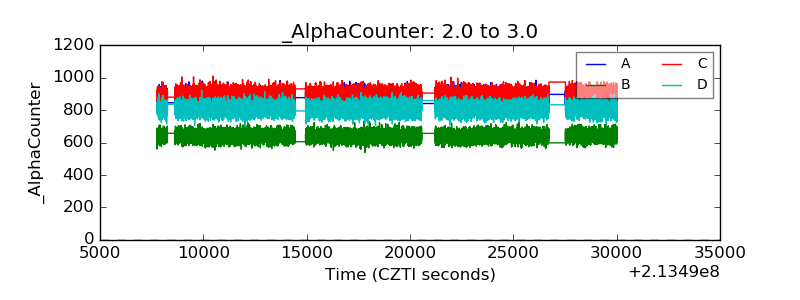 |
| _CPM_Rate | 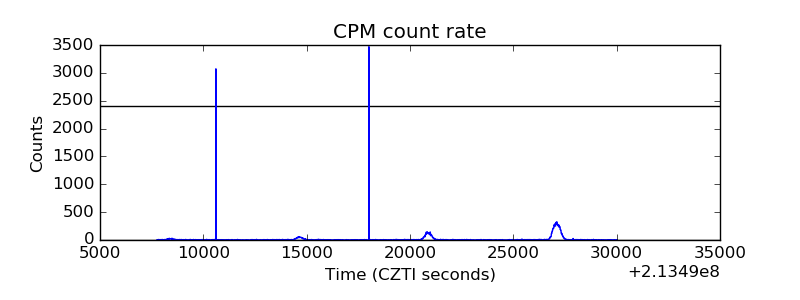 |
| CZT Counter | 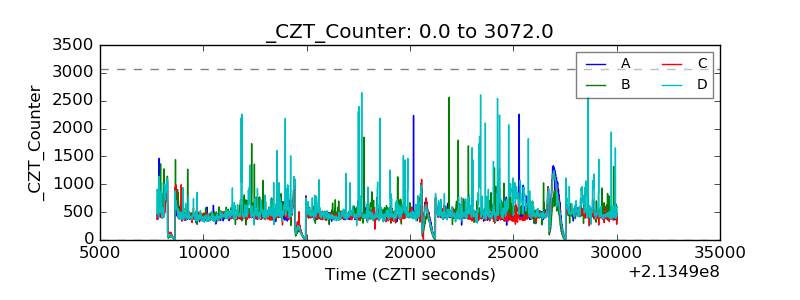 |
| +2.5 Volts monitor | 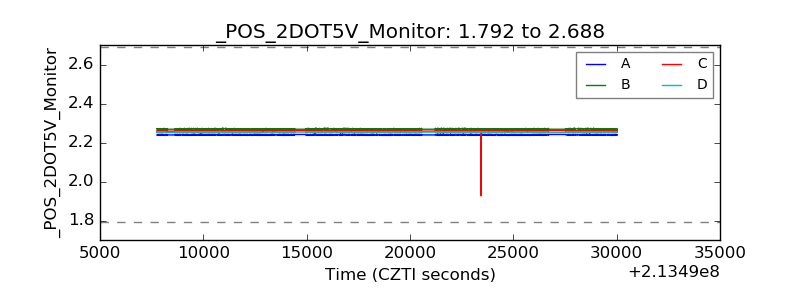 |
| +5 Volts monitor |  |
| _ROLL_ROT | 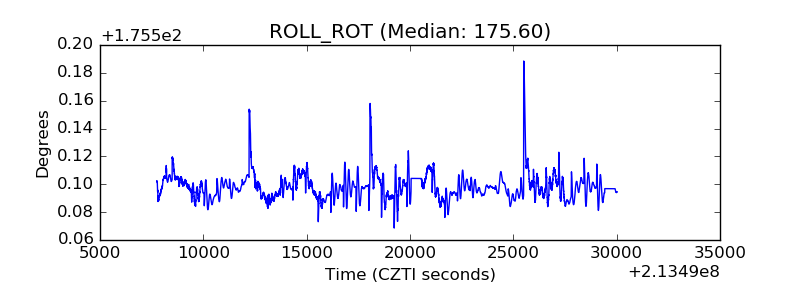 |
| _Roll_DEC | 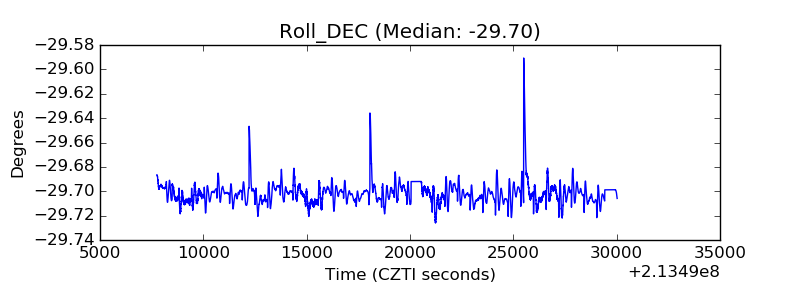 |
| _Roll_RA |  |
| Veto Counter | 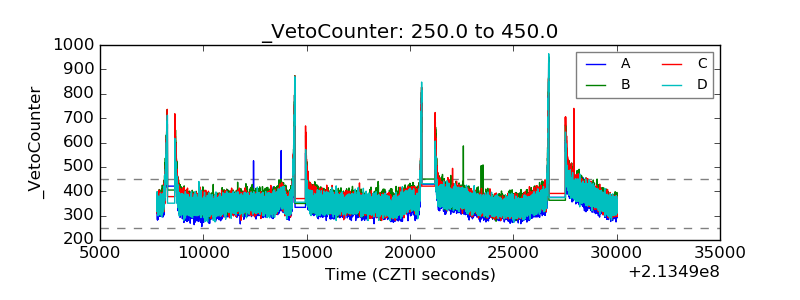 |