| Param | Original file | Final file |
|---|---|---|
| Filename | modeM0/AS1A02_086T01_9000000714_05557cztM0_level2.evt | modeM0/AS1A02_086T01_9000000714_05557cztM0_level2_quad_clean.evt |
| Size (bytes) | 1,542,905,280 | 255,960,000 |
| Size | 1.4 GB | 244.1 MB |
| Events in quadrant A | 10,194,584 | 1,627,390 |
| Events in quadrant B | 12,586,621 | 1,614,768 |
| Events in quadrant C | 9,129,614 | 1,621,522 |
| Events in quadrant D | 13,474,867 | 1,519,601 |
| Mode M9 | |||
|---|---|---|---|
| Quadrant | BADHDUFLAG | Total packets | Discarded packets |
| A | 0 | 44 | 0 |
| B | 0 | 44 | 0 |
| C | 0 | 44 | 0 |
| D | 0 | 44 | 0 |
| Mode M0 | |||
|---|---|---|---|
| Quadrant | BADHDUFLAG | Total packets | Discarded packets |
| A | 0 | 43758 | 5 |
| B | 0 | 50528 | 4 |
| C | 0 | 41043 | 4 |
| D | 0 | 53573 | 4 |
| Mode SS | |||
|---|---|---|---|
| Quadrant | BADHDUFLAG | Total packets | Discarded packets |
| A | 0 | 406 | 0 |
| B | 0 | 406 | 0 |
| C | 0 | 406 | 0 |
| D | 0 | 406 | 0 |
| Quadrant | Total seconds | Saturated seconds | Saturation percentage |
|---|---|---|---|
| A | 19871 | 461 | 2.319964% |
| B | 19871 | 595 | 2.994313% |
| C | 19871 | 181 | 0.910875% |
| D | 19871 | 1030 | 5.183433% |
Noise dominated data is calculated using 1-second bins in cleaned event files. If a bin has >2000 counts, and if more than 50% of those come from <1% of pixels, then it is considered to be noise-dominated and hence unusable.
| Quadrant | # 1 sec bins | Bins with >0 counts | Bins with >2000 counts | High rate bins dominated by noise | Noise dominated (total time) | Noise dominated (detector-on time) | Marked lightcurve |
|---|---|---|---|---|---|---|---|
| A | 24326 | 19874 | 143 | 143 | 0.59% | 0.72% | 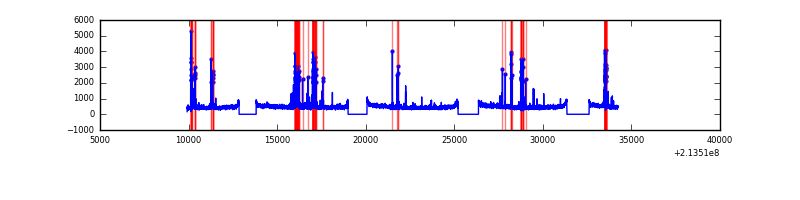 |
| B | 24326 | 19875 | 240 | 240 | 0.99% | 1.21% | 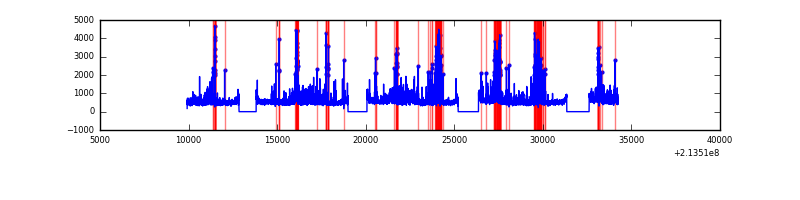 |
| C | 24326 | 19875 | 3 | 3 | 0.01% | 0.02% | 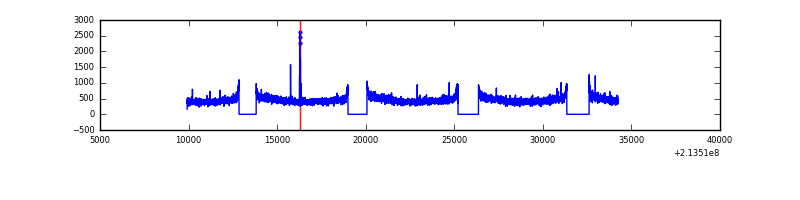 |
| D | 24326 | 19875 | 621 | 621 | 2.55% | 3.12% | 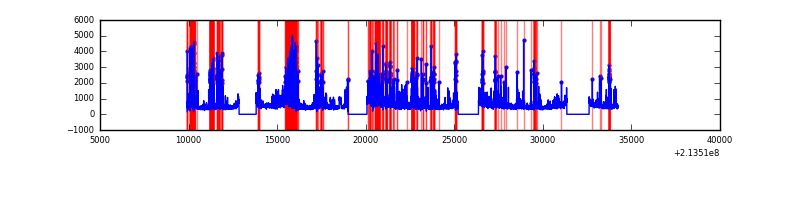 |
Top three noisy pixels from each quadrant. If the there are fewer than three noisy pixels in the level2.evt file, extra rows are filled as -1
| Pixel properties | Quadrant properties | ||||||
|---|---|---|---|---|---|---|---|
| Quadrant | DetID | PixID | Counts | Sigma | Mean | Median | Sigma |
| A | 0 | 50 | 511766 | 1049.08 | 2394 | 2346 | 485.6 |
| A | 15 | 174 | 411966 | 843.56 | 2394 | 2346 | 485.6 |
| A | 0 | 226 | 25076 | 46.81 | 2394 | 2346 | 485.6 |
| B | 15 | 204 | 1466598 | 3228.98 | 2394 | 2339 | 453.5 |
| B | 10 | 16 | 1182031 | 2601.45 | 2394 | 2339 | 453.5 |
| B | 11 | 51 | 150358 | 326.41 | 2394 | 2339 | 453.5 |
| C | 1 | 16 | 83874 | 154.73 | 2297 | 2307 | 527.1 |
| C | 9 | 16 | 28734 | 50.13 | 2297 | 2307 | 527.1 |
| C | 5 | 250 | 21200 | 35.84 | 2297 | 2307 | 527.1 |
| D | 2 | 63 | 2006966 | 3650.86 | 2278 | 2208 | 549.1 |
| D | 2 | 152 | 1067449 | 1939.91 | 2278 | 2208 | 549.1 |
| D | 2 | 33 | 430029 | 779.1 | 2278 | 2208 | 549.1 |
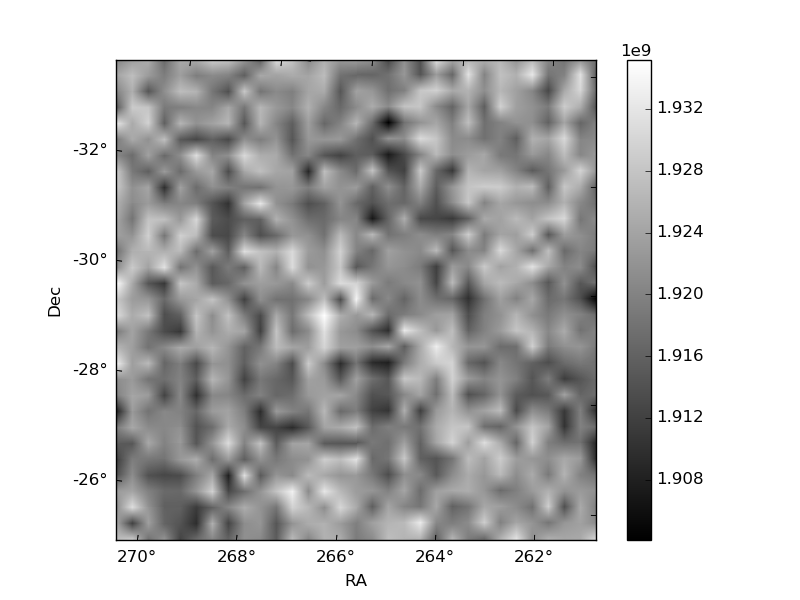
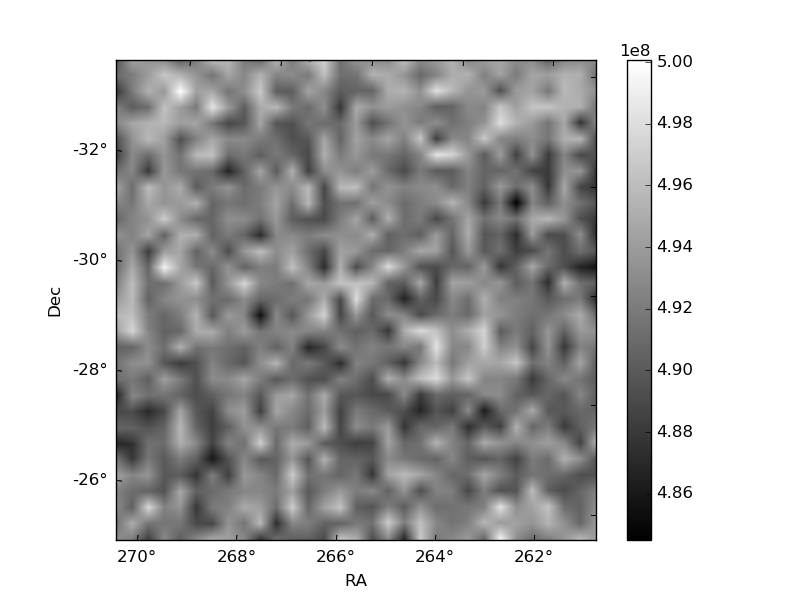
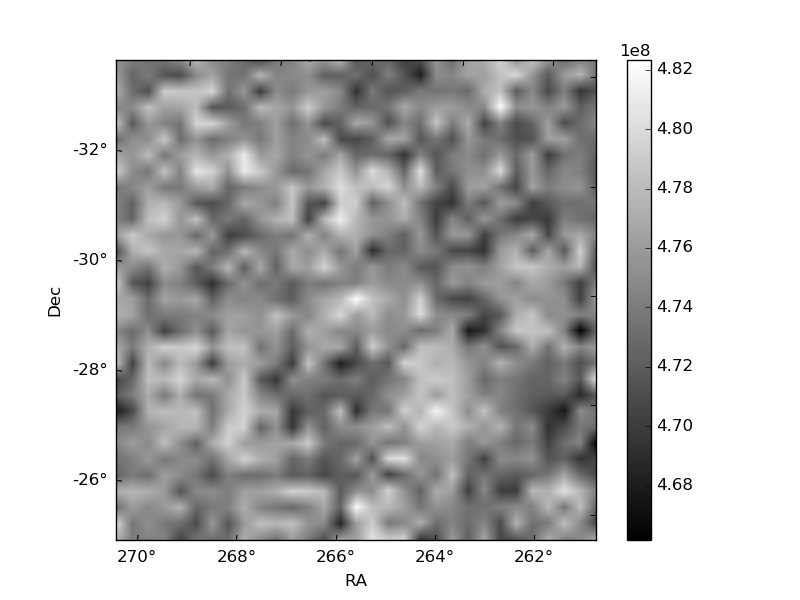
Histogram calculated using DETX and DETY for each event in the final _common_clean file
| Quadrant A | 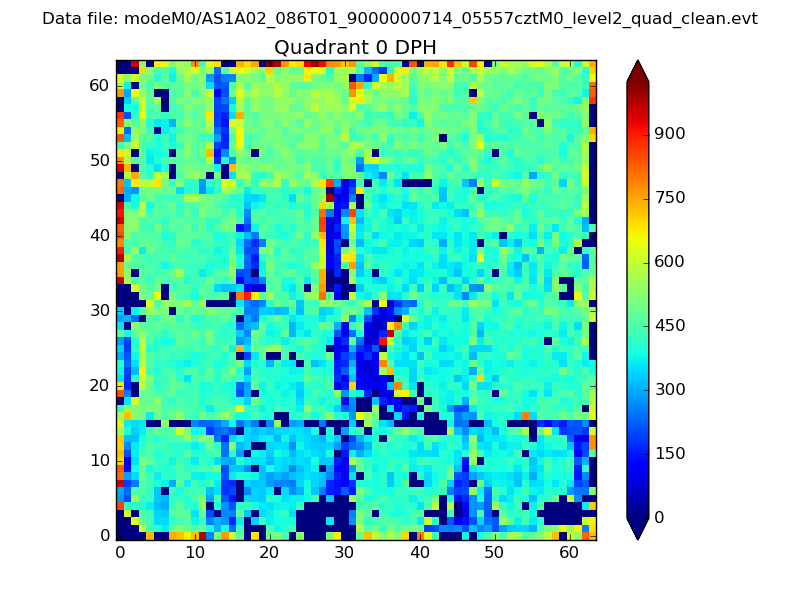 |
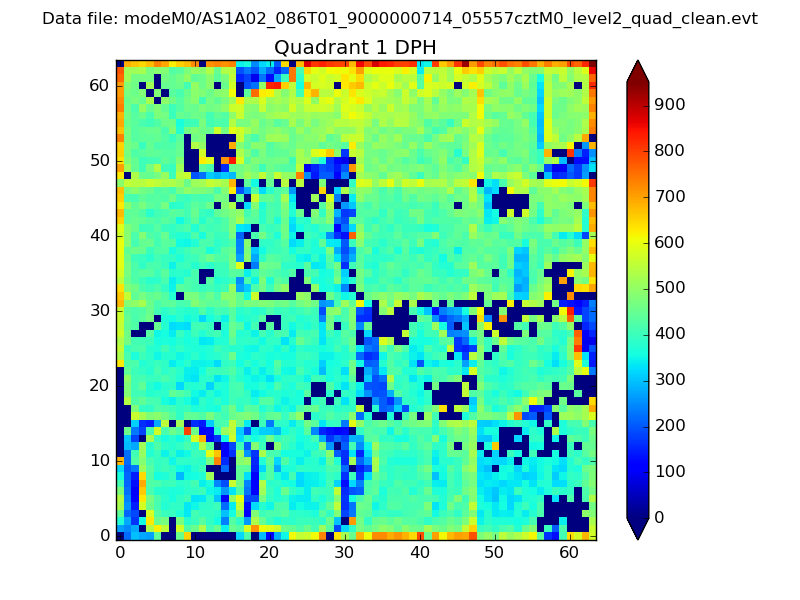 |
Quadrant B |
|---|---|---|---|
| Quadrant D | 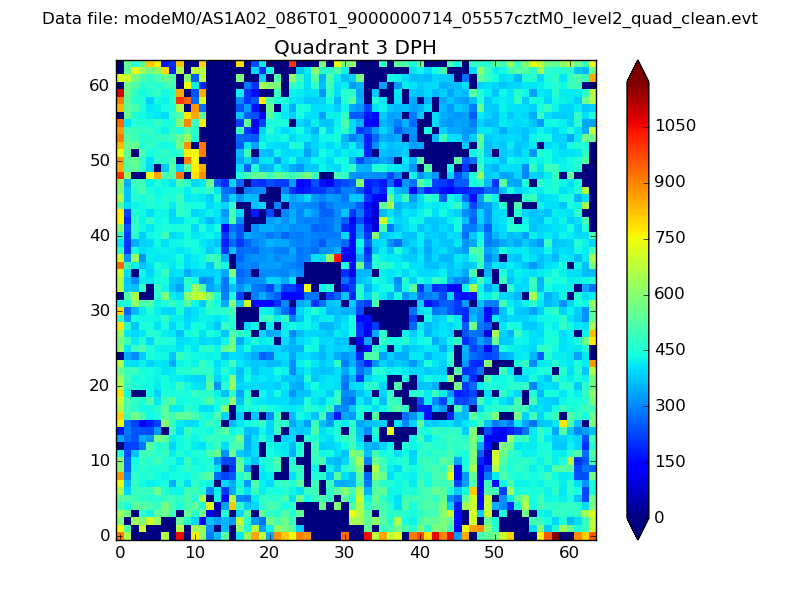 |
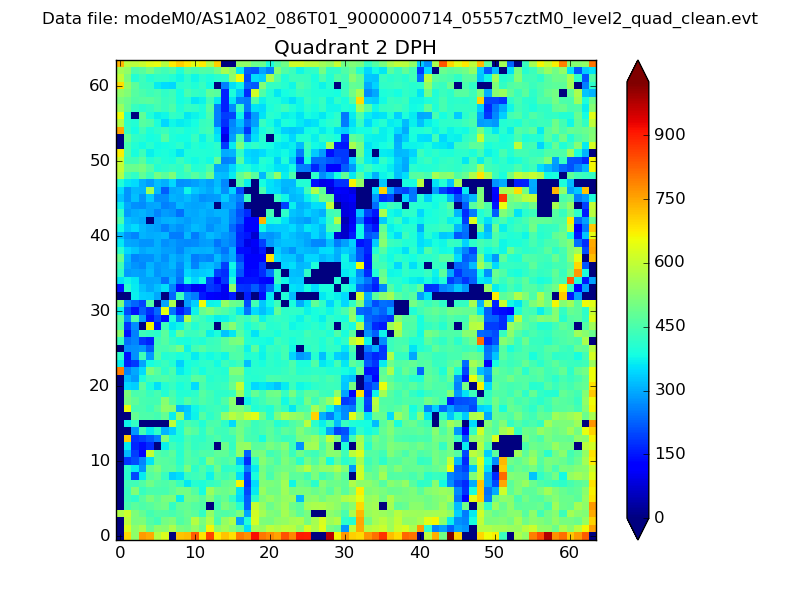 |
Quadrant C |
| Plot type | Count rate plots | Images |
|---|---|---|
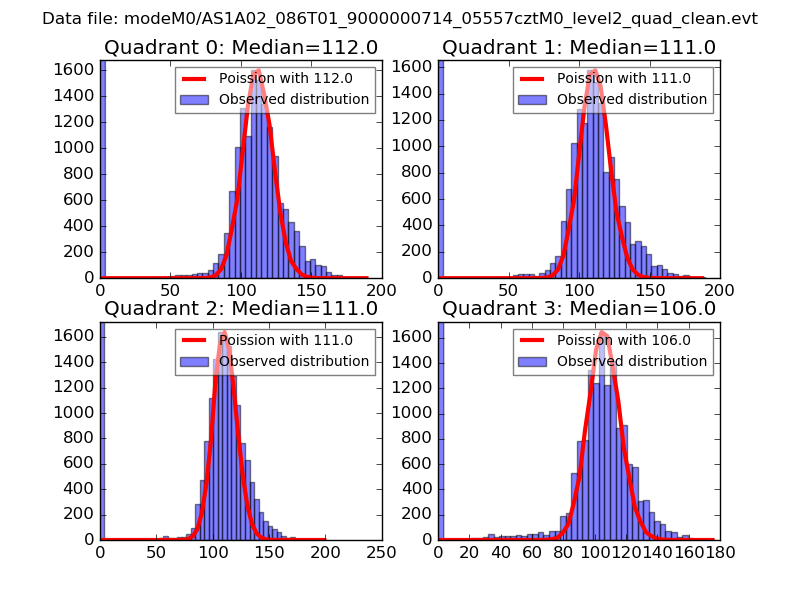
| Comparison with Poisson distribution Blue bars denote a histogram of data divided into 1 sec bins. Red curve is a Poisson curve with rate = median count rate of data. |
 |
 |
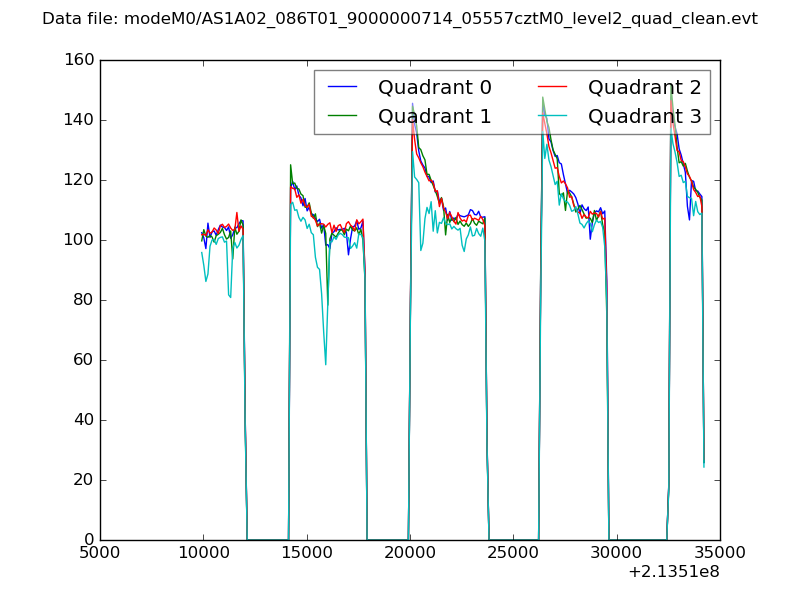
| Quadrant-wise count rates Data is divided into 100 sec bins |
 |
|
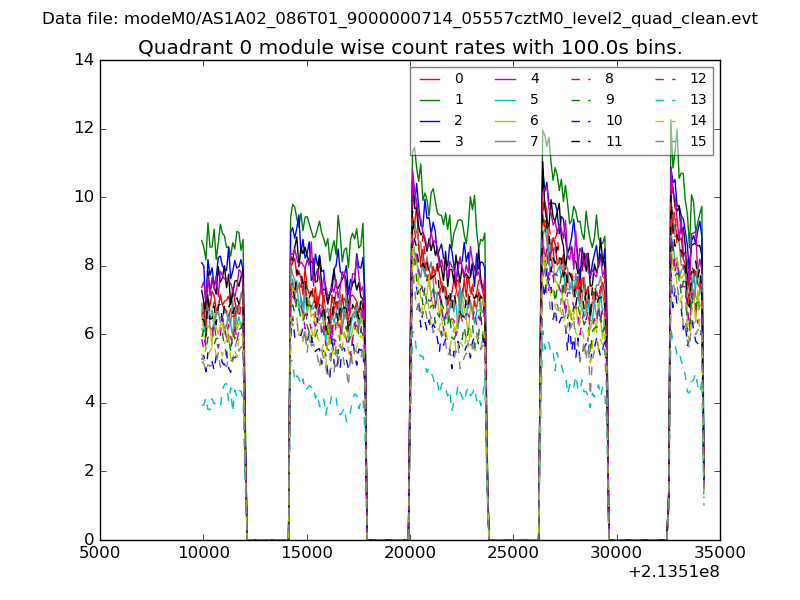
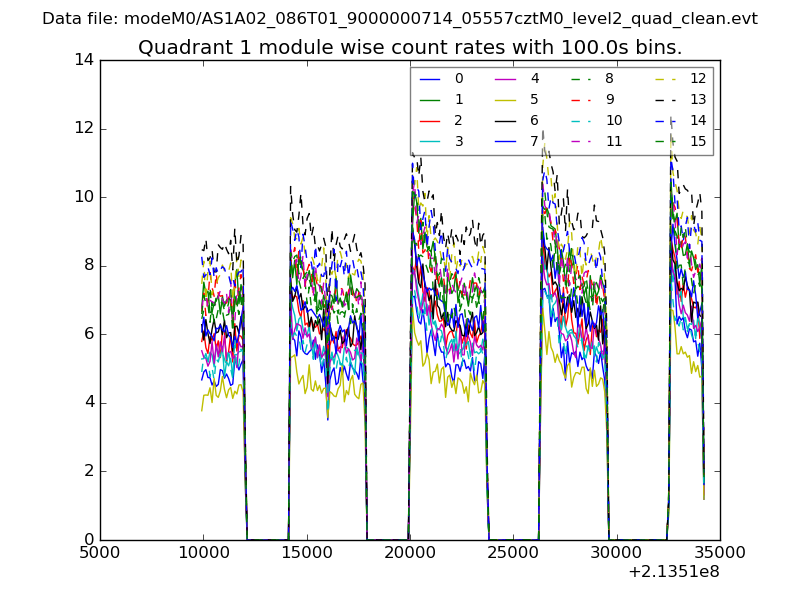
| Module-wise count rates for Quadrant A Data is divided into 100 sec bins |
 |
 |
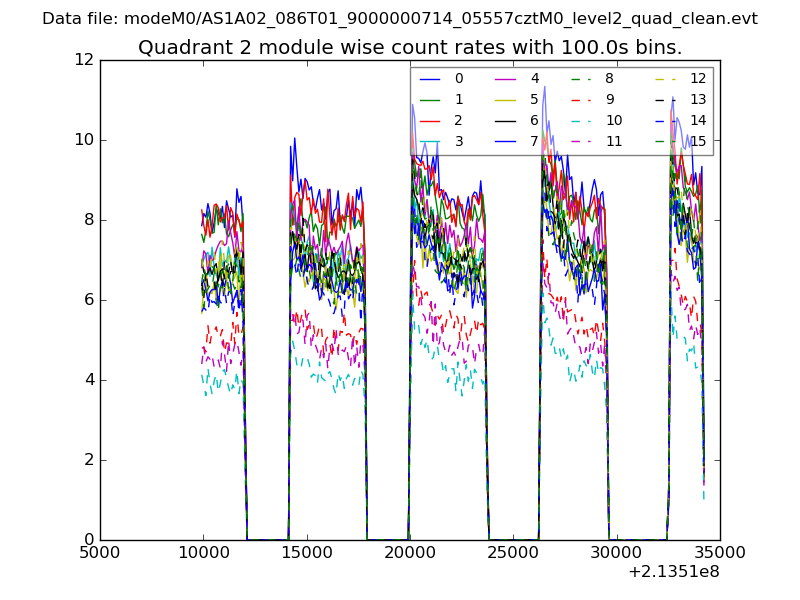
| Module-wise count rates for Quadrant B Data is divided into 100 sec bins |
 |
 |
| Module-wise count rates for Quadrant C Data is divided into 100 sec bins |
 |
 |
| Module-wise count rates for Quadrant D Data is divided into 100 sec bins |
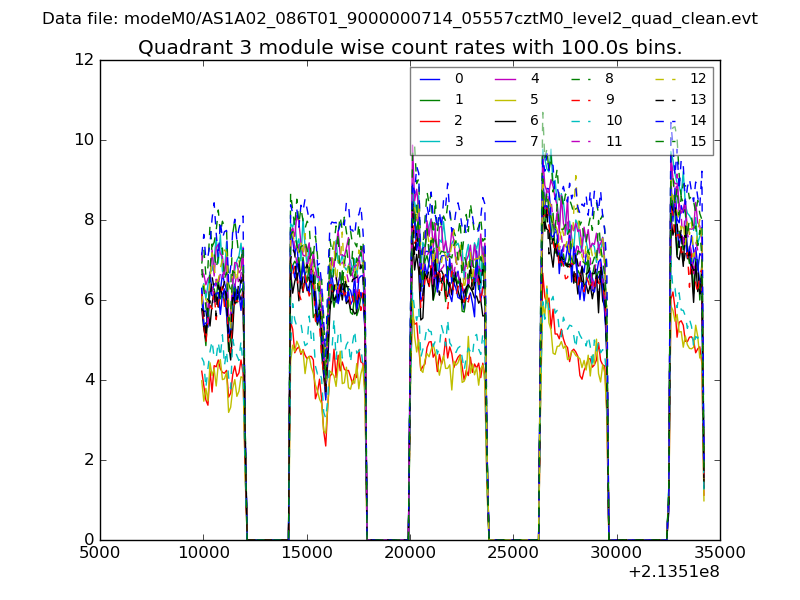 |
 |
| Parameter | Plot |
|---|---|
| CZT HV Monitor | 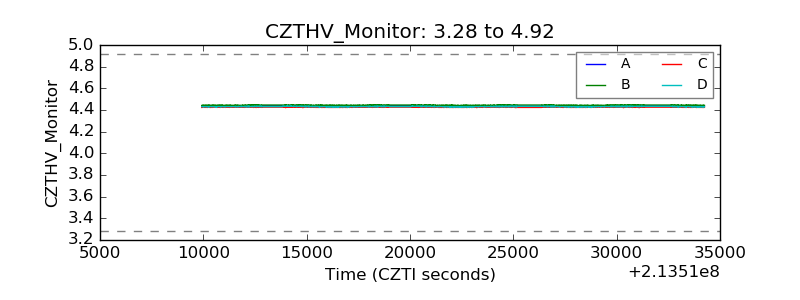 |
| D_VDD | 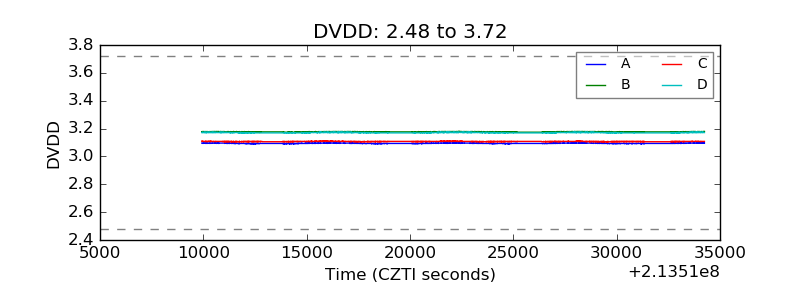 |
| Temperature 1 | 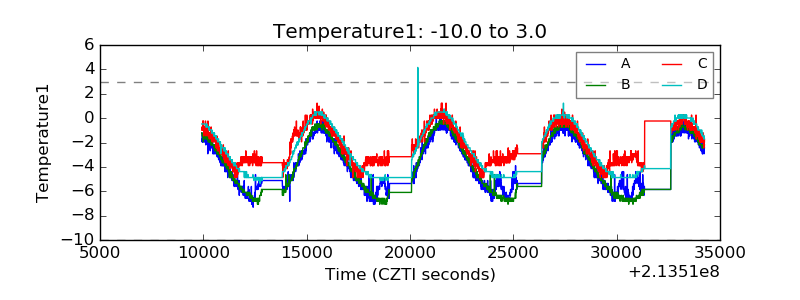 |
| Veto HV Monitor | 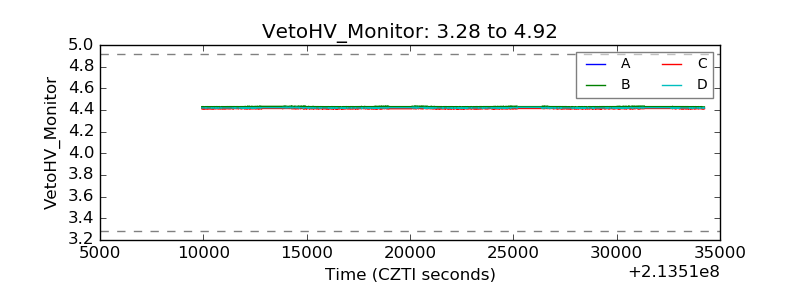 |
| Veto LLD | 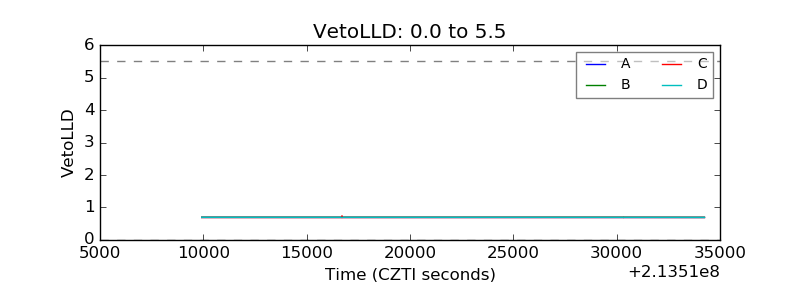 |
| Alpha Counter | 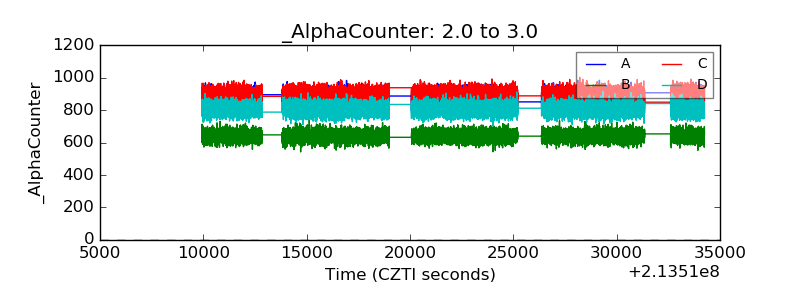 |
| _CPM_Rate | 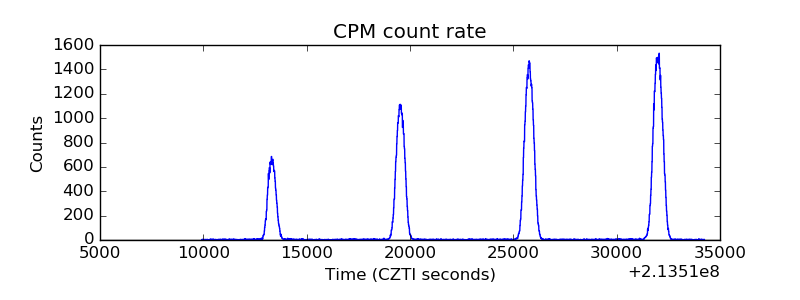 |
| CZT Counter | 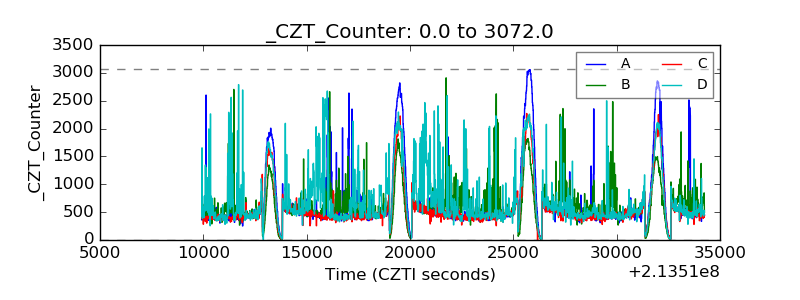 |
| +2.5 Volts monitor |  |
| +5 Volts monitor |  |
| _ROLL_ROT | 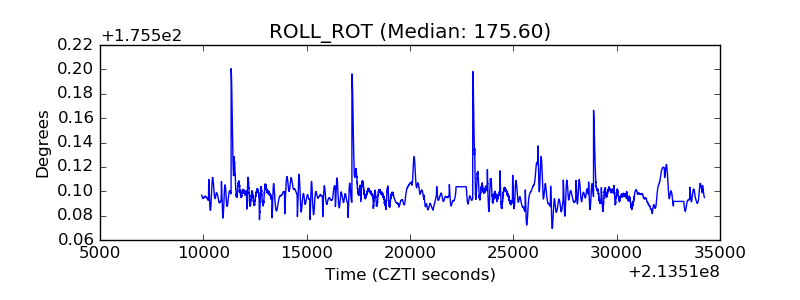 |
| _Roll_DEC | 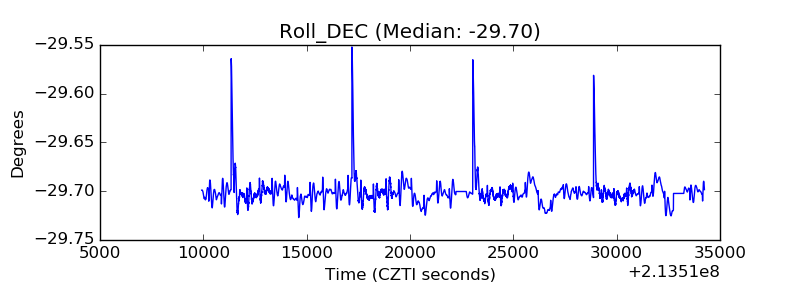 |
| _Roll_RA |  |
| Veto Counter | 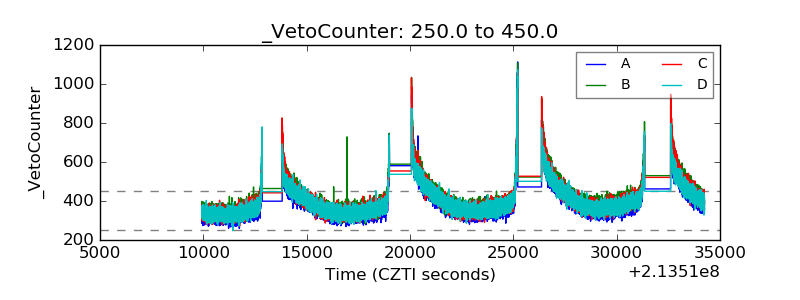 |