| Param | Original file | Final file |
|---|---|---|
| Filename | modeM0/AS1A02_086T01_9000000714_05558cztM0_level2.evt | modeM0/AS1A02_086T01_9000000714_05558cztM0_level2_quad_clean.evt |
| Size (bytes) | 440,991,360 | 70,151,040 |
| Size | 420.6 MB | 66.9 MB |
| Events in quadrant A | 3,257,913 | 430,142 |
| Events in quadrant B | 3,569,845 | 436,108 |
| Events in quadrant C | 2,738,641 | 434,100 |
| Events in quadrant D | 3,387,115 | 410,401 |
| Mode M9 | |||
|---|---|---|---|
| Quadrant | BADHDUFLAG | Total packets | Discarded packets |
| A | 0 | 12 | 0 |
| B | 0 | 12 | 0 |
| C | 0 | 12 | 0 |
| D | 0 | 12 | 0 |
| Mode M0 | |||
|---|---|---|---|
| Quadrant | BADHDUFLAG | Total packets | Discarded packets |
| A | 0 | 13657 | 2 |
| B | 0 | 14575 | 1 |
| C | 0 | 12194 | 1 |
| D | 0 | 13824 | 1 |
| Mode SS | |||
|---|---|---|---|
| Quadrant | BADHDUFLAG | Total packets | Discarded packets |
| A | 0 | 122 | 0 |
| B | 0 | 122 | 0 |
| C | 0 | 122 | 0 |
| D | 0 | 122 | 0 |
| Quadrant | Total seconds | Saturated seconds | Saturation percentage |
|---|---|---|---|
| A | 5908 | 212 | 3.588355% |
| B | 5908 | 85 | 1.438727% |
| C | 5908 | 28 | 0.473934% |
| D | 5908 | 127 | 2.149628% |
Noise dominated data is calculated using 1-second bins in cleaned event files. If a bin has >2000 counts, and if more than 50% of those come from <1% of pixels, then it is considered to be noise-dominated and hence unusable.
| Quadrant | # 1 sec bins | Bins with >0 counts | Bins with >2000 counts | High rate bins dominated by noise | Noise dominated (total time) | Noise dominated (detector-on time) | Marked lightcurve |
|---|---|---|---|---|---|---|---|
| A | 7163 | 5909 | 102 | 102 | 1.42% | 1.73% | 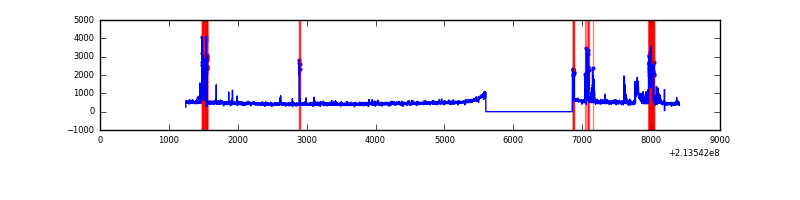 |
| B | 7163 | 5909 | 7 | 7 | 0.10% | 0.12% | 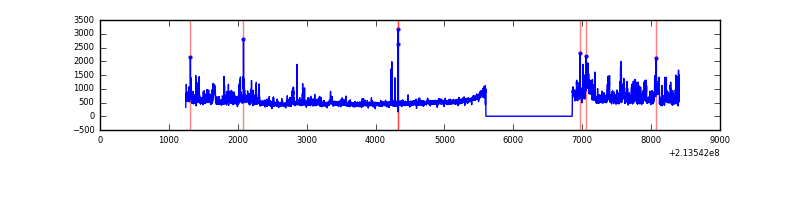 |
| C | 7163 | 5909 | 0 | 0 | 0.00% | 0.00% | 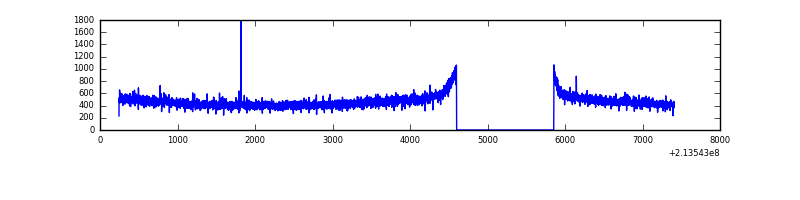 |
| D | 7163 | 5909 | 78 | 78 | 1.09% | 1.32% |  |
Top three noisy pixels from each quadrant. If the there are fewer than three noisy pixels in the level2.evt file, extra rows are filled as -1
| Pixel properties | Quadrant properties | ||||||
|---|---|---|---|---|---|---|---|
| Quadrant | DetID | PixID | Counts | Sigma | Mean | Median | Sigma |
| A | 15 | 174 | 265598 | 1841.97 | 707 | 693 | 143.8 |
| A | 0 | 50 | 202081 | 1400.31 | 707 | 693 | 143.8 |
| A | 12 | 113 | 20060 | 134.66 | 707 | 693 | 143.8 |
| B | 15 | 204 | 519682 | 3769.13 | 718 | 703 | 137.7 |
| B | 0 | 219 | 100705 | 726.27 | 718 | 703 | 137.7 |
| B | 10 | 16 | 43698 | 312.26 | 718 | 703 | 137.7 |
| C | 1 | 16 | 46650 | 289.54 | 682 | 685 | 158.8 |
| C | 9 | 16 | 14663 | 88.05 | 682 | 685 | 158.8 |
| C | 7 | 159 | 10021 | 58.81 | 682 | 685 | 158.8 |
| D | 2 | 152 | 304560 | 1812.95 | 681 | 658 | 167.6 |
| D | 2 | 63 | 197451 | 1173.98 | 681 | 658 | 167.6 |
| D | 8 | 195 | 91919 | 544.42 | 681 | 658 | 167.6 |
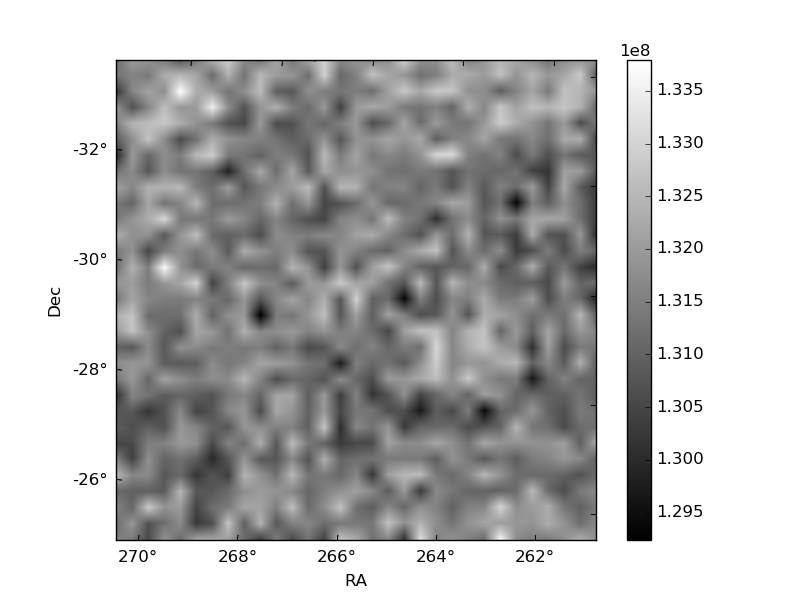
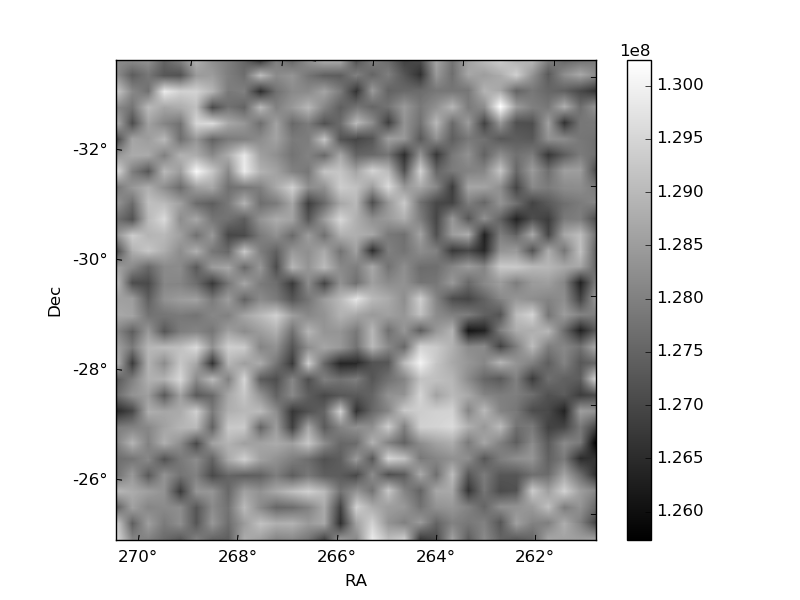
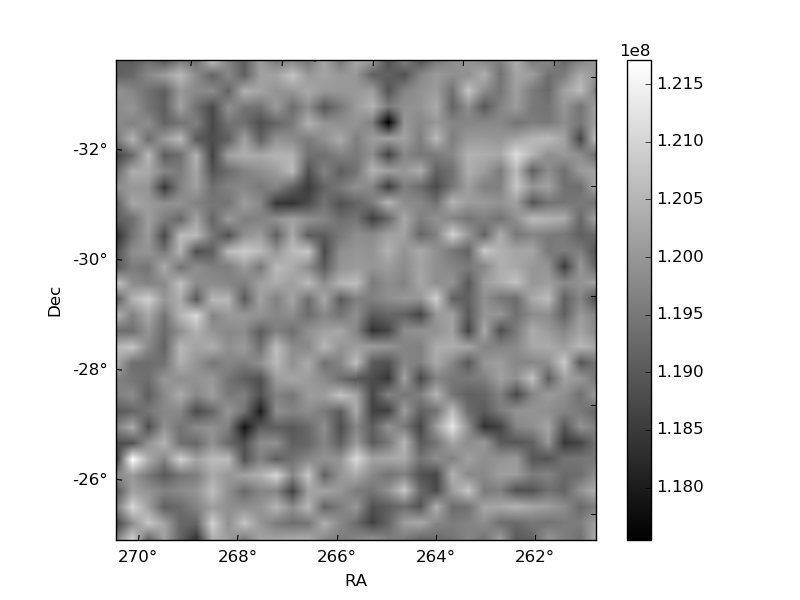
Histogram calculated using DETX and DETY for each event in the final _common_clean file
| Quadrant A |  |
 |
Quadrant B |
|---|---|---|---|
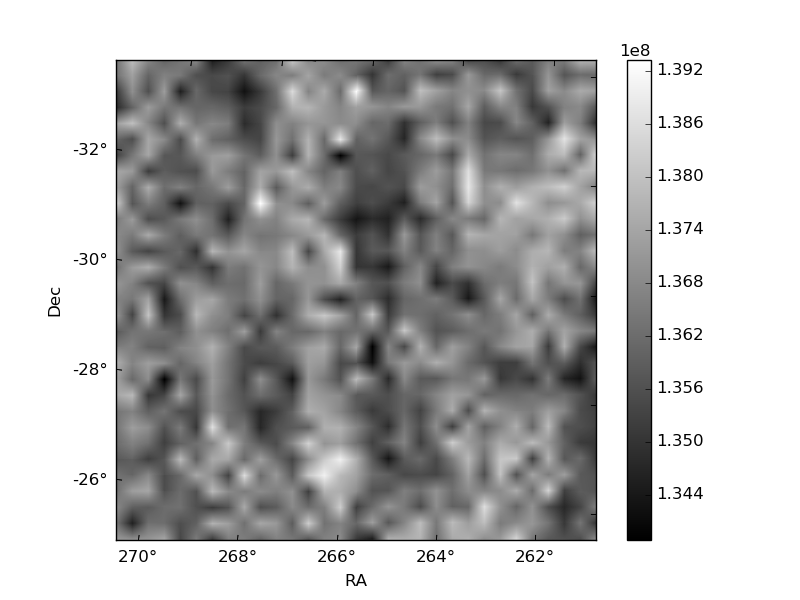
| Quadrant D | 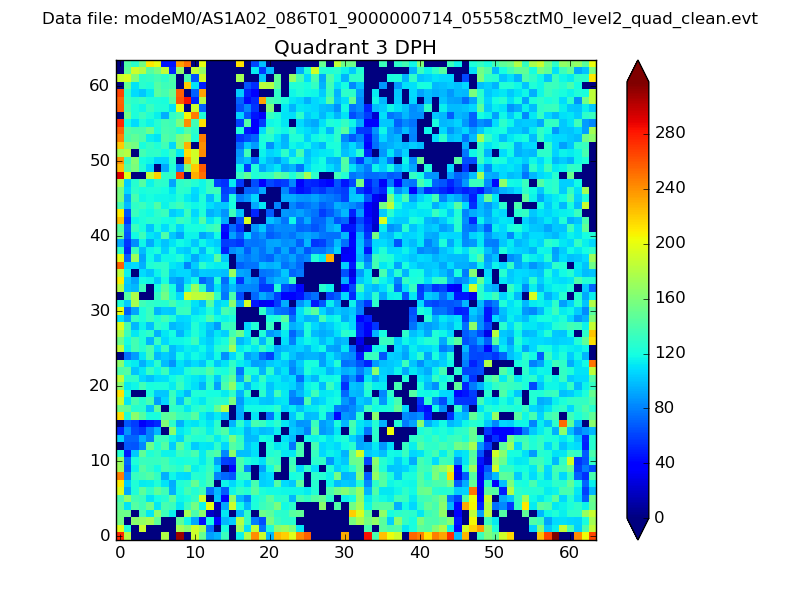 |
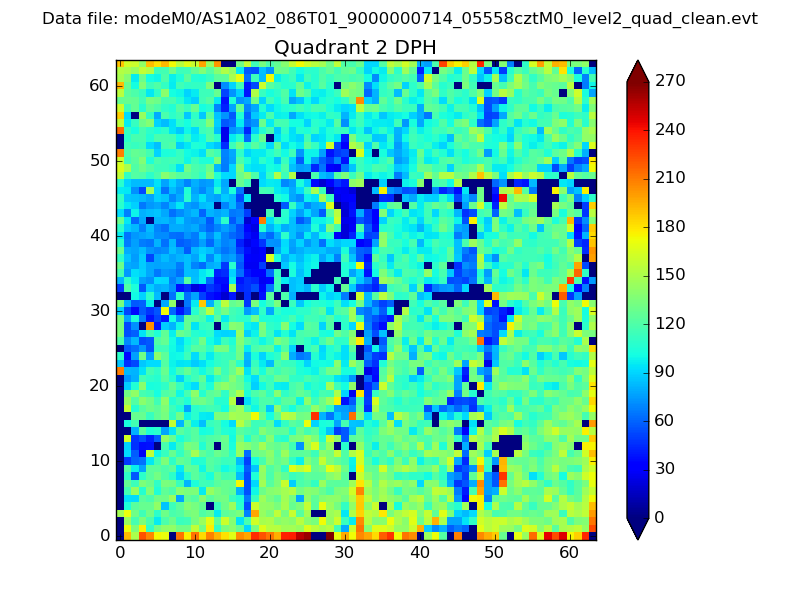 |
Quadrant C |
| Plot type | Count rate plots | Images |
|---|---|---|
| Comparison with Poisson distribution Blue bars denote a histogram of data divided into 1 sec bins. Red curve is a Poisson curve with rate = median count rate of data. |
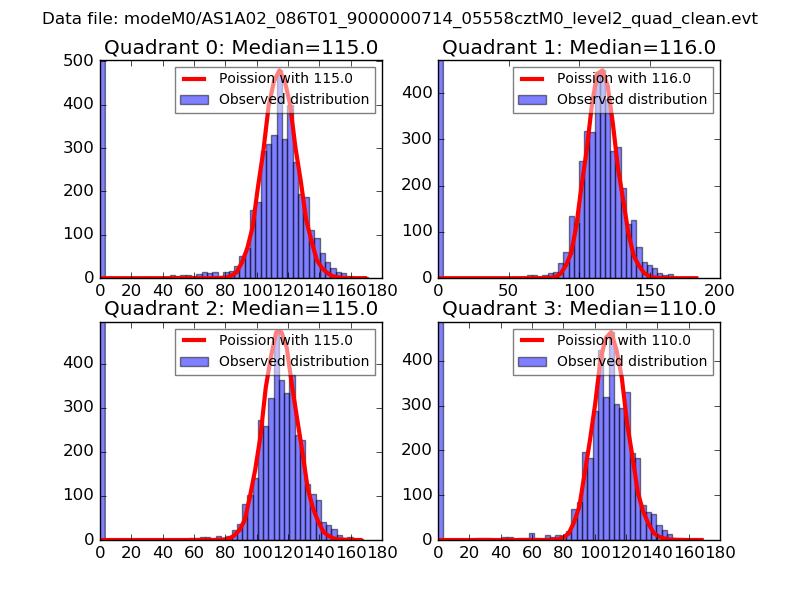 |
 |
| Quadrant-wise count rates Data is divided into 100 sec bins |
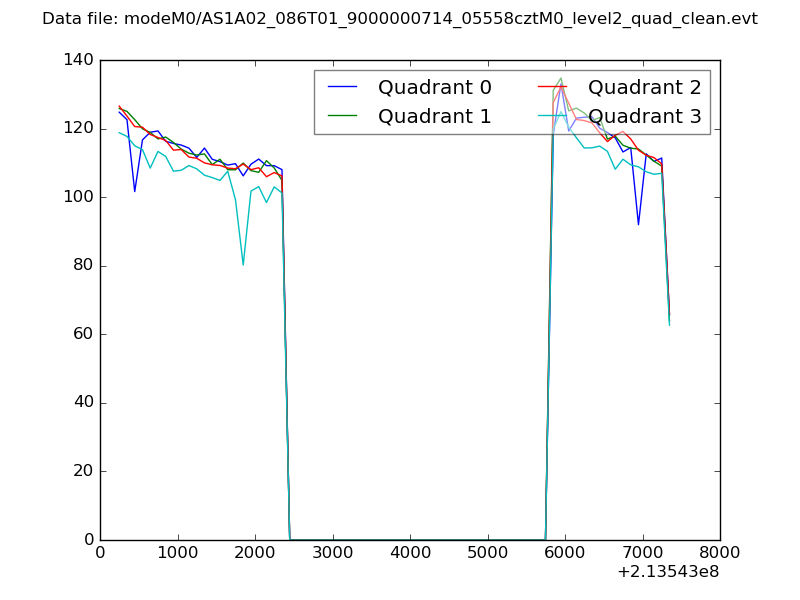 |
|
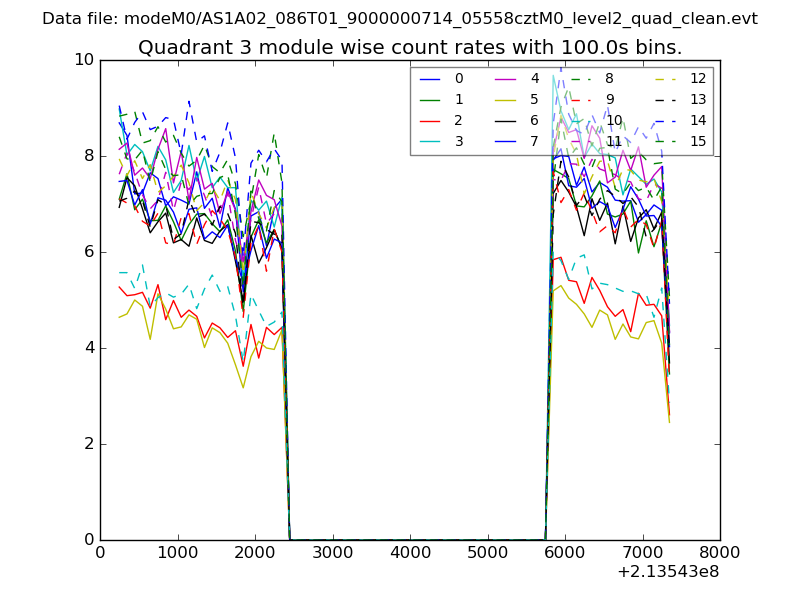
| Module-wise count rates for Quadrant A Data is divided into 100 sec bins |
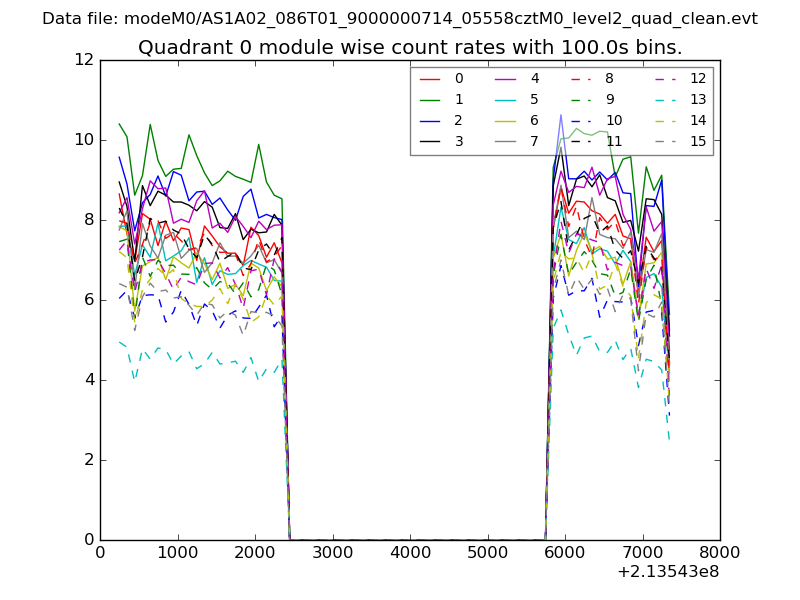 |
 |
| Module-wise count rates for Quadrant B Data is divided into 100 sec bins |
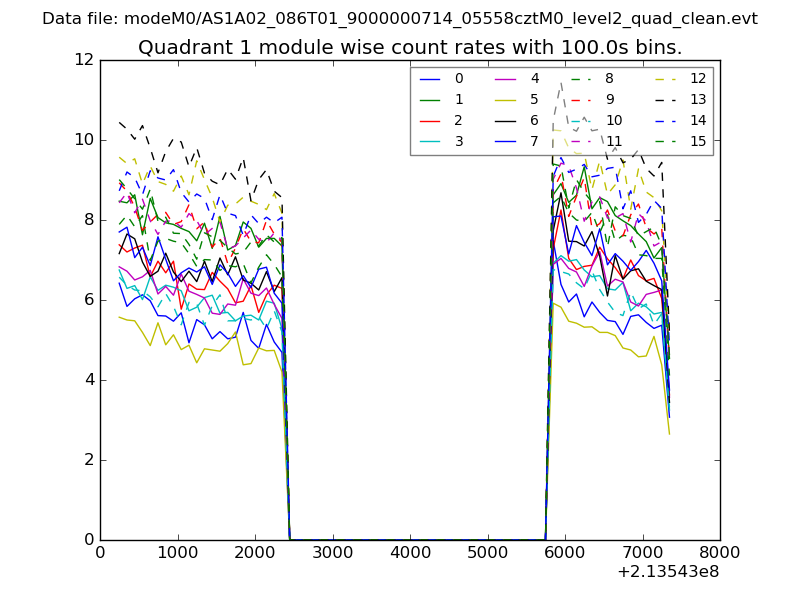 |
 |
| Module-wise count rates for Quadrant C Data is divided into 100 sec bins |
 |
 |
| Module-wise count rates for Quadrant D Data is divided into 100 sec bins |
 |
 |
| Parameter | Plot |
|---|---|
| CZT HV Monitor | 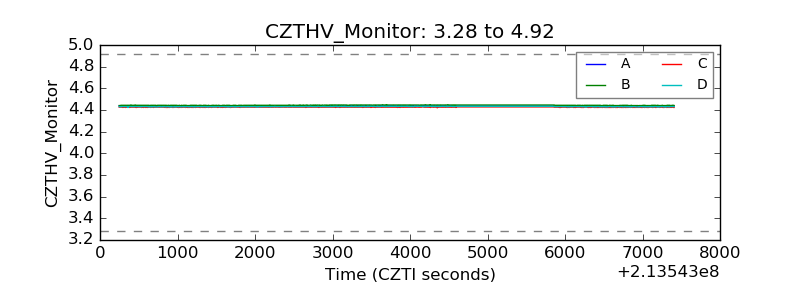 |
| D_VDD | 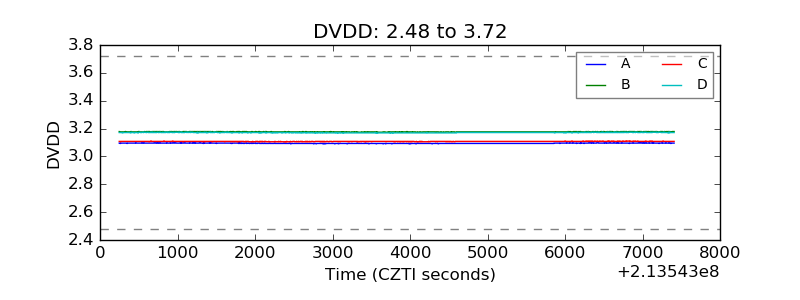 |
| Temperature 1 | 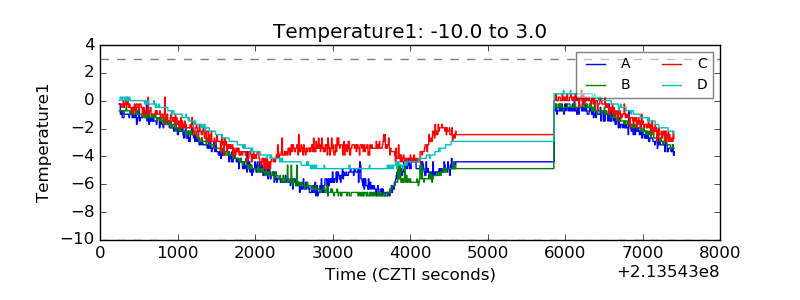 |
| Veto HV Monitor | 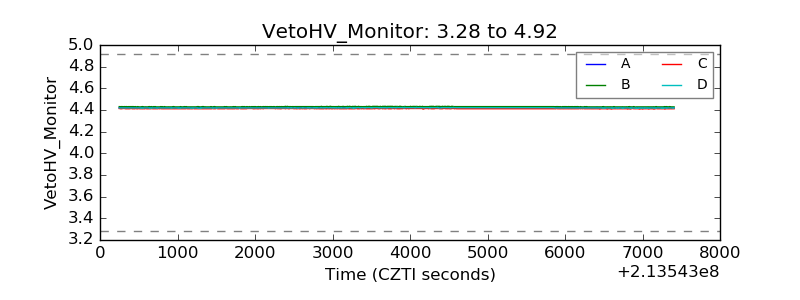 |
| Veto LLD | 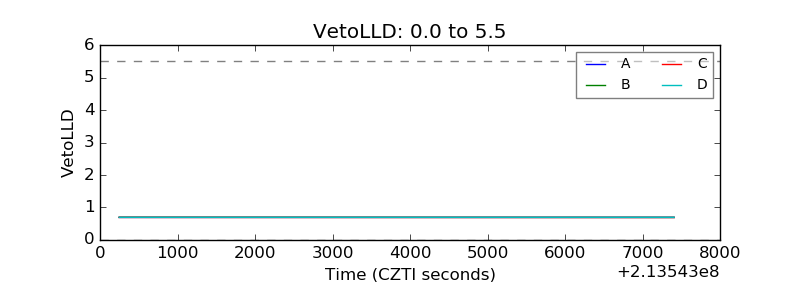 |
| Alpha Counter | 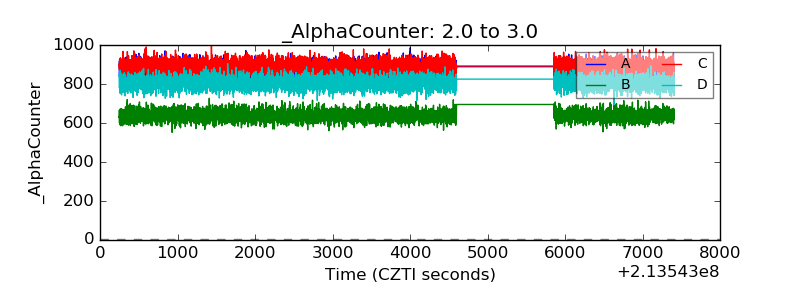 |
| _CPM_Rate | 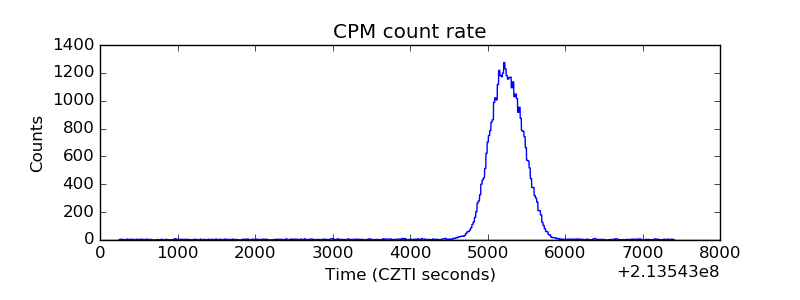 |
| CZT Counter | 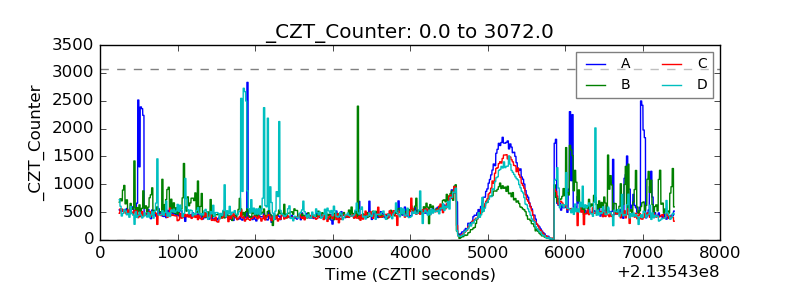 |
| +2.5 Volts monitor | 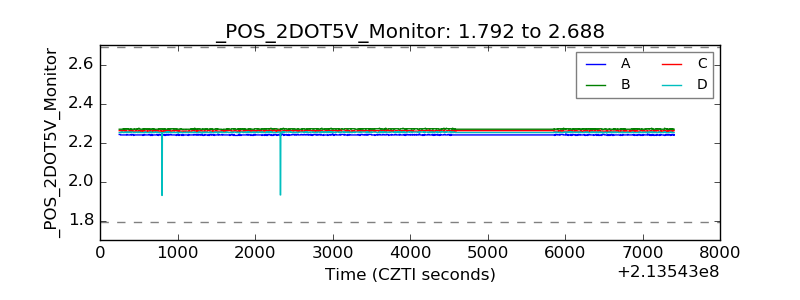 |
| +5 Volts monitor |  |
| _ROLL_ROT | 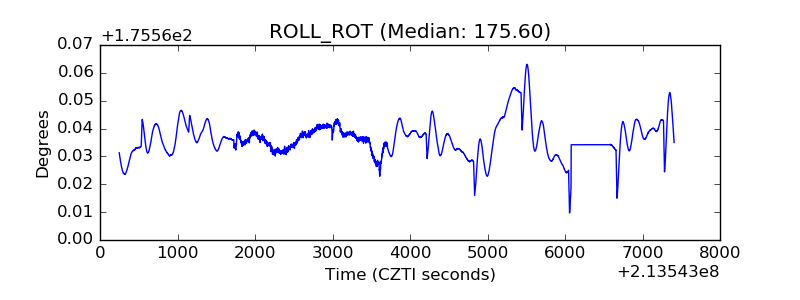 |
| _Roll_DEC | 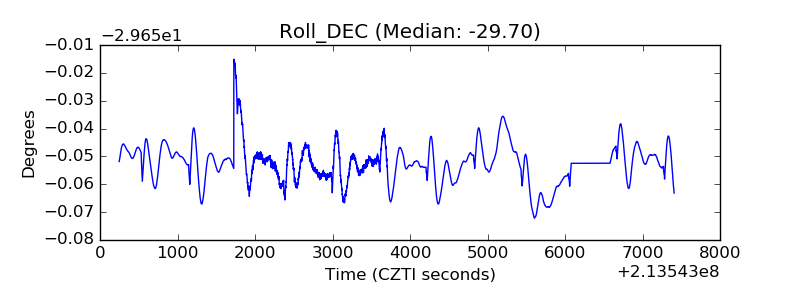 |
| _Roll_RA | 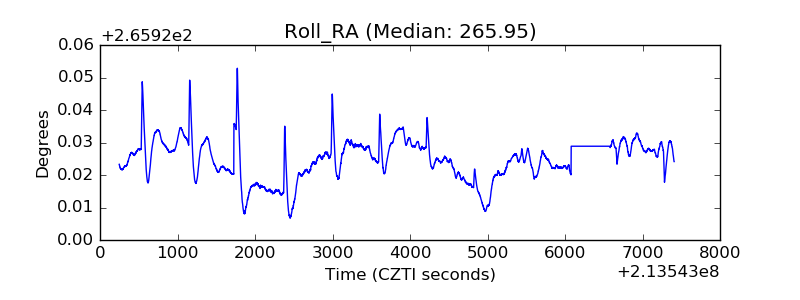 |
| Veto Counter | 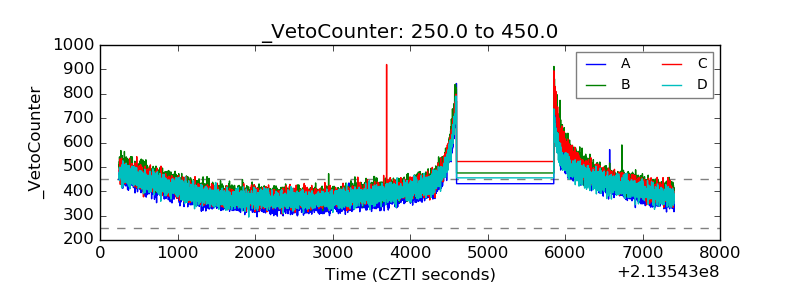 |