| Param | Original file | Final file |
|---|---|---|
| Filename | modeM0/AS1A02_165T04_9000000712cztM0_level2.fits | modeM0/AS1A02_165T04_9000000712cztM0_level2_quad_clean.evt |
| Size (bytes) | 54,708,480 | 42,765,120 |
| Size | 52.2 MB | 40.8 MB |
| Events in quadrant A | 325,370 | 231,536 |
| Events in quadrant B | 316,430 | 230,090 |
| Events in quadrant C | 320,962 | 221,367 |
| Events in quadrant D | 269,472 | 186,327 |
| Mode SS | |||
|---|---|---|---|
| Quadrant | BADHDUFLAG | Total packets | Discarded packets |
| A | 0 | 124 | 0 |
| B | 0 | 124 | 0 |
| C | 0 | 124 | 0 |
| D | 0 | 124 | 0 |
| Mode M0 | |||
|---|---|---|---|
| Quadrant | BADHDUFLAG | Total packets | Discarded packets |
| A | 0 | 12504 | 0 |
| B | 0 | 12917 | 0 |
| C | 0 | 12545 | 0 |
| D | 0 | 18291 | 0 |
| Mode M9 | |||
|---|---|---|---|
| Quadrant | BADHDUFLAG | Total packets | Discarded packets |
| A | 0 | 8 | 0 |
| B | 0 | 8 | 0 |
| C | 0 | 8 | 0 |
| D | 0 | 8 | 0 |
| Quadrant | Total seconds | Saturated seconds | Saturation percentage |
|---|---|---|---|
| A | 6081 | 35 | 0.575563% |
| B | 6081 | 54 | 0.888012% |
| C | 6081 | 23 | 0.378227% |
| D | 6081 | 323 | 5.311626% |
Noise dominated data is calculated using 1-second bins in cleaned event files. If a bin has >2000 counts, and if more than 50% of those come from <1% of pixels, then it is considered to be noise-dominated and hence unusable.
| Quadrant | # 1 sec bins | Bins with >0 counts | Bins with >2000 counts | High rate bins dominated by noise | Noise dominated (total time) | Noise dominated (detector-on time) | Marked lightcurve |
|---|---|---|---|---|---|---|---|
| A | 6861 | 6081 | 0 | 0 | 0.00% | 0.00% |  |
| B | 6861 | 6081 | 0 | 0 | 0.00% | 0.00% |  |
| C | 6861 | 6081 | 0 | 0 | 0.00% | 0.00% |  |
| D | 6861 | 6078 | 0 | 0 | 0.00% | 0.00% |  |
Top three noisy pixels from each quadrant. If the there are fewer than three noisy pixels in the level2.evt file, extra rows are filled as -1
| Pixel properties | Quadrant properties | ||||||
|---|---|---|---|---|---|---|---|
| Quadrant | DetID | PixID | Counts | Sigma | Mean | Median | Sigma |
| A | 14 | 188 | 327 | 10.44 | 84 | 79 | 23.8 |
| A | 0 | 29 | 327 | 10.44 | 84 | 79 | 23.8 |
| A | 14 | 204 | 321 | 10.19 | 84 | 79 | 23.8 |
| B | 2 | 9 | 286 | 10.27 | 83 | 79 | 20.2 |
| B | 12 | 226 | 251 | 8.53 | 83 | 79 | 20.2 |
| B | 5 | 232 | 233 | 7.64 | 83 | 79 | 20.2 |
| C | 12 | 241 | 276 | 8.13 | 84 | 78 | 24.4 |
| C | 1 | 81 | 252 | 7.15 | 84 | 78 | 24.4 |
| C | 7 | 111 | 232 | 6.32 | 84 | 78 | 24.4 |
| D | 7 | 5 | 205 | 6.19 | 76 | 69 | 22.0 |
| D | 7 | 3 | 204 | 6.14 | 76 | 69 | 22.0 |
| D | 11 | 82 | 202 | 6.05 | 76 | 69 | 22.0 |
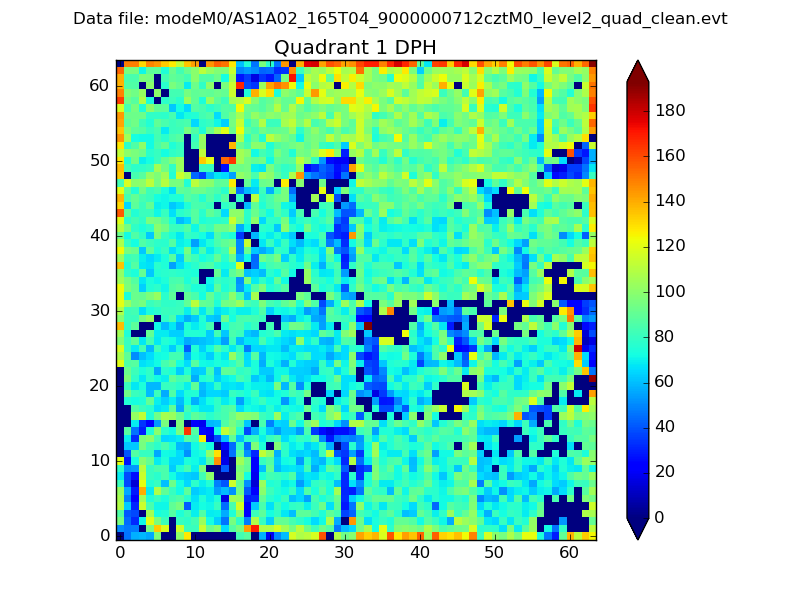
Histogram calculated using DETX and DETY for each event in the final _common_clean file
| Quadrant A |  |
 |
Quadrant B |
|---|---|---|---|
| Quadrant D |  |
 |
Quadrant C |
| Plot type | Count rate plots | Images |
|---|---|---|
| Comparison with Poisson distribution Blue bars denote a histogram of data divided into 1 sec bins. Red curve is a Poisson curve with rate = median count rate of data. |
 |
 |
| Quadrant-wise count rates Data is divided into 100 sec bins |
 |
|
| Module-wise count rates for Quadrant A Data is divided into 100 sec bins |
 |
 |
| Module-wise count rates for Quadrant B Data is divided into 100 sec bins |
 |
 |
| Module-wise count rates for Quadrant C Data is divided into 100 sec bins |
 |
 |
| Module-wise count rates for Quadrant D Data is divided into 100 sec bins |
 |
 |
| Parameter | Plot |
|---|---|
| CZT HV Monitor |  |
| D_VDD | 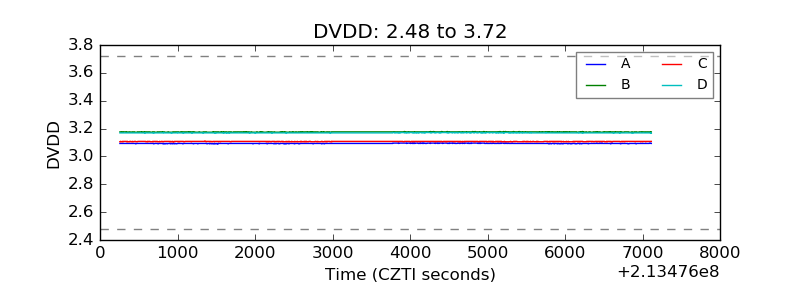 |
| Temperature 1 |  |
| Veto HV Monitor | 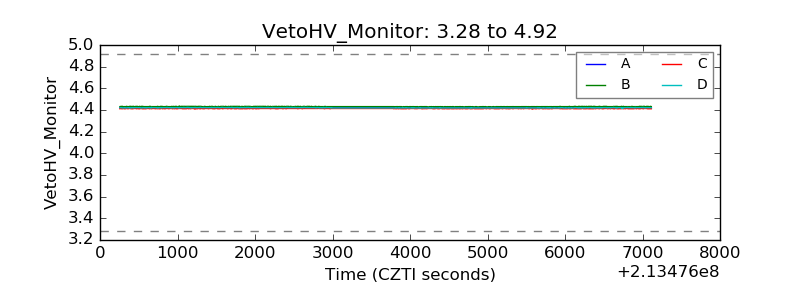 |
| Veto LLD |  |
| Alpha Counter |  |
| _CPM_Rate |  |
| CZT Counter |  |
| +2.5 Volts monitor | 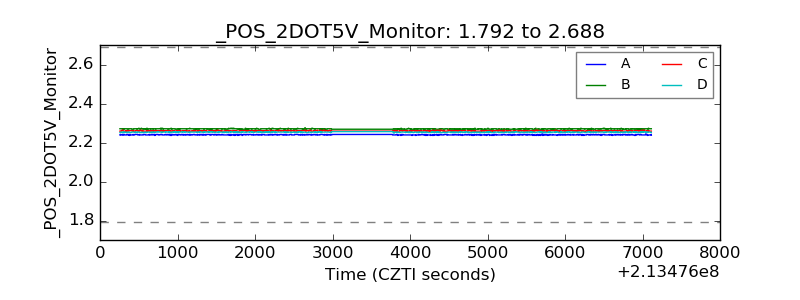 |
| +5 Volts monitor |  |
| _ROLL_ROT |  |
| _Roll_DEC | 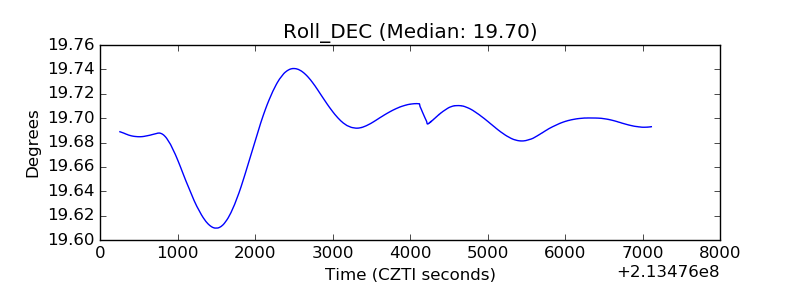 |
| _Roll_RA |  |
| Veto Counter | 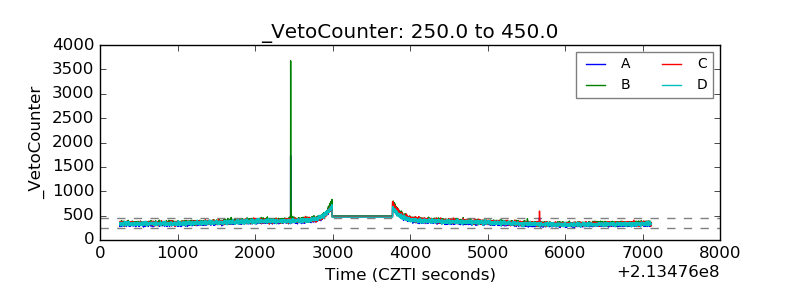 |