| Param | Original file | Final file |
|---|---|---|
| Filename | modeM0/AS1G06_126T01_9000000716cztM0_level2.fits | modeM0/AS1G06_126T01_9000000716cztM0_level2_quad_clean.evt |
| Size (bytes) | 54,008,640 | 48,965,760 |
| Size | 51.5 MB | 46.7 MB |
| Events in quadrant A | 319,770 | 277,298 |
| Events in quadrant B | 309,594 | 276,525 |
| Events in quadrant C | 316,706 | 268,431 |
| Events in quadrant D | 269,104 | 238,960 |
| Mode M9 | |||
|---|---|---|---|
| Quadrant | BADHDUFLAG | Total packets | Discarded packets |
| A | 0 | 9 | 0 |
| B | 0 | 9 | 0 |
| C | 0 | 9 | 0 |
| D | 0 | 9 | 0 |
| Mode M0 | |||
|---|---|---|---|
| Quadrant | BADHDUFLAG | Total packets | Discarded packets |
| A | 0 | 12471 | 0 |
| B | 0 | 13708 | 0 |
| C | 0 | 12575 | 0 |
| D | 0 | 14050 | 0 |
| Mode SS | |||
|---|---|---|---|
| Quadrant | BADHDUFLAG | Total packets | Discarded packets |
| A | 0 | 124 | 0 |
| B | 0 | 124 | 0 |
| C | 0 | 124 | 0 |
| D | 0 | 124 | 0 |
| Quadrant | Total seconds | Saturated seconds | Saturation percentage |
|---|---|---|---|
| A | 6018 | 53 | 0.880691% |
| B | 6018 | 89 | 1.478897% |
| C | 6018 | 42 | 0.697906% |
| D | 6018 | 120 | 1.994018% |
Noise dominated data is calculated using 1-second bins in cleaned event files. If a bin has >2000 counts, and if more than 50% of those come from <1% of pixels, then it is considered to be noise-dominated and hence unusable.
| Quadrant | # 1 sec bins | Bins with >0 counts | Bins with >2000 counts | High rate bins dominated by noise | Noise dominated (total time) | Noise dominated (detector-on time) | Marked lightcurve |
|---|---|---|---|---|---|---|---|
| A | 6968 | 6018 | 0 | 0 | 0.00% | 0.00% | 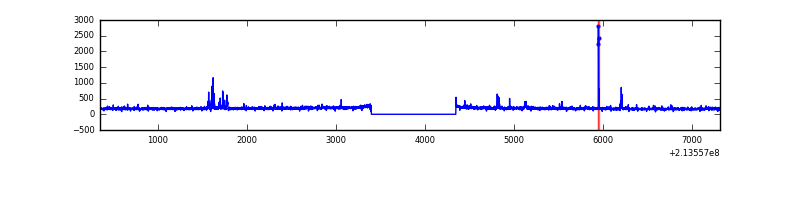 |
| B | 6968 | 6018 | 0 | 0 | 0.00% | 0.00% |  |
| C | 6968 | 6018 | 0 | 0 | 0.00% | 0.00% | 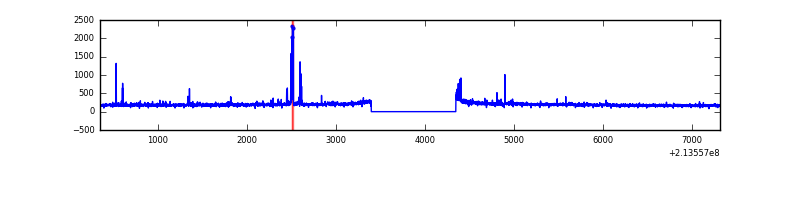 |
| D | 6968 | 6015 | 0 | 0 | 0.00% | 0.00% | 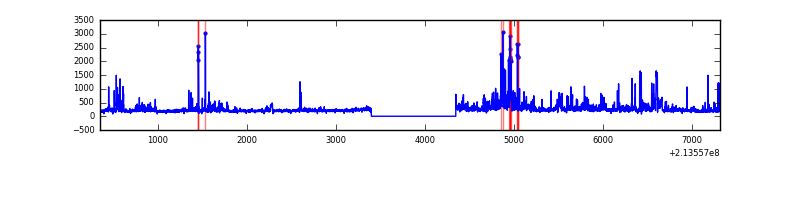 |
Top three noisy pixels from each quadrant. If the there are fewer than three noisy pixels in the level2.evt file, extra rows are filled as -1
| Pixel properties | Quadrant properties | ||||||
|---|---|---|---|---|---|---|---|
| Quadrant | DetID | PixID | Counts | Sigma | Mean | Median | Sigma |
| A | 0 | 29 | 303 | 9.73 | 82 | 77 | 23.2 |
| A | 14 | 188 | 303 | 9.73 | 82 | 77 | 23.2 |
| A | 14 | 204 | 282 | 8.83 | 82 | 77 | 23.2 |
| B | 2 | 9 | 274 | 10.01 | 81 | 77 | 19.7 |
| B | 5 | 232 | 222 | 7.37 | 81 | 77 | 19.7 |
| B | 2 | 8 | 215 | 7.01 | 81 | 77 | 19.7 |
| C | 1 | 80 | 248 | 7.25 | 83 | 77 | 23.6 |
| C | 1 | 81 | 247 | 7.21 | 83 | 77 | 23.6 |
| C | 2 | 191 | 239 | 6.87 | 83 | 77 | 23.6 |
| D | 1 | 19 | 225 | 7.07 | 76 | 69 | 22.1 |
| D | 3 | 14 | 221 | 6.89 | 76 | 69 | 22.1 |
| D | 11 | 82 | 213 | 6.53 | 76 | 69 | 22.1 |
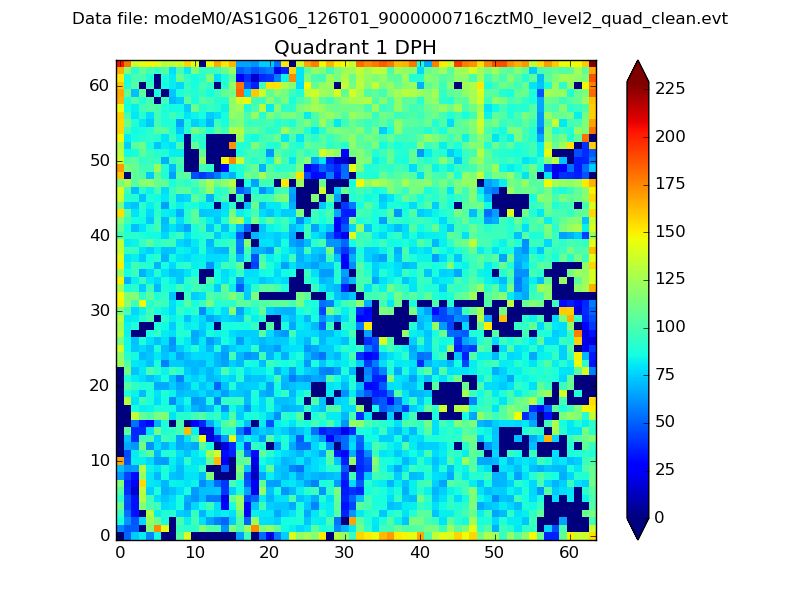
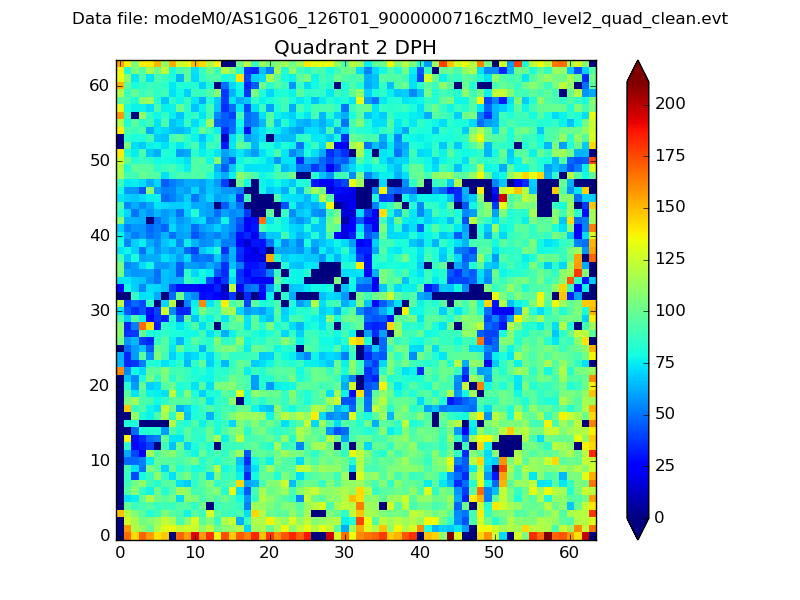
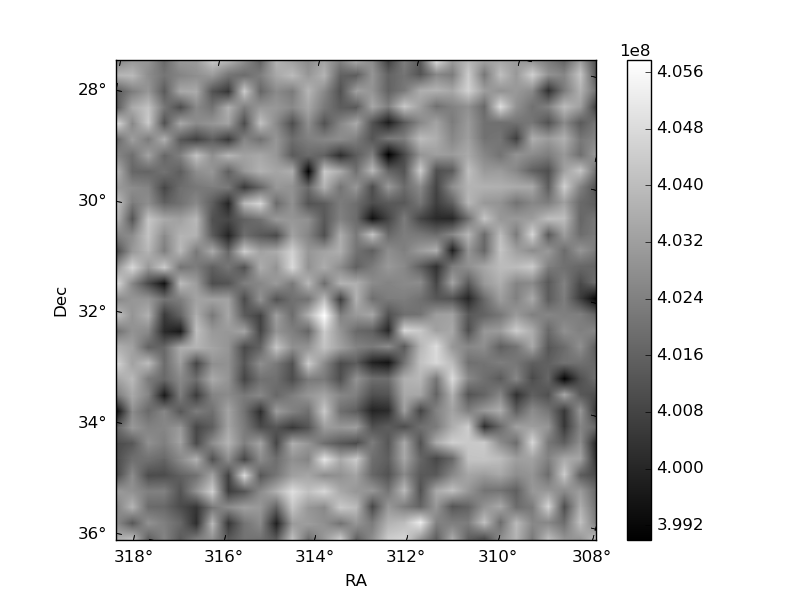
Histogram calculated using DETX and DETY for each event in the final _common_clean file
| Quadrant A | 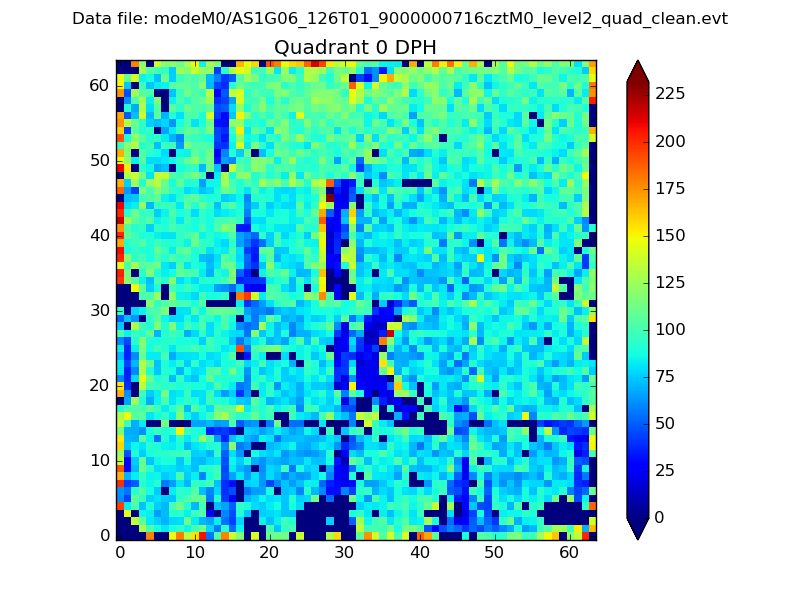 |
 |
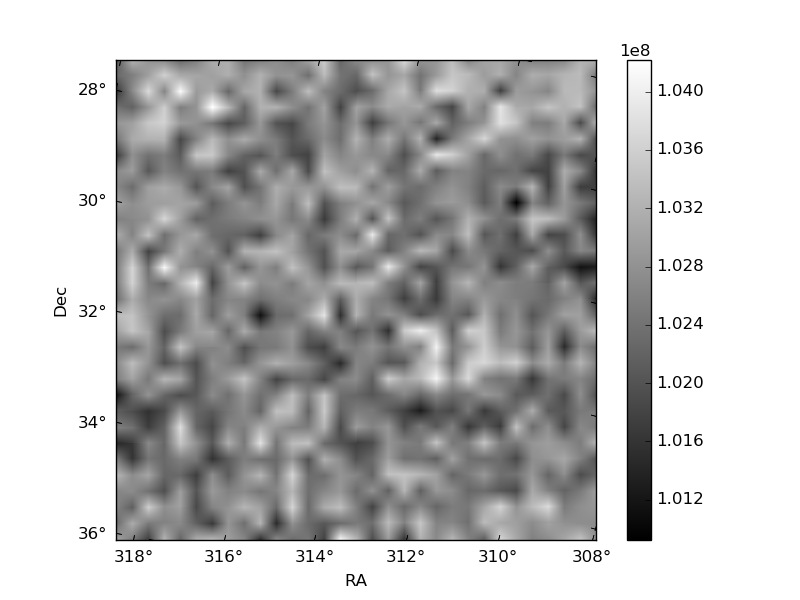
Quadrant B |
|---|---|---|---|
| Quadrant D | 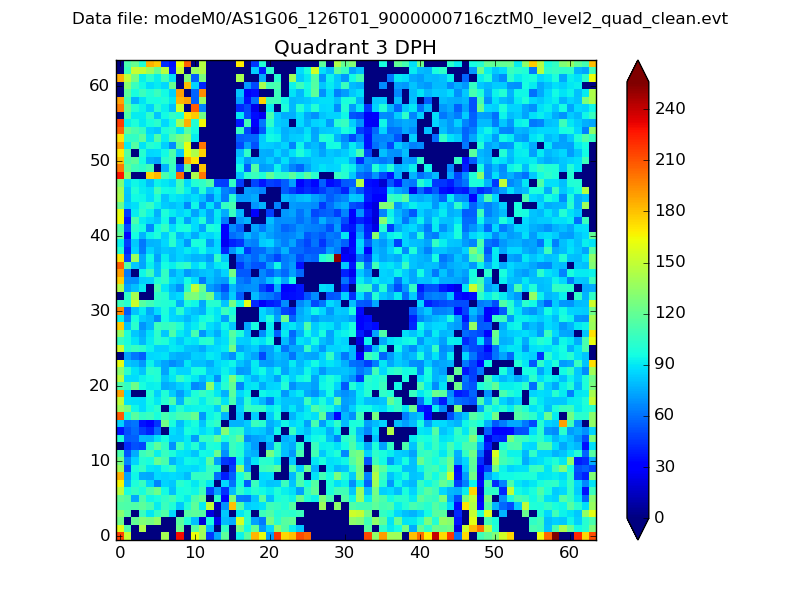 |
 |
Quadrant C |
| Plot type | Count rate plots | Images |
|---|---|---|
| Comparison with Poisson distribution Blue bars denote a histogram of data divided into 1 sec bins. Red curve is a Poisson curve with rate = median count rate of data. |
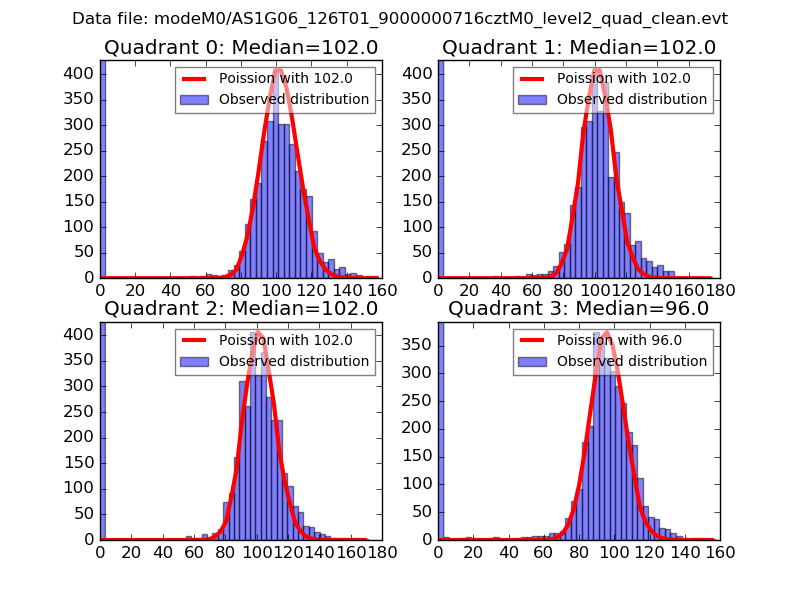 |
 |
| Quadrant-wise count rates Data is divided into 100 sec bins |
 |
|
| Module-wise count rates for Quadrant A Data is divided into 100 sec bins |
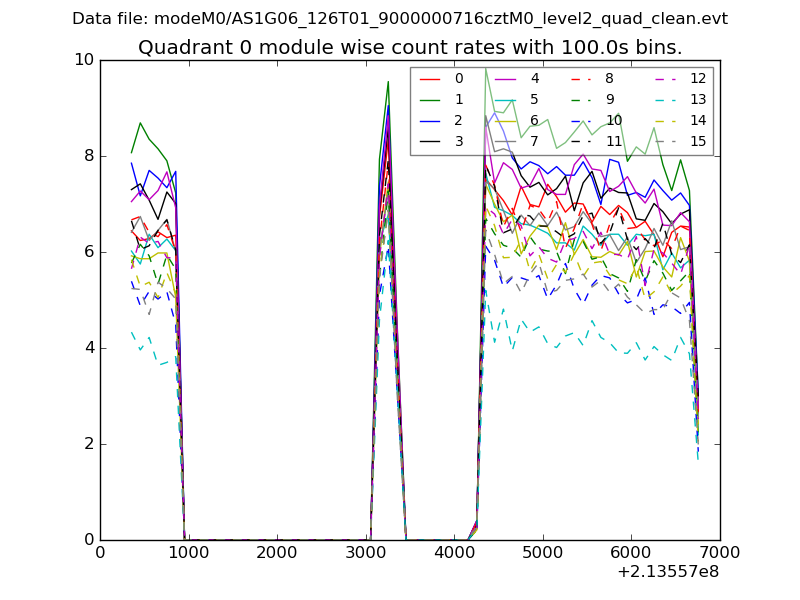 |
 |
| Module-wise count rates for Quadrant B Data is divided into 100 sec bins |
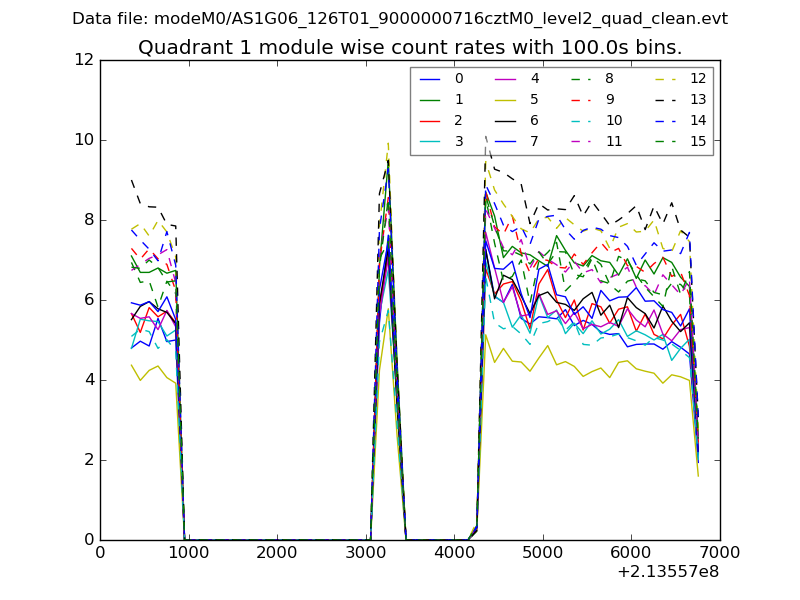 |
 |
| Module-wise count rates for Quadrant C Data is divided into 100 sec bins |
 |
 |
| Module-wise count rates for Quadrant D Data is divided into 100 sec bins |
 |
 |
| Parameter | Plot |
|---|---|
| CZT HV Monitor |  |
| D_VDD | 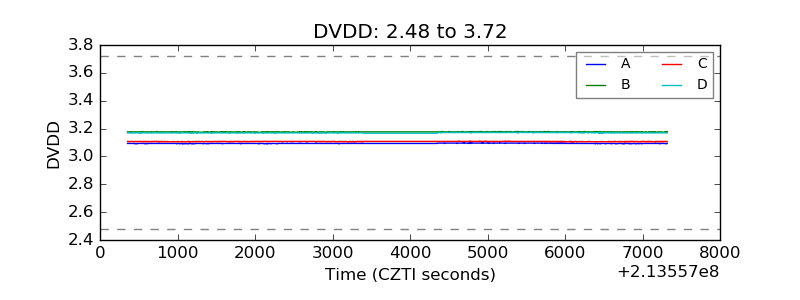 |
| Temperature 1 | 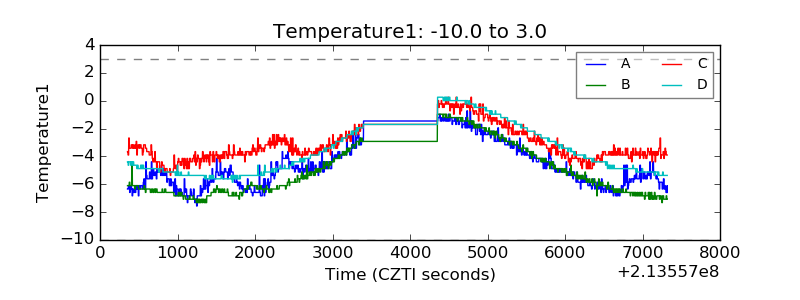 |
| Veto HV Monitor | 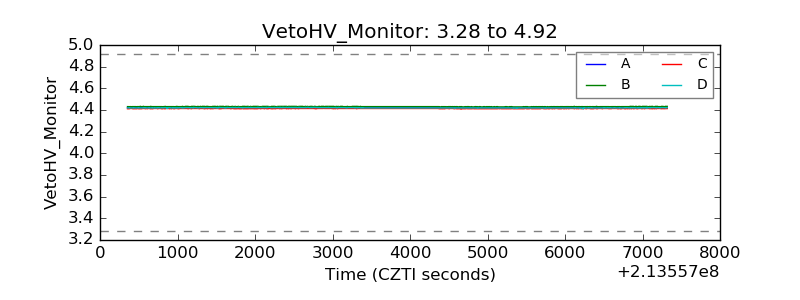 |
| Veto LLD | 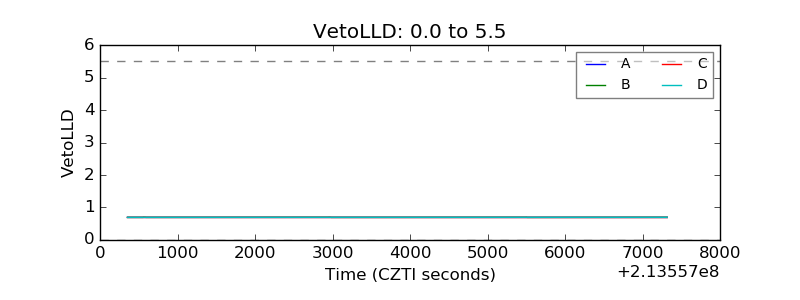 |
| Alpha Counter | 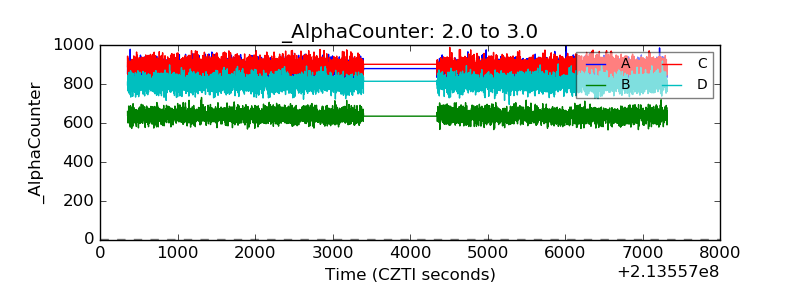 |
| _CPM_Rate | 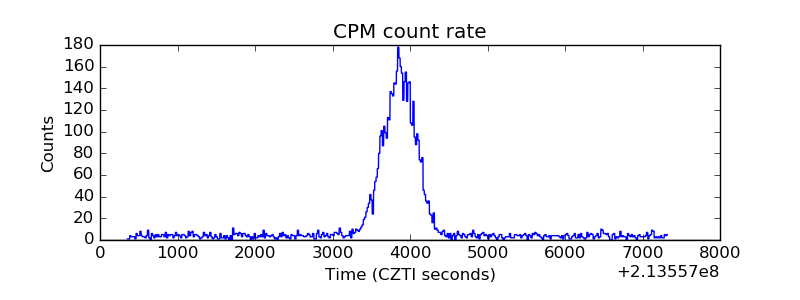 |
| CZT Counter | 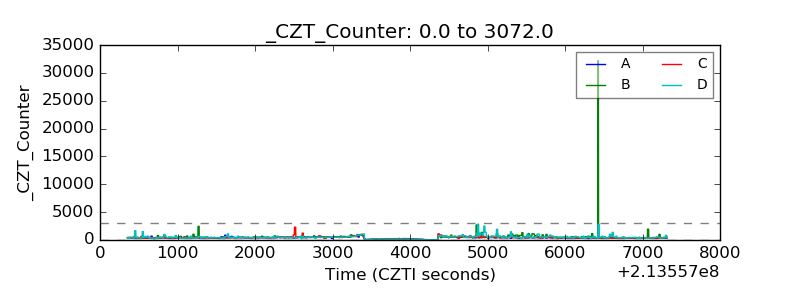 |
| +2.5 Volts monitor |  |
| +5 Volts monitor |  |
| _ROLL_ROT |  |
| _Roll_DEC | 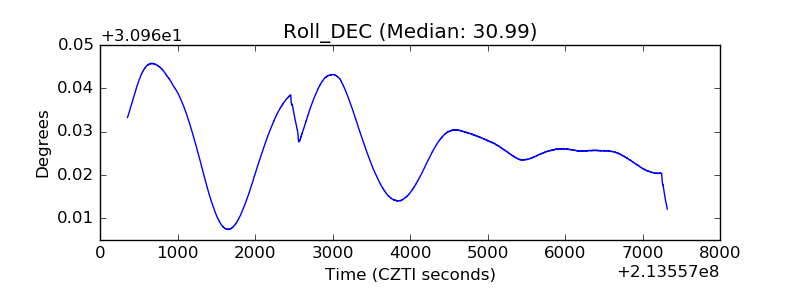 |
| _Roll_RA |  |
| Veto Counter |  |