| Param | Original file | Final file |
|---|---|---|
| Filename | modeM0/AS1G06_129T01_9000000718cztM0_level2.fits | modeM0/AS1G06_129T01_9000000718cztM0_level2_quad_clean.evt |
| Size (bytes) | 583,871,040 | 586,356,480 |
| Size | 556.8 MB | 559.2 MB |
| Events in quadrant A | 3,551,278 | 3,539,170 |
| Events in quadrant B | 3,370,086 | 3,497,416 |
| Events in quadrant C | 3,383,716 | 3,246,629 |
| Events in quadrant D | 2,997,990 | 3,096,736 |
| Mode SS | |||
|---|---|---|---|
| Quadrant | BADHDUFLAG | Total packets | Discarded packets |
| A | 0 | 1304 | 0 |
| B | 0 | 1304 | 0 |
| C | 0 | 1304 | 0 |
| D | 0 | 1304 | 0 |
| Mode M0 | |||
|---|---|---|---|
| Quadrant | BADHDUFLAG | Total packets | Discarded packets |
| A | 0 | 131865 | 0 |
| B | 0 | 153942 | 0 |
| C | 0 | 154731 | 0 |
| D | 0 | 137760 | 0 |
| Mode M9 | |||
|---|---|---|---|
| Quadrant | BADHDUFLAG | Total packets | Discarded packets |
| A | 0 | 95 | 0 |
| B | 0 | 96 | 0 |
| C | 0 | 96 | 0 |
| D | 0 | 96 | 0 |
| Quadrant | Total seconds | Saturated seconds | Saturation percentage |
|---|---|---|---|
| A | 63825 | 751 | 1.176655% |
| B | 63813 | 1770 | 2.773729% |
| C | 63832 | 2516 | 3.941597% |
| D | 63813 | 788 | 1.234858% |
Noise dominated data is calculated using 1-second bins in cleaned event files. If a bin has >2000 counts, and if more than 50% of those come from <1% of pixels, then it is considered to be noise-dominated and hence unusable.
| Quadrant | # 1 sec bins | Bins with >0 counts | Bins with >2000 counts | High rate bins dominated by noise | Noise dominated (total time) | Noise dominated (detector-on time) | Marked lightcurve |
|---|---|---|---|---|---|---|---|
| A | 73527 | 63849 | 0 | 0 | 0.00% | 0.00% |  |
| B | 73527 | 63780 | 0 | 0 | 0.00% | 0.00% |  |
| C | 73527 | 63580 | 0 | 0 | 0.00% | 0.00% |  |
| D | 73527 | 63852 | 0 | 0 | 0.00% | 0.00% |  |
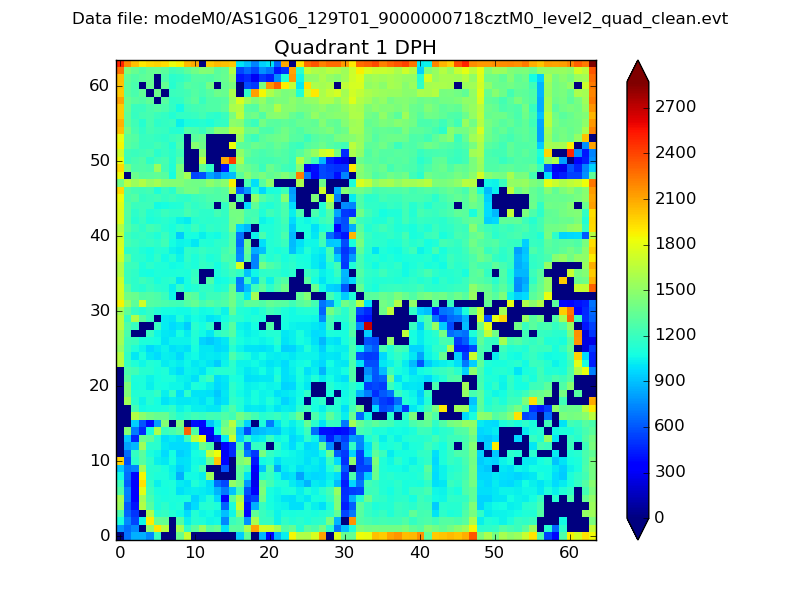
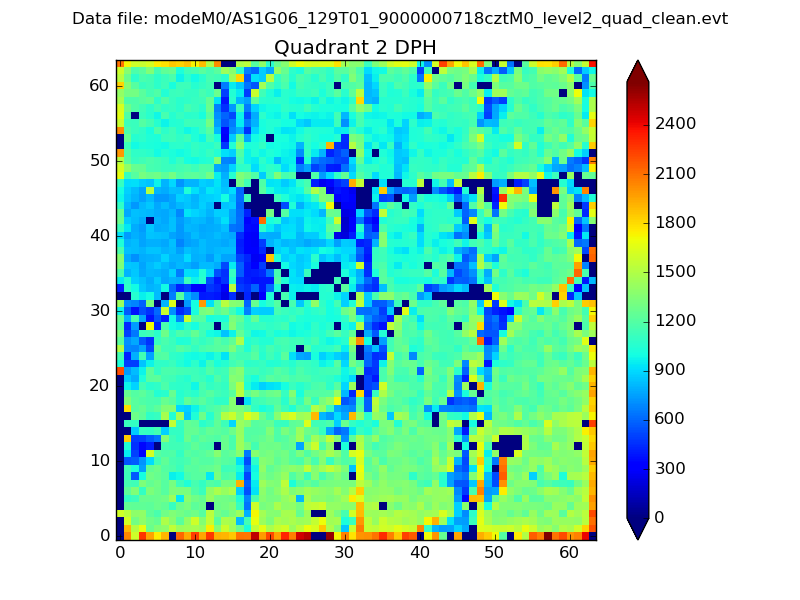
Top three noisy pixels from each quadrant. If the there are fewer than three noisy pixels in the level2.evt file, extra rows are filled as -1
| Pixel properties | Quadrant properties | ||||||
|---|---|---|---|---|---|---|---|
| Quadrant | DetID | PixID | Counts | Sigma | Mean | Median | Sigma |
| A | 14 | 188 | 3485 | 11.05 | 919 | 855 | 238.1 |
| A | 0 | 29 | 3444 | 10.87 | 919 | 855 | 238.1 |
| A | 7 | 110 | 3092 | 9.39 | 919 | 855 | 238.1 |
| B | 2 | 9 | 3009 | 12.18 | 887 | 841 | 178.0 |
| B | 12 | 226 | 2359 | 8.53 | 887 | 841 | 178.0 |
| B | 14 | 254 | 2293 | 8.16 | 887 | 841 | 178.0 |
| C | 1 | 80 | 2483 | 7.03 | 892 | 820 | 236.7 |
| C | 12 | 241 | 2421 | 6.76 | 892 | 820 | 236.7 |
| C | 1 | 81 | 2385 | 6.61 | 892 | 820 | 236.7 |
| D | 11 | 82 | 2270 | 6.5 | 854 | 772 | 230.5 |
| D | 3 | 14 | 2254 | 6.43 | 854 | 772 | 230.5 |
| D | 6 | 231 | 2229 | 6.32 | 854 | 772 | 230.5 |
Histogram calculated using DETX and DETY for each event in the final _common_clean file
| Quadrant A |  |
 |
Quadrant B |
|---|---|---|---|
| Quadrant D | 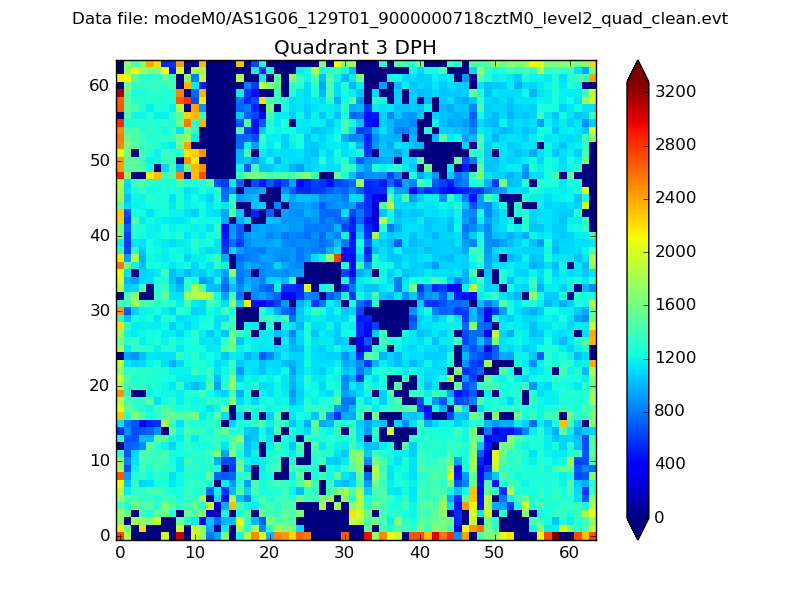 |
 |
Quadrant C |
| Plot type | Count rate plots | Images |
|---|---|---|
| Comparison with Poisson distribution Blue bars denote a histogram of data divided into 1 sec bins. Red curve is a Poisson curve with rate = median count rate of data. |
 |
 |
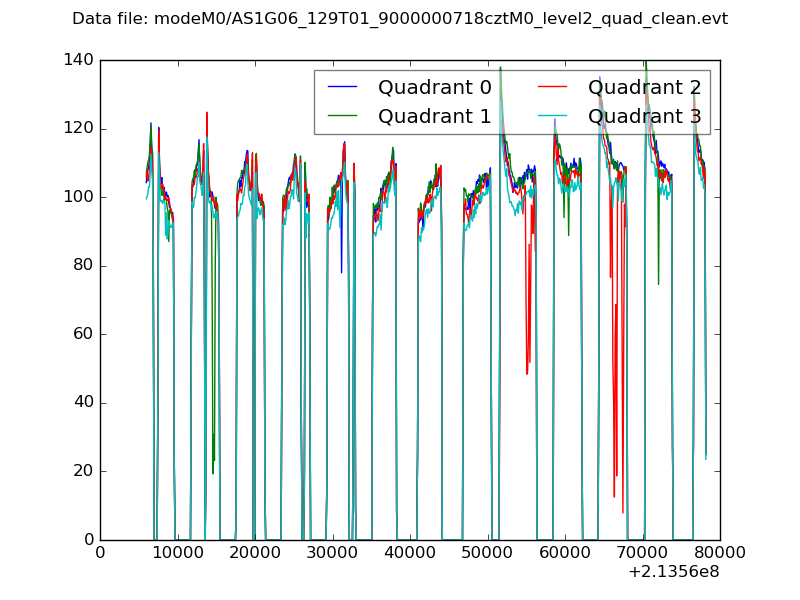
| Quadrant-wise count rates Data is divided into 100 sec bins |
 |
|
| Module-wise count rates for Quadrant A Data is divided into 100 sec bins |
 |
 |
| Module-wise count rates for Quadrant B Data is divided into 100 sec bins |
 |
 |
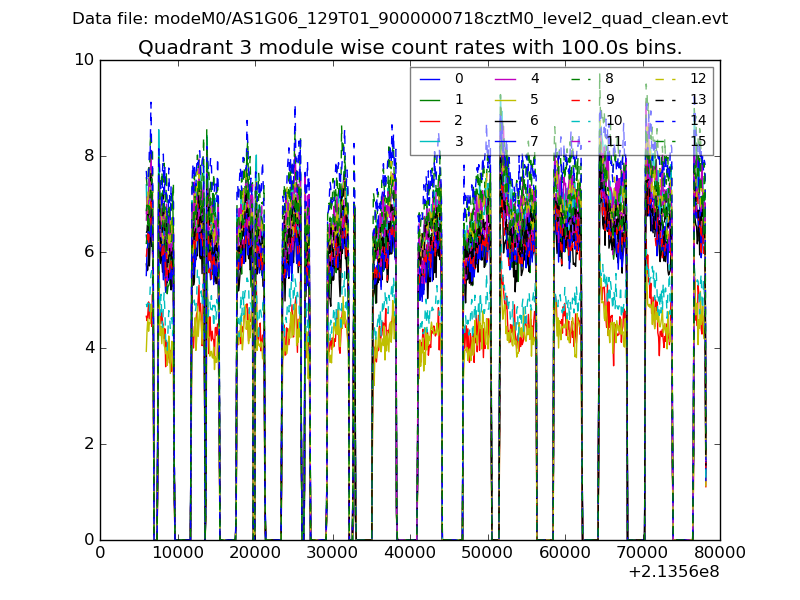
| Module-wise count rates for Quadrant C Data is divided into 100 sec bins |
 |
 |
| Module-wise count rates for Quadrant D Data is divided into 100 sec bins |
 |
 |
| Parameter | Plot |
|---|---|
| CZT HV Monitor |  |
| D_VDD | 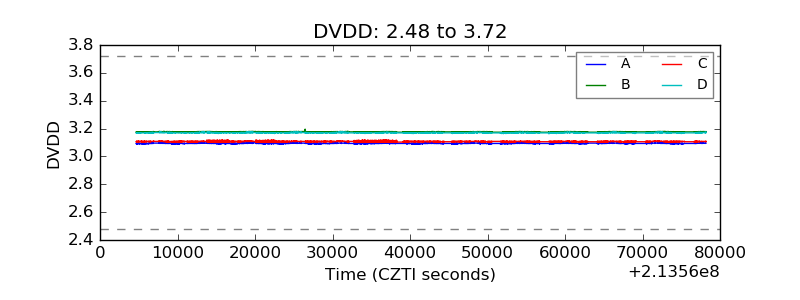 |
| Temperature 1 | 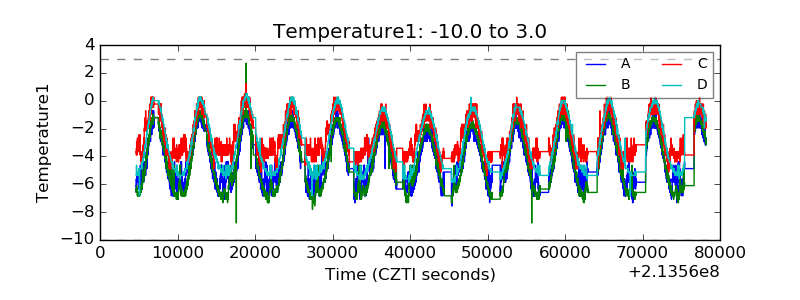 |
| Veto HV Monitor | 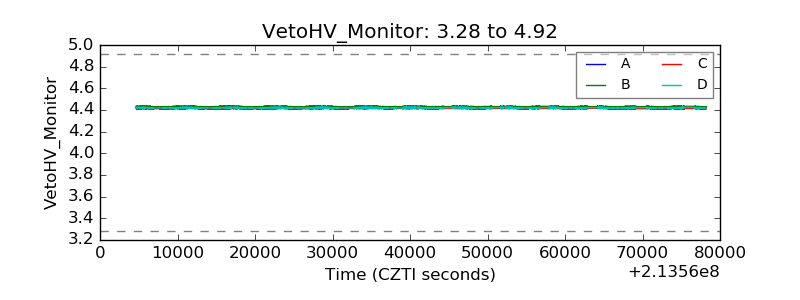 |
| Veto LLD | 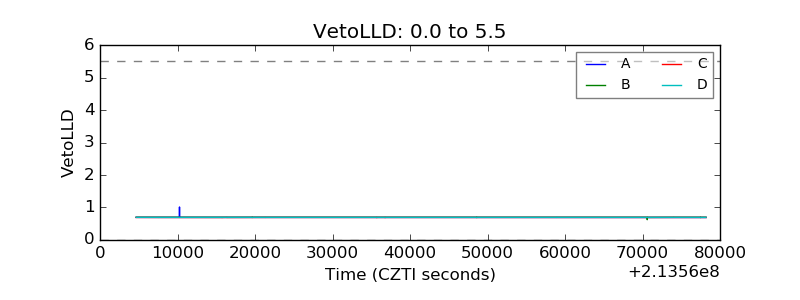 |
| Alpha Counter |  |
| _CPM_Rate |  |
| CZT Counter | 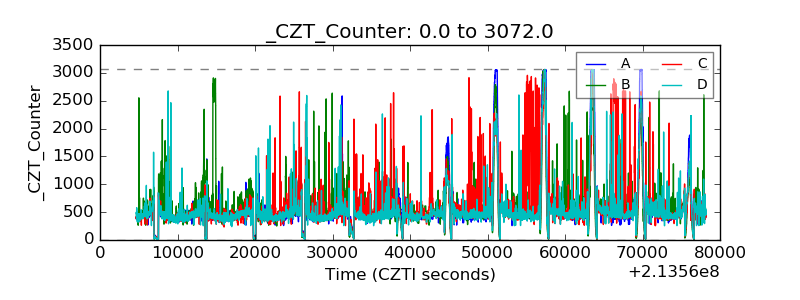 |
| +2.5 Volts monitor | 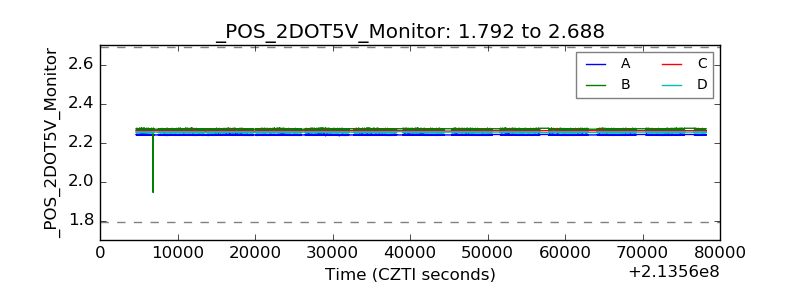 |
| +5 Volts monitor |  |
| _ROLL_ROT | 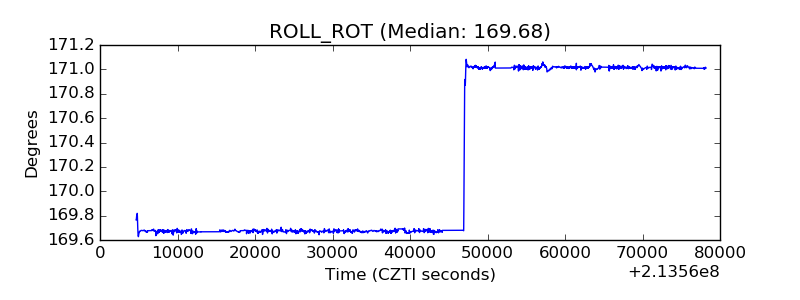 |
| _Roll_DEC | 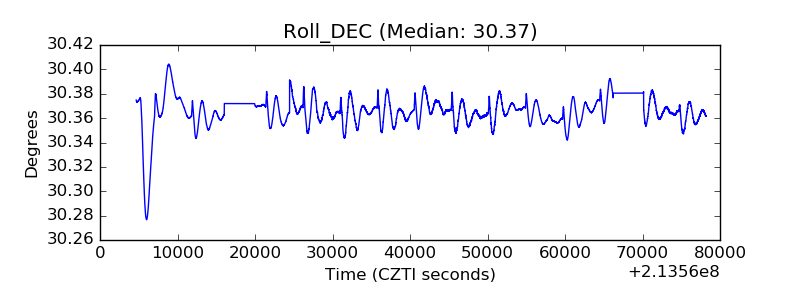 |
| _Roll_RA | 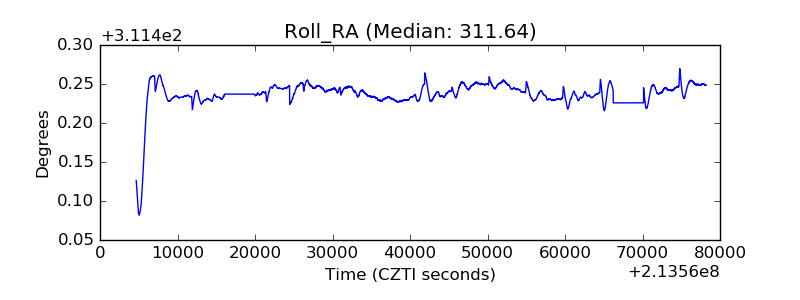 |
| Veto Counter | 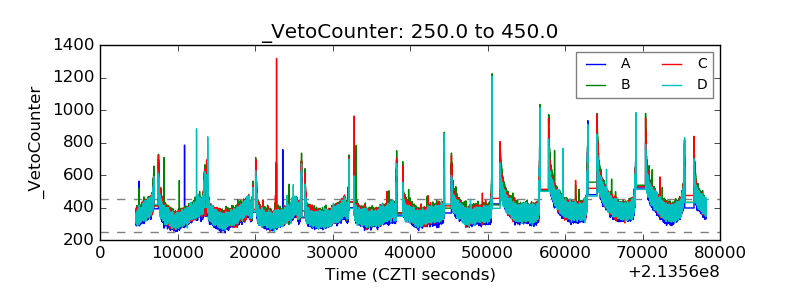 |