| Param | Original file | Final file |
|---|---|---|
| Filename | modeM0/AS1G06_129T01_9000000718_05563cztM0_level2.evt | modeM0/AS1G06_129T01_9000000718_05563cztM0_level2_quad_clean.evt |
| Size (bytes) | 567,040,320 | 92,157,120 |
| Size | 540.8 MB | 87.9 MB |
| Events in quadrant A | 3,703,685 | 570,993 |
| Events in quadrant B | 5,343,794 | 547,368 |
| Events in quadrant C | 3,788,300 | 569,689 |
| Events in quadrant D | 3,794,184 | 546,416 |
| Mode SS | |||
|---|---|---|---|
| Quadrant | BADHDUFLAG | Total packets | Discarded packets |
| A | 0 | 164 | 0 |
| B | 0 | 164 | 0 |
| C | 0 | 164 | 0 |
| D | 0 | 164 | 0 |
| Mode M0 | |||
|---|---|---|---|
| Quadrant | BADHDUFLAG | Total packets | Discarded packets |
| A | 0 | 16646 | 3 |
| B | 0 | 21445 | 2 |
| C | 0 | 16887 | 2 |
| D | 0 | 16886 | 2 |
| Mode M9 | |||
|---|---|---|---|
| Quadrant | BADHDUFLAG | Total packets | Discarded packets |
| A | 0 | 5 | 0 |
| B | 0 | 5 | 0 |
| C | 0 | 5 | 0 |
| D | 0 | 5 | 0 |
| Quadrant | Total seconds | Saturated seconds | Saturation percentage |
|---|---|---|---|
| A | 8000 | 60 | 0.750000% |
| B | 8000 | 543 | 6.787500% |
| C | 8000 | 58 | 0.725000% |
| D | 8000 | 44 | 0.550000% |
Noise dominated data is calculated using 1-second bins in cleaned event files. If a bin has >2000 counts, and if more than 50% of those come from <1% of pixels, then it is considered to be noise-dominated and hence unusable.
| Quadrant | # 1 sec bins | Bins with >0 counts | Bins with >2000 counts | High rate bins dominated by noise | Noise dominated (total time) | Noise dominated (detector-on time) | Marked lightcurve |
|---|---|---|---|---|---|---|---|
| A | 8530 | 8002 | 0 | 0 | 0.00% | 0.00% | 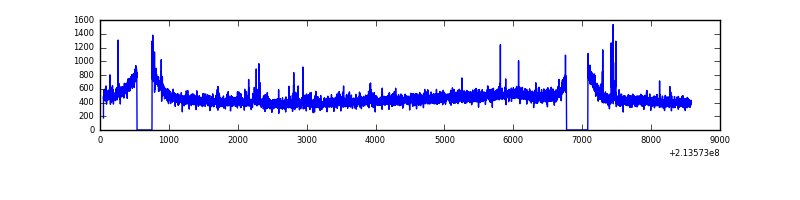 |
| B | 8530 | 8002 | 362 | 362 | 4.24% | 4.52% | 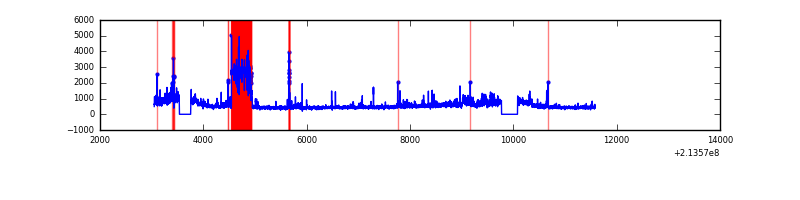 |
| C | 8530 | 8002 | 4 | 4 | 0.05% | 0.05% | 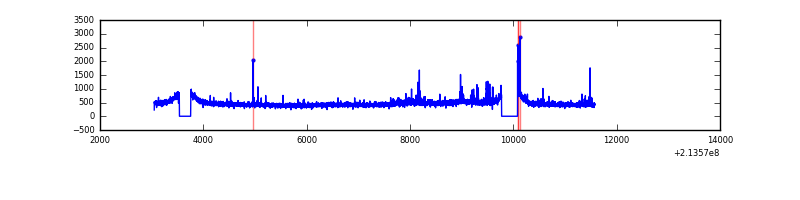 |
| D | 8530 | 8002 | 17 | 17 | 0.20% | 0.21% | 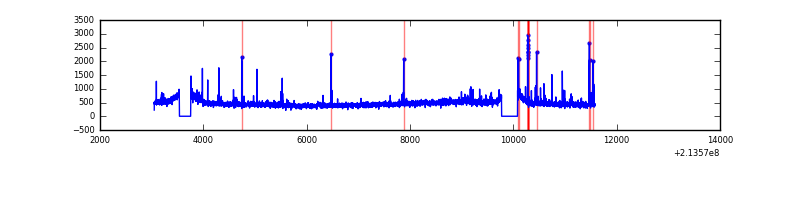 |
Top three noisy pixels from each quadrant. If the there are fewer than three noisy pixels in the level2.evt file, extra rows are filled as -1
| Pixel properties | Quadrant properties | ||||||
|---|---|---|---|---|---|---|---|
| Quadrant | DetID | PixID | Counts | Sigma | Mean | Median | Sigma |
| A | 10 | 133 | 28238 | 140.26 | 936 | 912 | 194.8 |
| A | 0 | 50 | 22916 | 112.95 | 936 | 912 | 194.8 |
| A | 8 | 15 | 21240 | 104.34 | 936 | 912 | 194.8 |
| B | 5 | 172 | 1053970 | 5876.86 | 921 | 896 | 179.2 |
| B | 15 | 204 | 532817 | 2968.47 | 921 | 896 | 179.2 |
| B | 10 | 245 | 70867 | 390.48 | 921 | 896 | 179.2 |
| C | 9 | 16 | 159741 | 742.59 | 917 | 922 | 213.9 |
| C | 1 | 16 | 23093 | 103.67 | 917 | 922 | 213.9 |
| C | 8 | 128 | 12183 | 52.65 | 917 | 922 | 213.9 |
| D | 8 | 195 | 194954 | 858.17 | 916 | 884 | 226.1 |
| D | 2 | 152 | 35928 | 154.96 | 916 | 884 | 226.1 |
| D | 2 | 14 | 29417 | 126.17 | 916 | 884 | 226.1 |
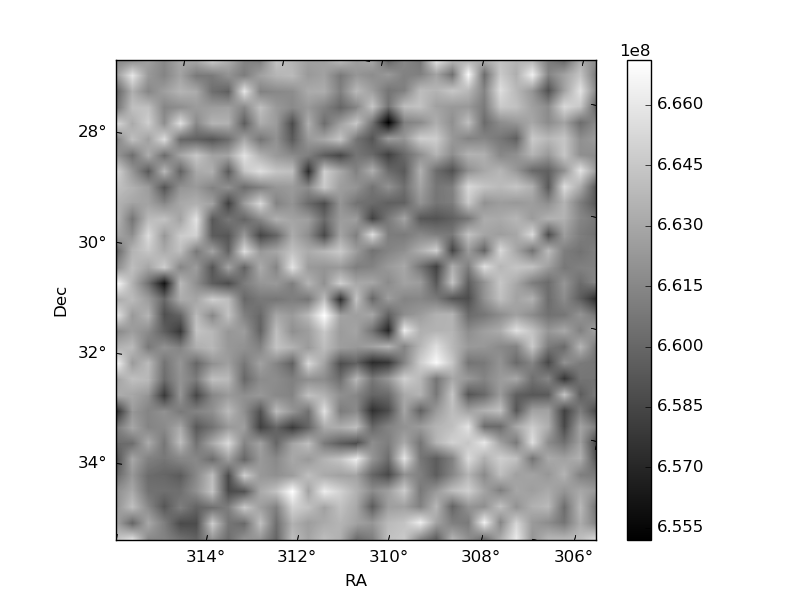
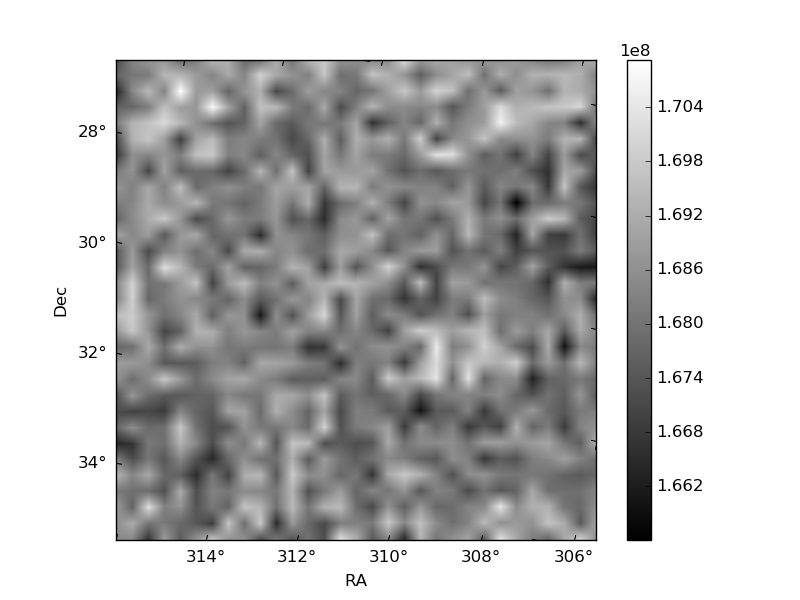
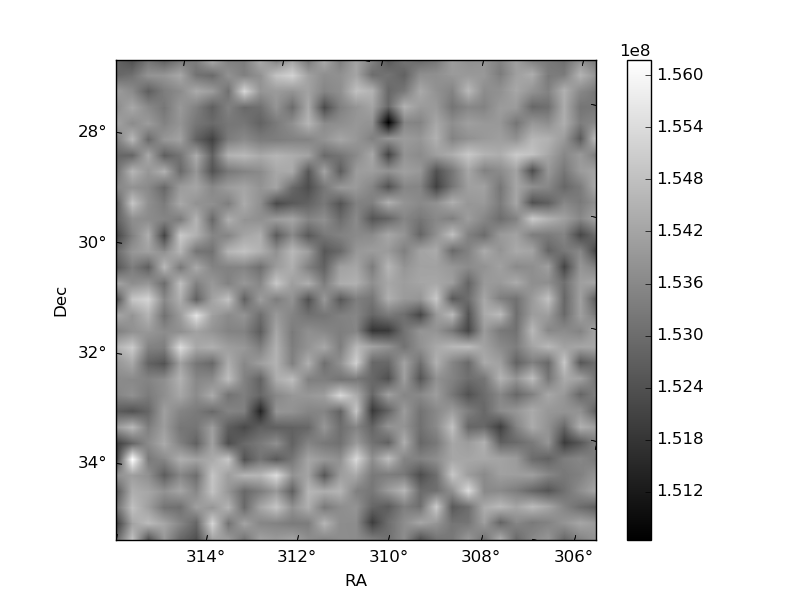
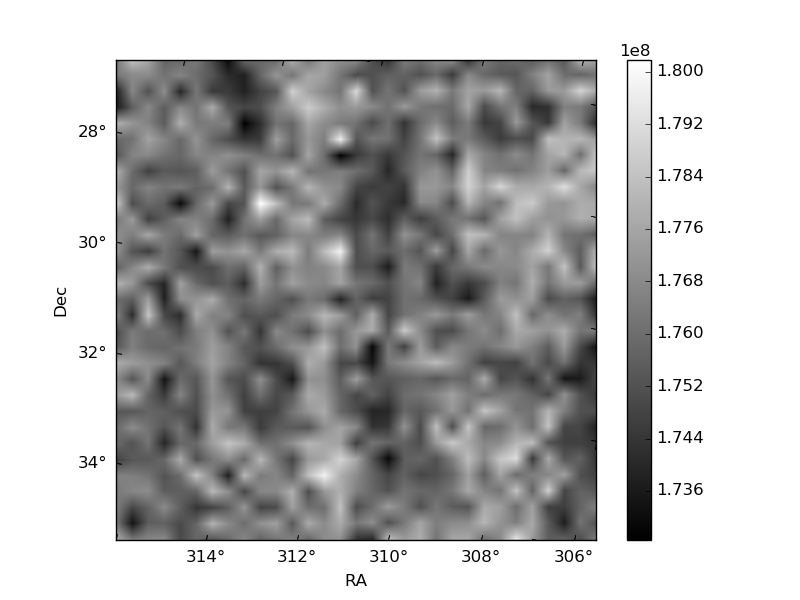
Histogram calculated using DETX and DETY for each event in the final _common_clean file
| Quadrant A | 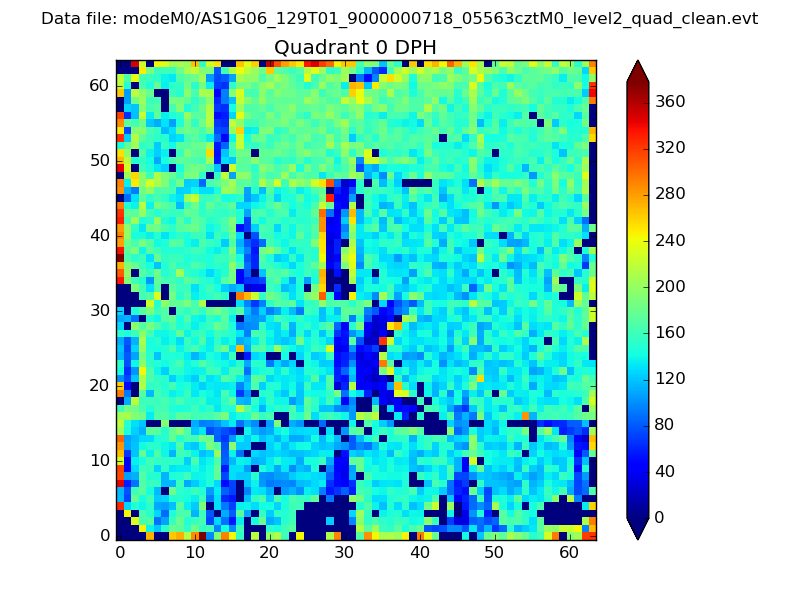 |
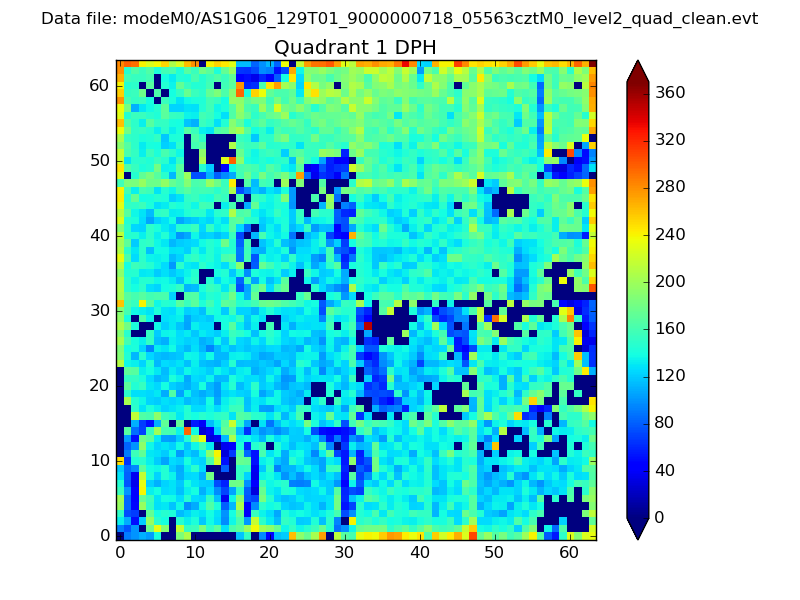 |
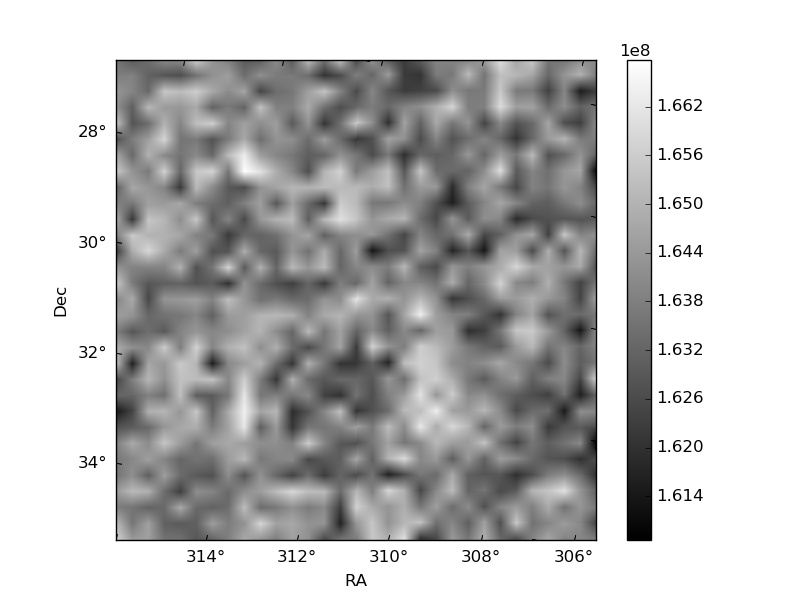
Quadrant B |
|---|---|---|---|
| Quadrant D | 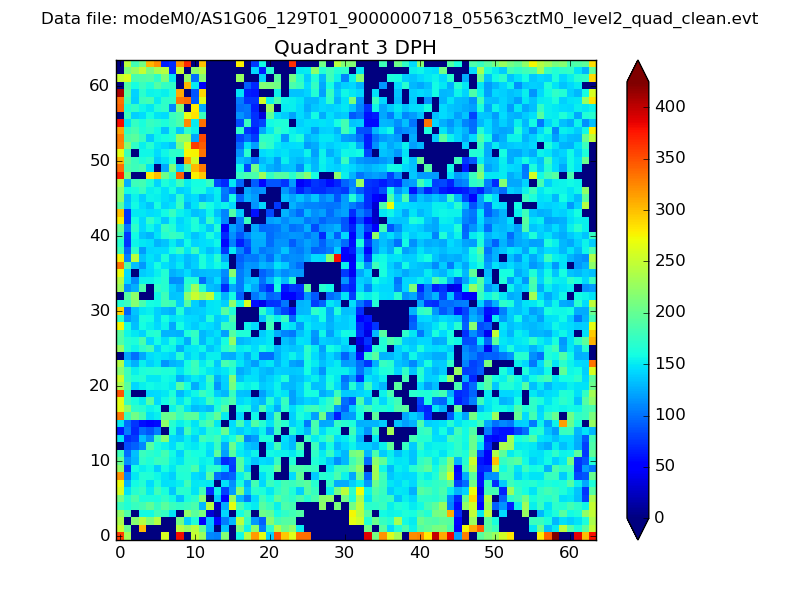 |
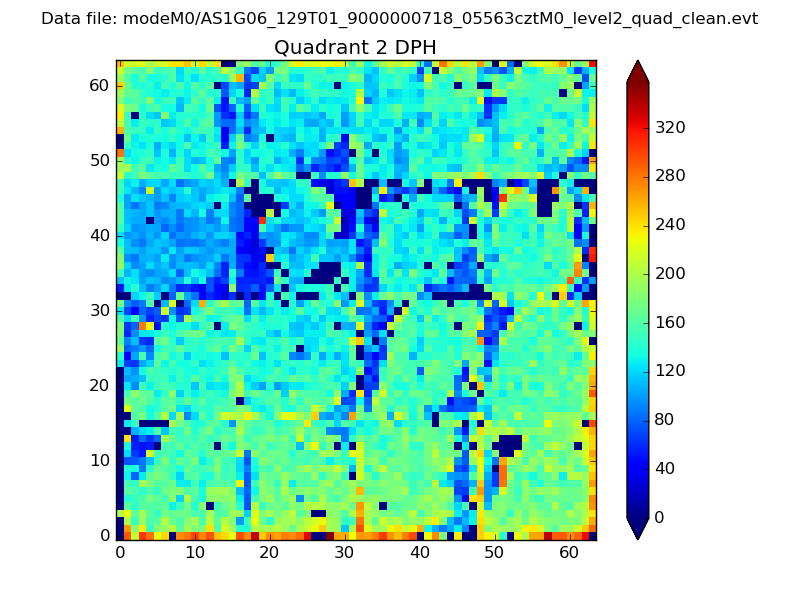 |
Quadrant C |
| Plot type | Count rate plots | Images |
|---|---|---|
| Comparison with Poisson distribution Blue bars denote a histogram of data divided into 1 sec bins. Red curve is a Poisson curve with rate = median count rate of data. |
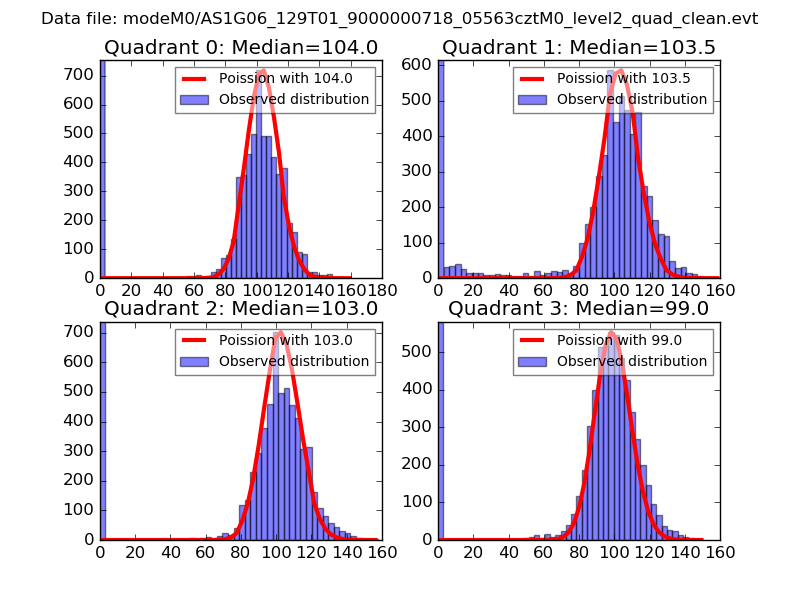 |
 |
| Quadrant-wise count rates Data is divided into 100 sec bins |
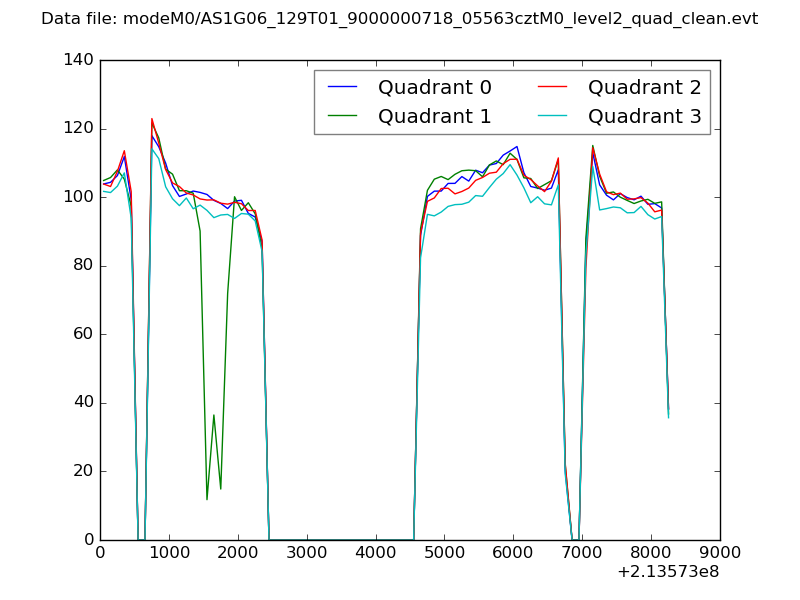 |
|
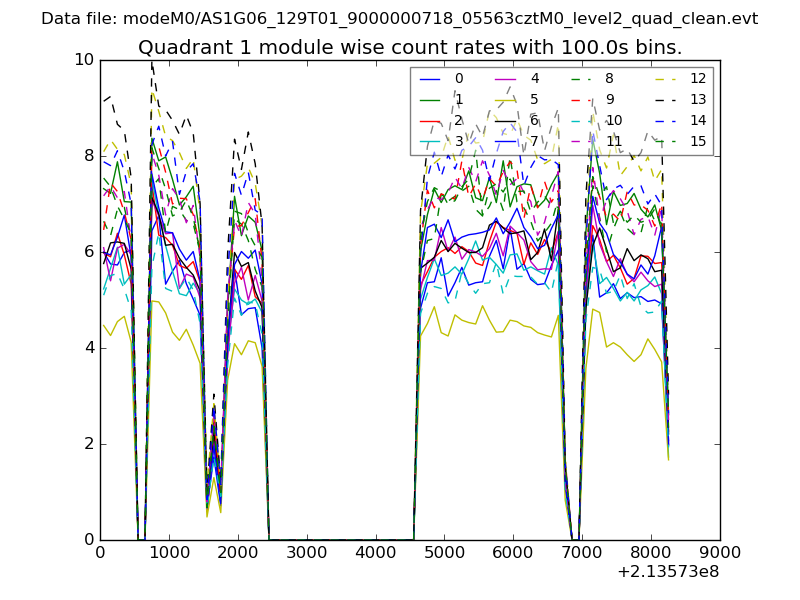
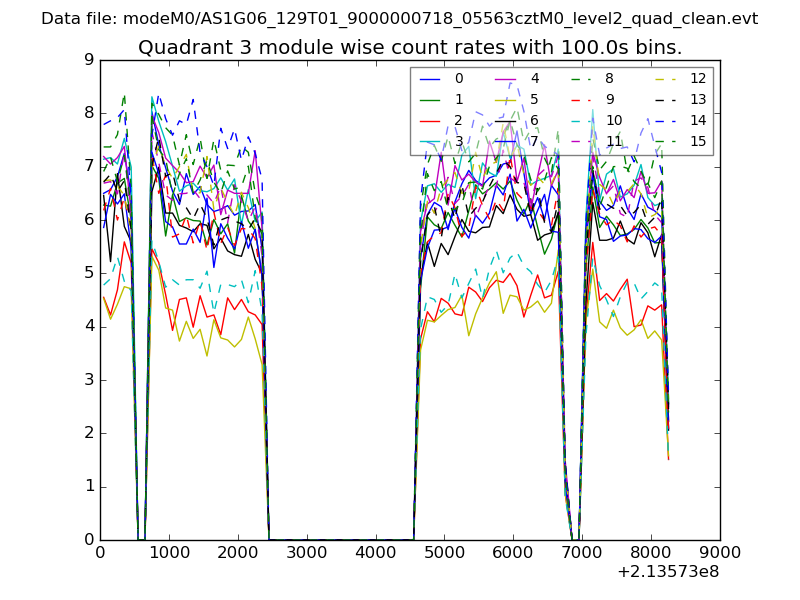
| Module-wise count rates for Quadrant A Data is divided into 100 sec bins |
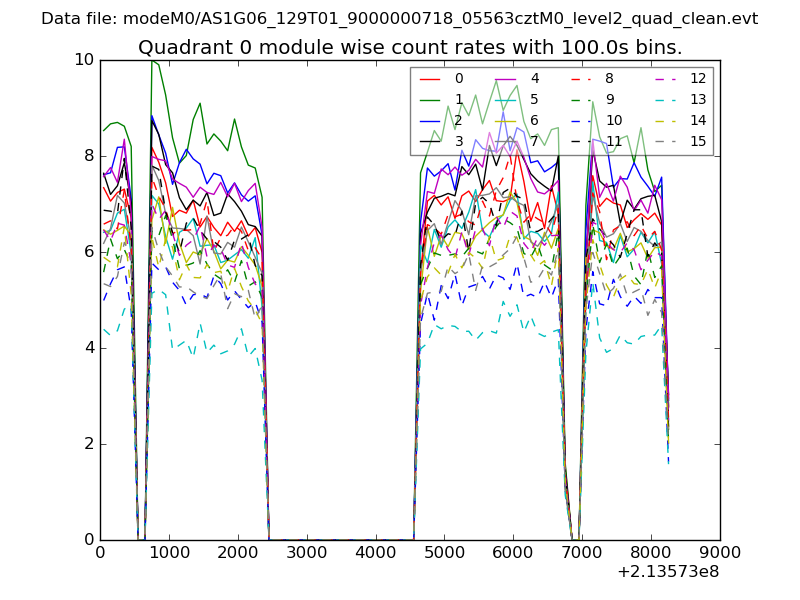 |
 |
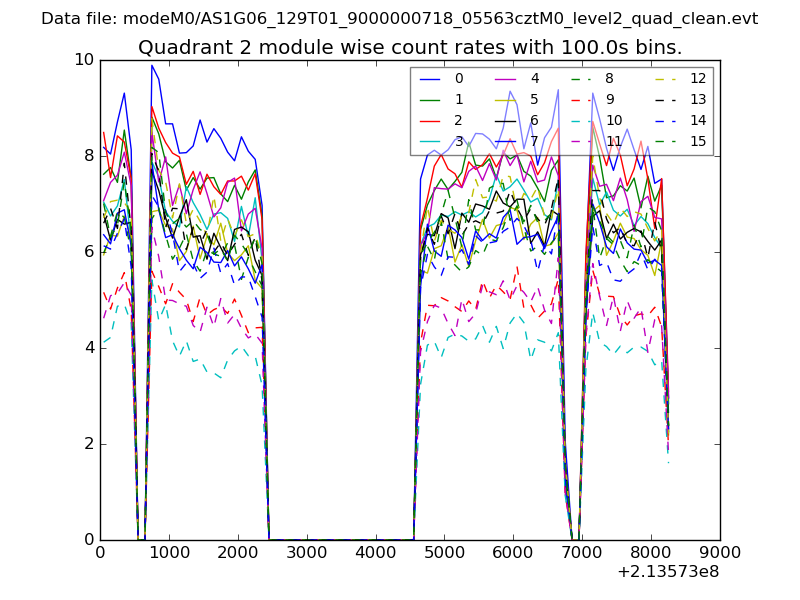
| Module-wise count rates for Quadrant B Data is divided into 100 sec bins |
 |
 |
| Module-wise count rates for Quadrant C Data is divided into 100 sec bins |
 |
 |
| Module-wise count rates for Quadrant D Data is divided into 100 sec bins |
 |
 |
| Parameter | Plot |
|---|---|
| CZT HV Monitor | 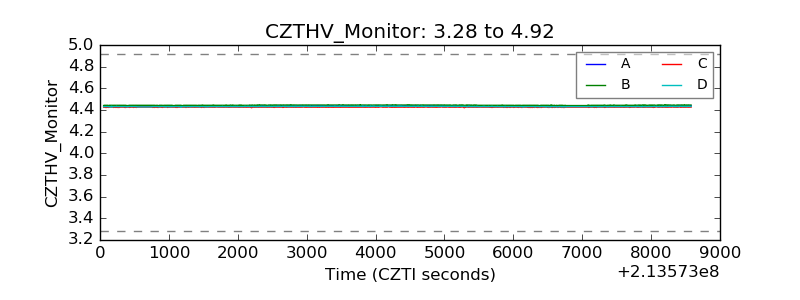 |
| D_VDD | 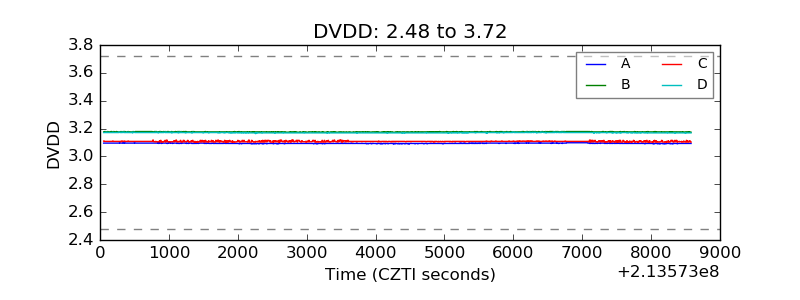 |
| Temperature 1 | 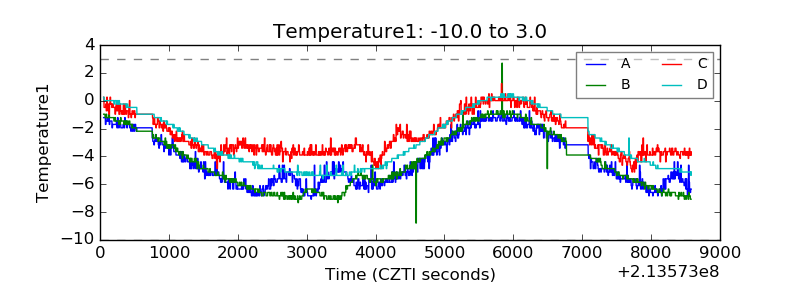 |
| Veto HV Monitor | 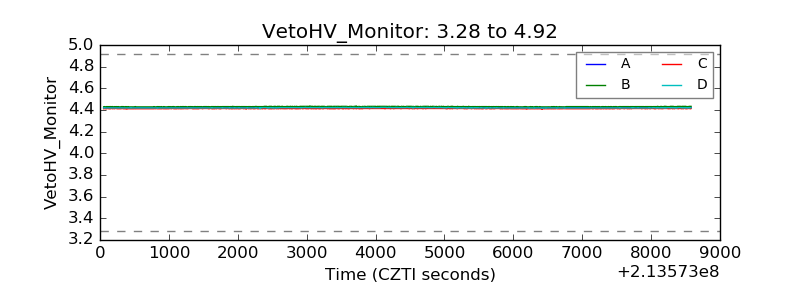 |
| Veto LLD | 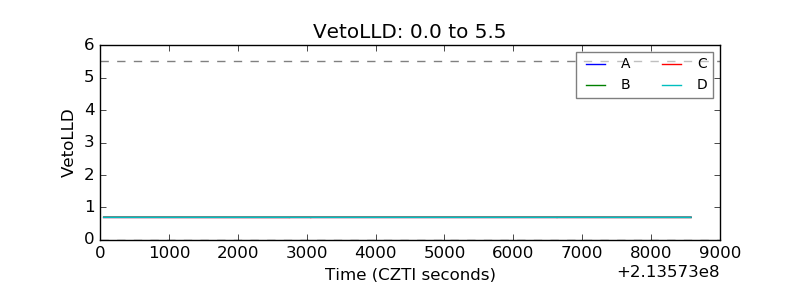 |
| Alpha Counter | 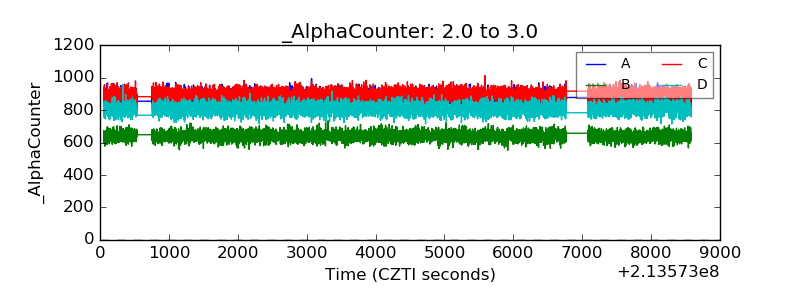 |
| _CPM_Rate | 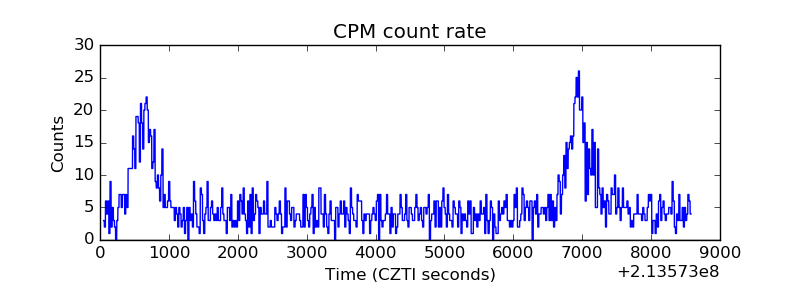 |
| CZT Counter | 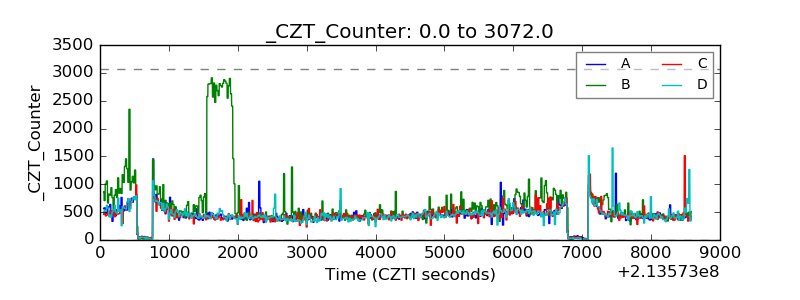 |
| +2.5 Volts monitor | 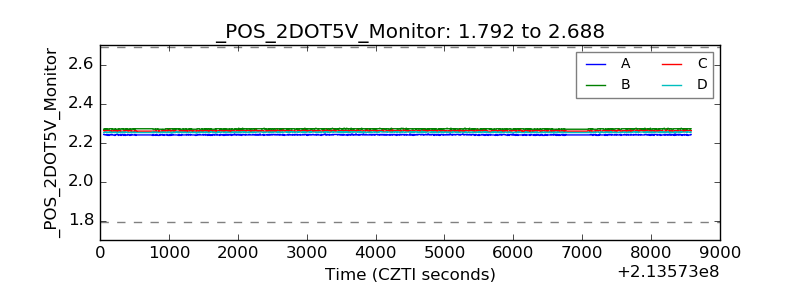 |
| +5 Volts monitor |  |
| _ROLL_ROT | 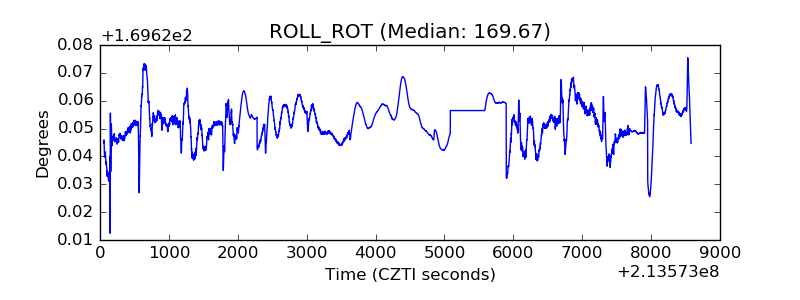 |
| _Roll_DEC |  |
| _Roll_RA | 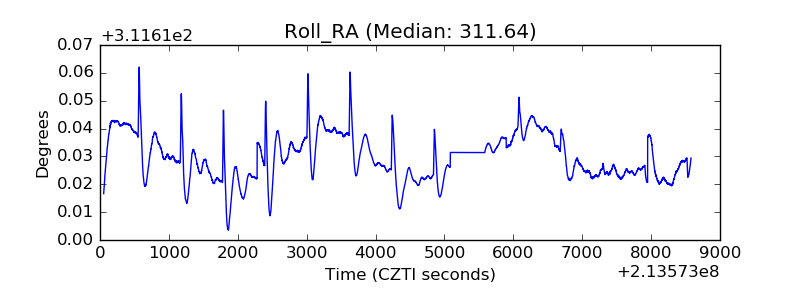 |
| Veto Counter | 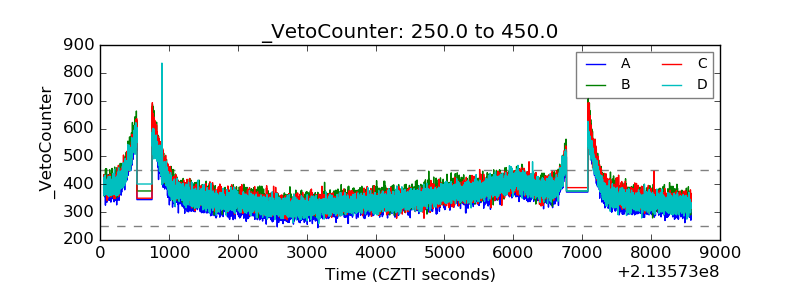 |