| Param | Original file | Final file |
|---|---|---|
| Filename | modeM0/AS1G06_129T01_9000000718_05566cztM0_level2.evt | modeM0/AS1G06_129T01_9000000718_05566cztM0_level2_quad_clean.evt |
| Size (bytes) | 1,406,554,560 | 202,351,680 |
| Size | 1.3 GB | 193.0 MB |
| Events in quadrant A | 9,183,398 | 1,203,695 |
| Events in quadrant B | 11,264,440 | 1,213,189 |
| Events in quadrant C | 11,045,225 | 1,198,259 |
| Events in quadrant D | 9,768,923 | 1,150,957 |
| Mode SS | |||
|---|---|---|---|
| Quadrant | BADHDUFLAG | Total packets | Discarded packets |
| A | 0 | 406 | 0 |
| B | 0 | 406 | 0 |
| C | 0 | 406 | 0 |
| D | 0 | 406 | 0 |
| Mode M0 | |||
|---|---|---|---|
| Quadrant | BADHDUFLAG | Total packets | Discarded packets |
| A | 0 | 40928 | 65 |
| B | 0 | 46985 | 80 |
| C | 0 | 46419 | 65 |
| D | 0 | 43042 | 87 |
| Mode M9 | |||
|---|---|---|---|
| Quadrant | BADHDUFLAG | Total packets | Discarded packets |
| A | 0 | 21 | 0 |
| B | 0 | 21 | 0 |
| C | 0 | 21 | 0 |
| D | 0 | 21 | 0 |
| Quadrant | Total seconds | Saturated seconds | Saturation percentage |
|---|---|---|---|
| A | 19759 | 202 | 1.022319% |
| B | 19758 | 346 | 1.751189% |
| C | 19764 | 302 | 1.528031% |
| D | 19753 | 221 | 1.118817% |
Noise dominated data is calculated using 1-second bins in cleaned event files. If a bin has >2000 counts, and if more than 50% of those come from <1% of pixels, then it is considered to be noise-dominated and hence unusable.
| Quadrant | # 1 sec bins | Bins with >0 counts | Bins with >2000 counts | High rate bins dominated by noise | Noise dominated (total time) | Noise dominated (detector-on time) | Marked lightcurve |
|---|---|---|---|---|---|---|---|
| A | 21923 | 19790 | 38 | 38 | 0.17% | 0.19% | 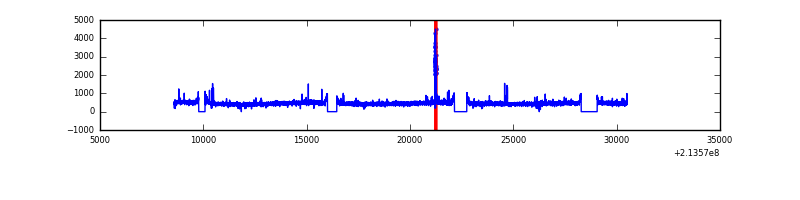 |
| B | 21923 | 19792 | 84 | 84 | 0.38% | 0.42% | 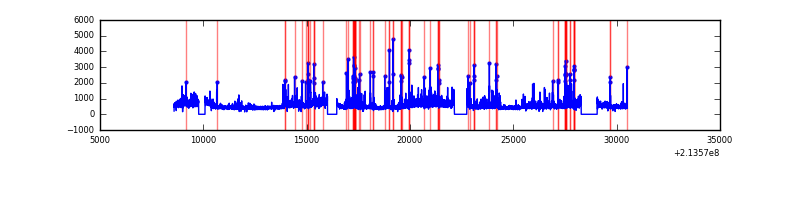 |
| C | 21923 | 19792 | 113 | 113 | 0.52% | 0.57% | 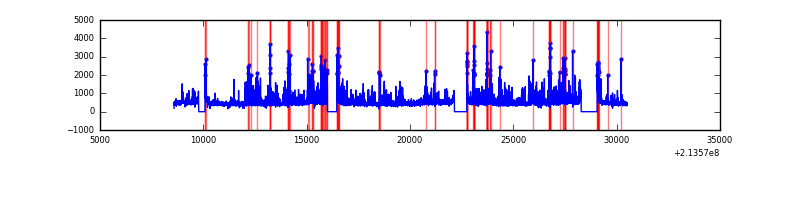 |
| D | 21923 | 19792 | 106 | 106 | 0.48% | 0.54% | 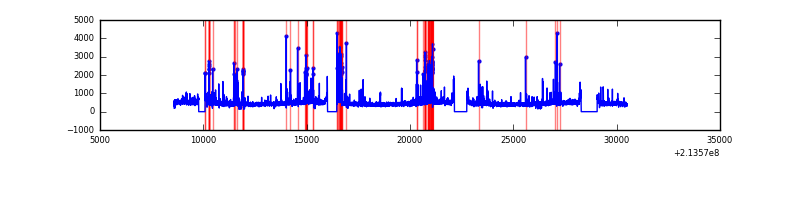 |
Top three noisy pixels from each quadrant. If the there are fewer than three noisy pixels in the level2.evt file, extra rows are filled as -1
| Pixel properties | Quadrant properties | ||||||
|---|---|---|---|---|---|---|---|
| Quadrant | DetID | PixID | Counts | Sigma | Mean | Median | Sigma |
| A | 0 | 50 | 198243 | 416.71 | 2298 | 2240 | 470.4 |
| A | 8 | 15 | 46016 | 93.07 | 2298 | 2240 | 470.4 |
| A | 13 | 14 | 39616 | 79.46 | 2298 | 2240 | 470.4 |
| B | 15 | 204 | 943469 | 2121.97 | 2320 | 2262 | 443.6 |
| B | 11 | 51 | 358549 | 803.25 | 2320 | 2262 | 443.6 |
| B | 10 | 16 | 336945 | 754.55 | 2320 | 2262 | 443.6 |
| C | 9 | 16 | 2217766 | 4268.25 | 2234 | 2240 | 519.1 |
| C | 1 | 16 | 55389 | 102.39 | 2234 | 2240 | 519.1 |
| C | 8 | 128 | 25323 | 44.47 | 2234 | 2240 | 519.1 |
| D | 2 | 152 | 754180 | 1375.1 | 2234 | 2161 | 546.9 |
| D | 8 | 195 | 334594 | 607.87 | 2234 | 2161 | 546.9 |
| D | 2 | 14 | 87918 | 156.81 | 2234 | 2161 | 546.9 |
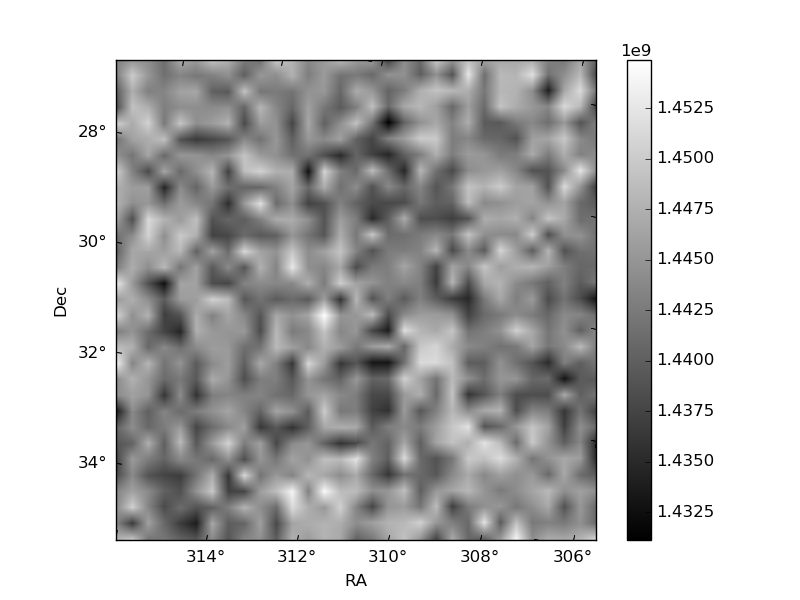
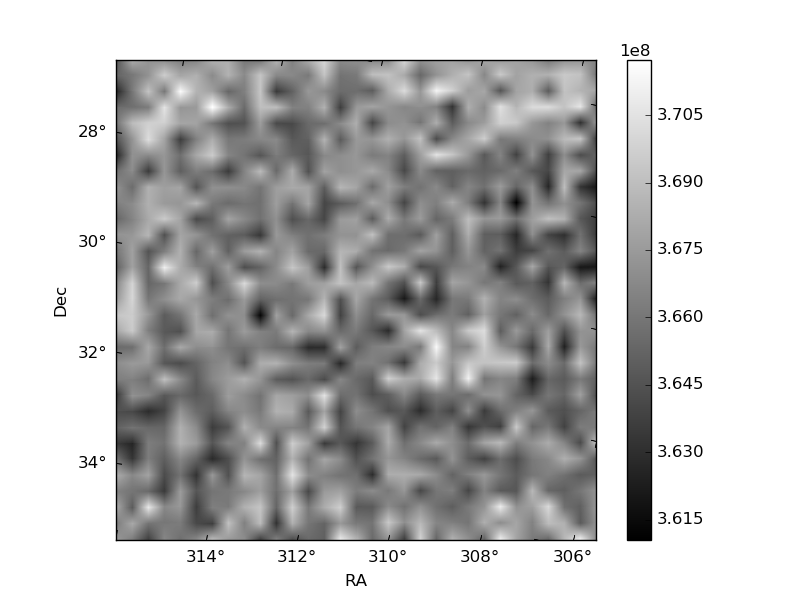
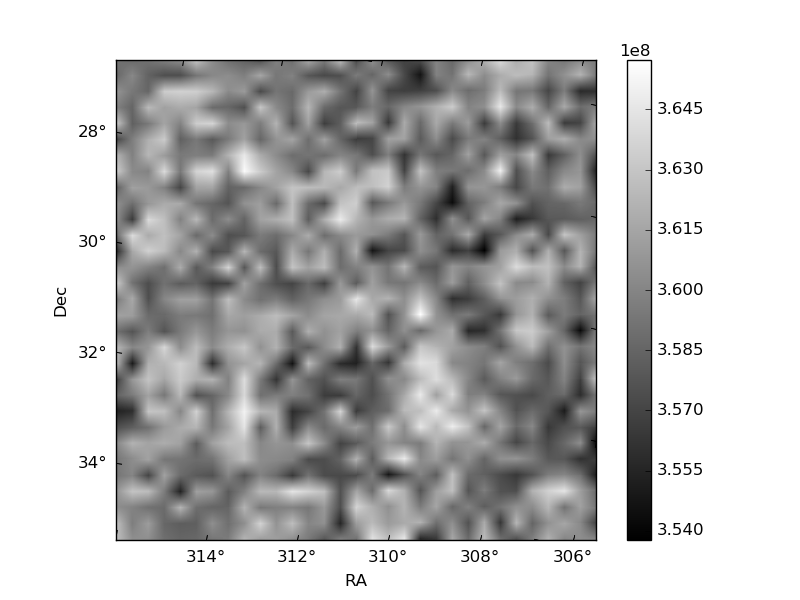
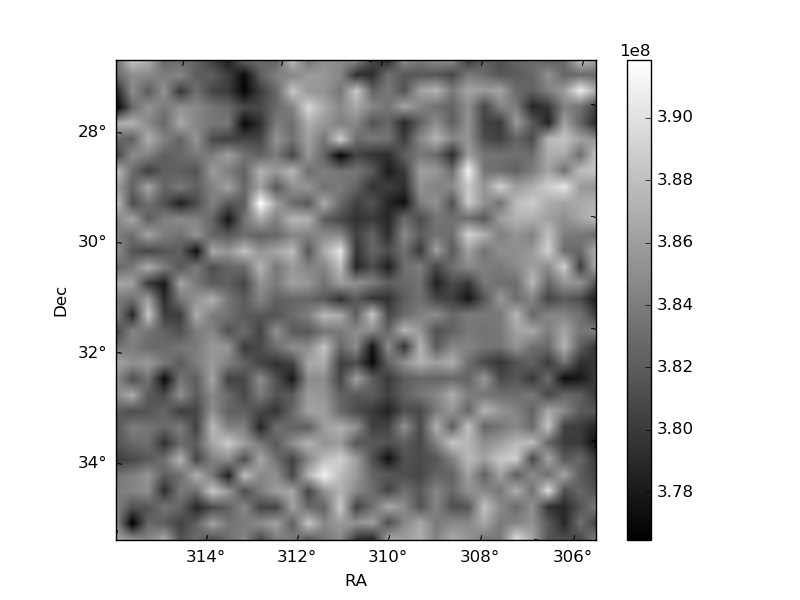
Histogram calculated using DETX and DETY for each event in the final _common_clean file
| Quadrant A | 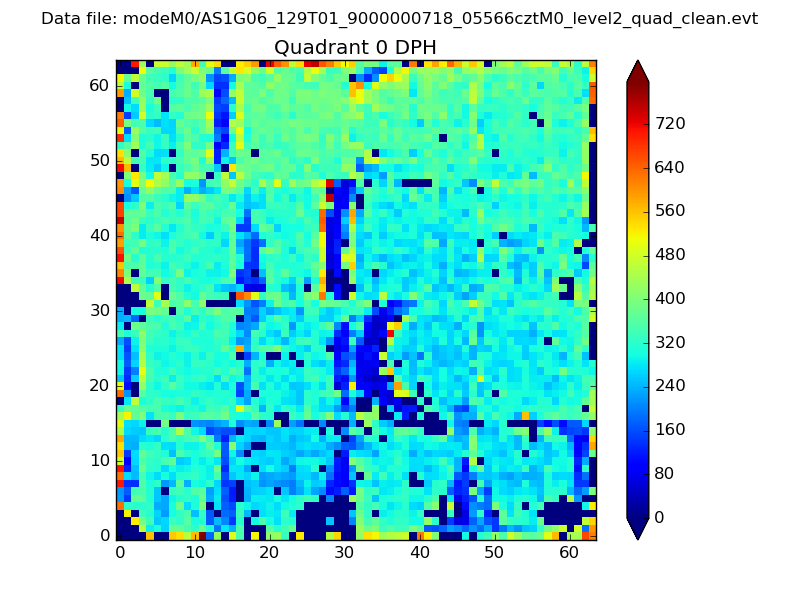 |
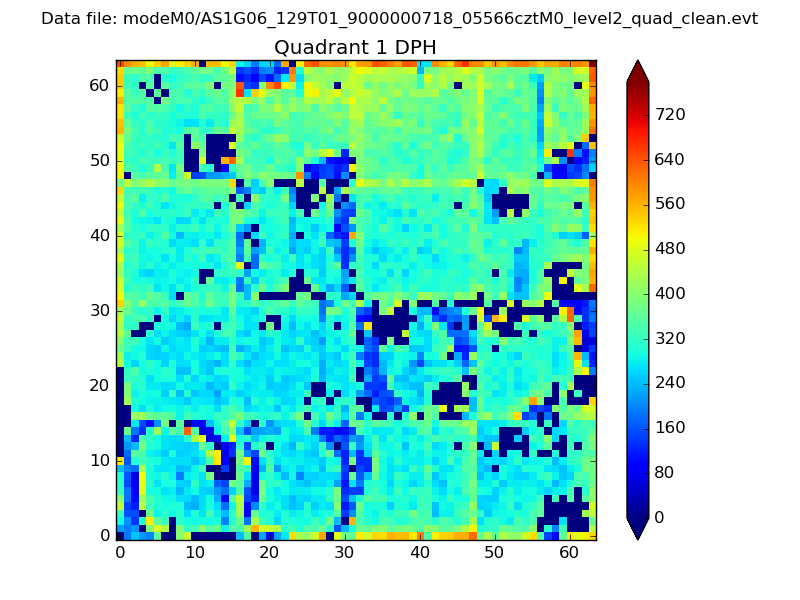 |
Quadrant B |
|---|---|---|---|
| Quadrant D | 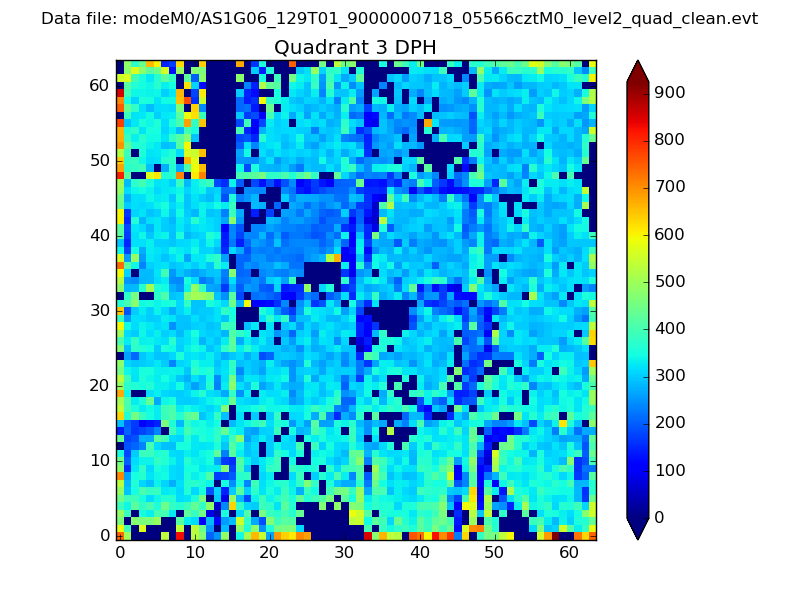 |
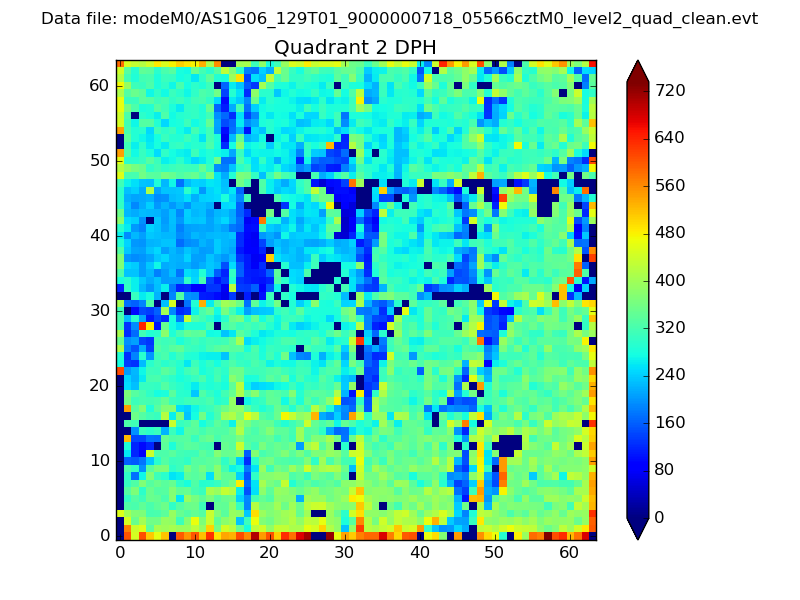 |
Quadrant C |
| Plot type | Count rate plots | Images |
|---|---|---|
| Comparison with Poisson distribution Blue bars denote a histogram of data divided into 1 sec bins. Red curve is a Poisson curve with rate = median count rate of data. |
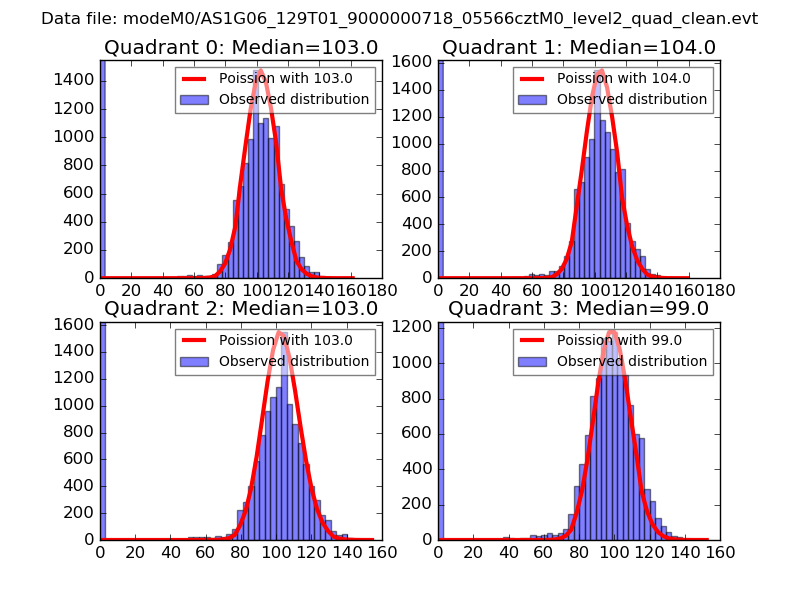 |
 |
| Quadrant-wise count rates Data is divided into 100 sec bins |
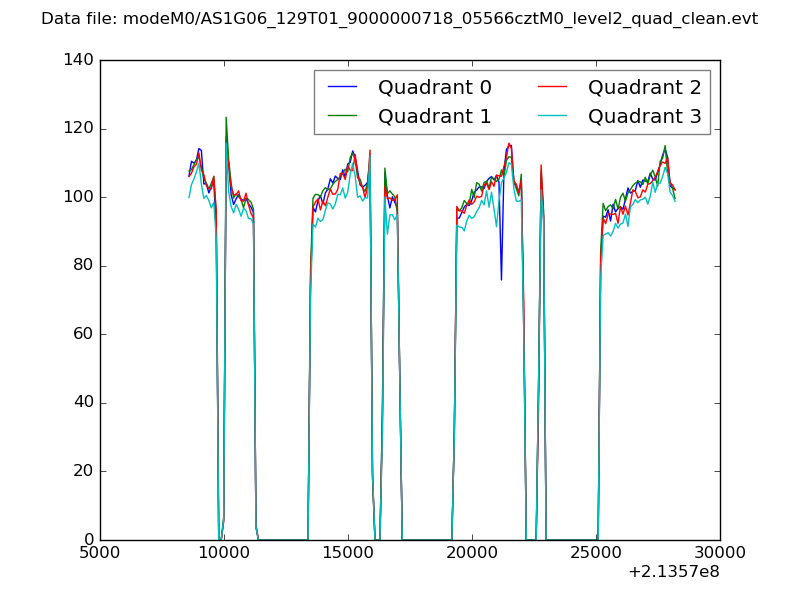 |
|
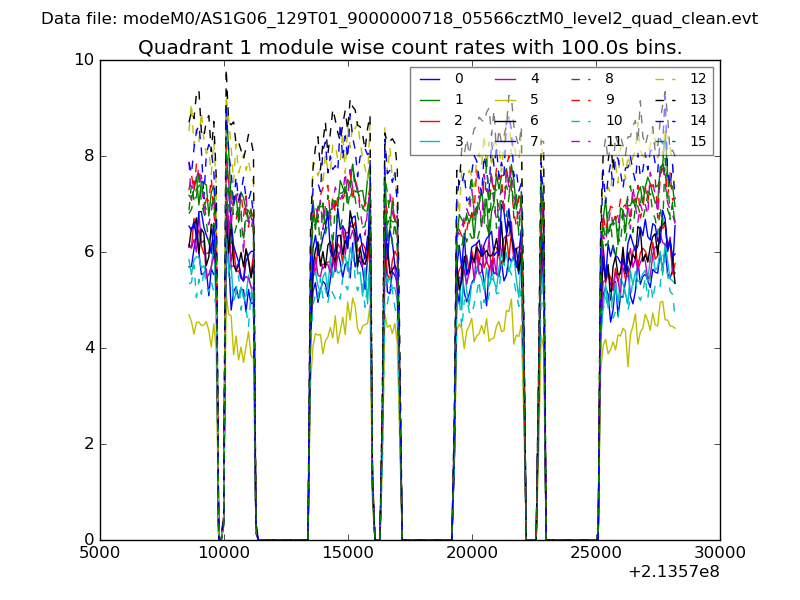
| Module-wise count rates for Quadrant A Data is divided into 100 sec bins |
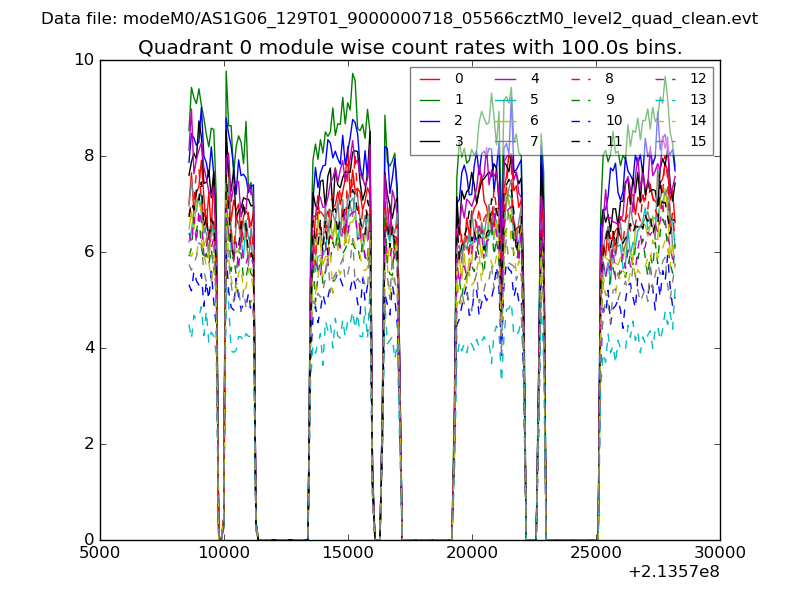 |
 |
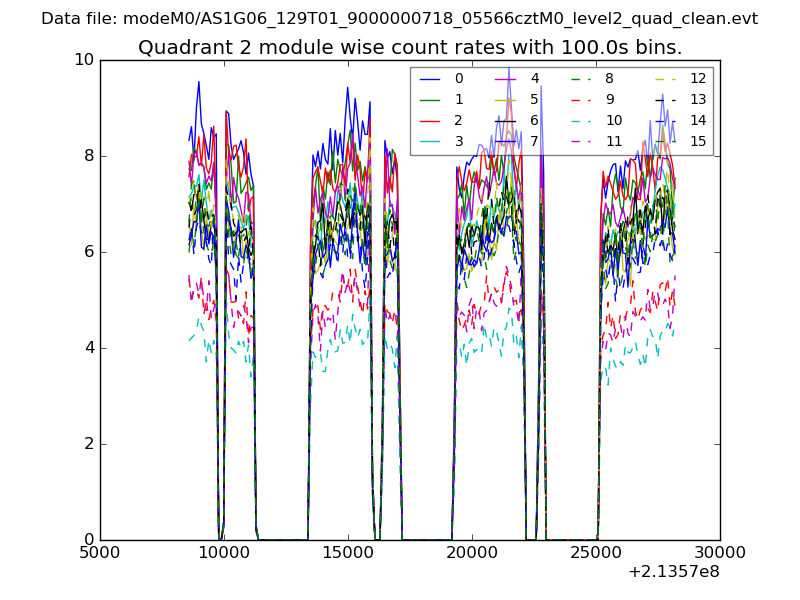
| Module-wise count rates for Quadrant B Data is divided into 100 sec bins |
 |
 |
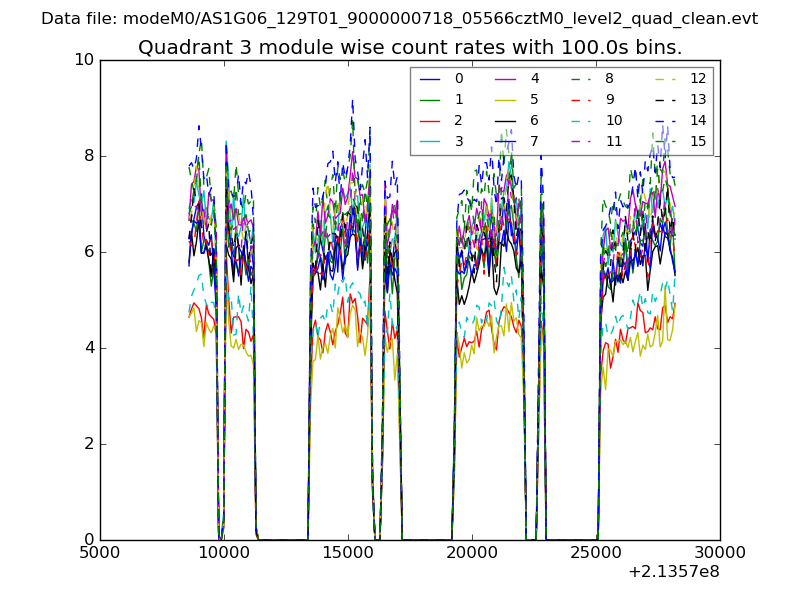
| Module-wise count rates for Quadrant C Data is divided into 100 sec bins |
 |
 |
| Module-wise count rates for Quadrant D Data is divided into 100 sec bins |
 |
 |
| Parameter | Plot |
|---|---|
| CZT HV Monitor | 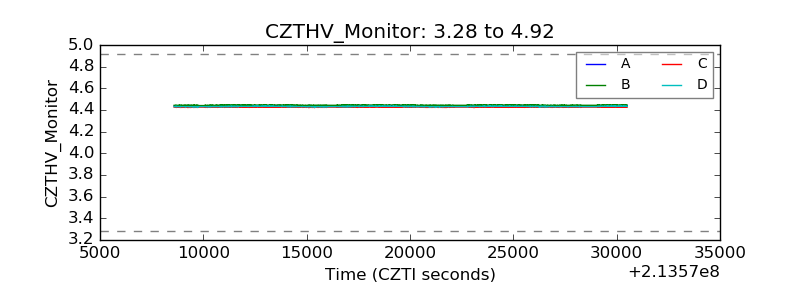 |
| D_VDD | 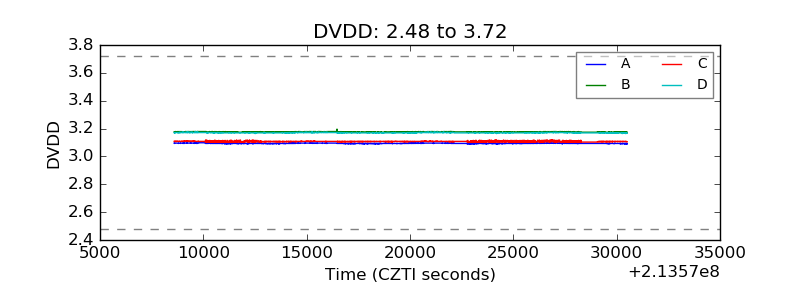 |
| Temperature 1 | 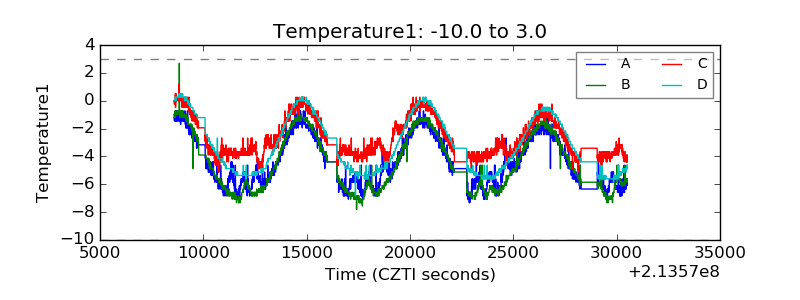 |
| Veto HV Monitor | 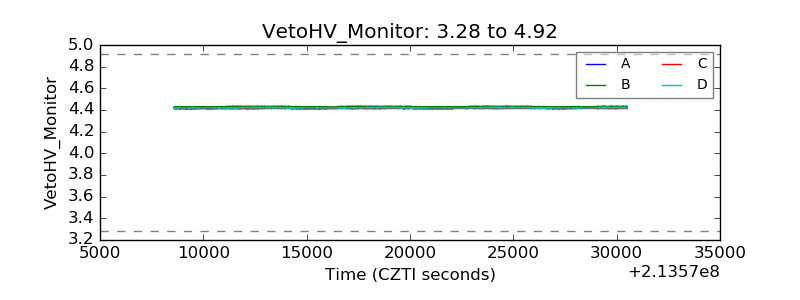 |
| Veto LLD | 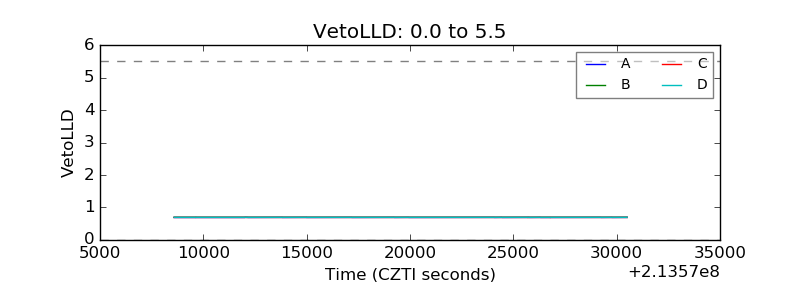 |
| Alpha Counter | 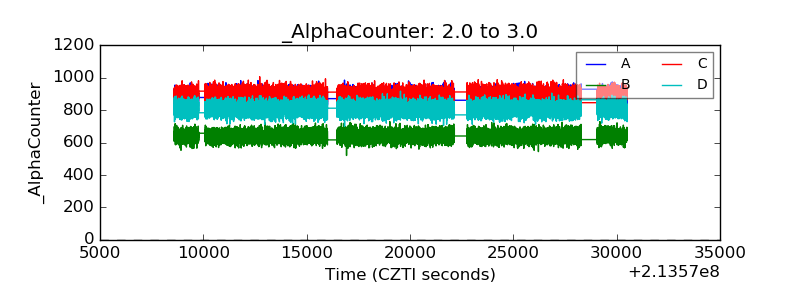 |
| _CPM_Rate | 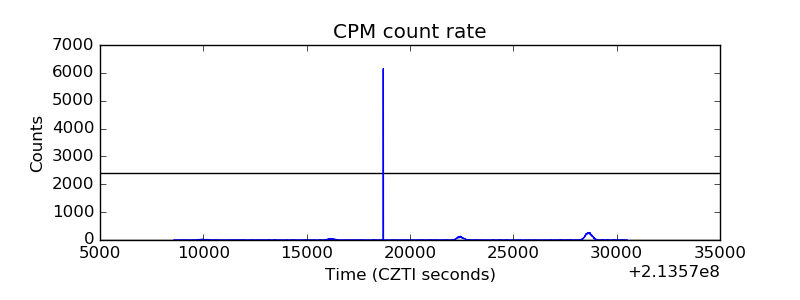 |
| CZT Counter | 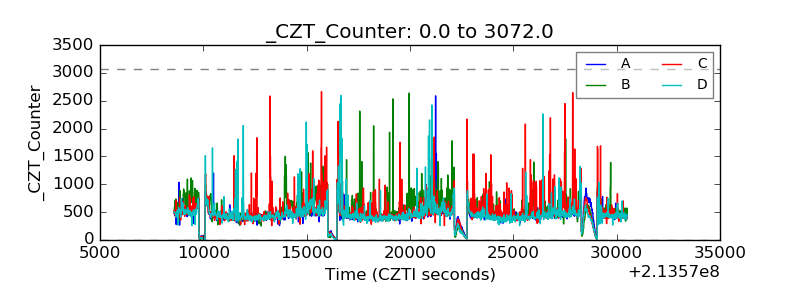 |
| +2.5 Volts monitor |  |
| +5 Volts monitor |  |
| _ROLL_ROT |  |
| _Roll_DEC |  |
| _Roll_RA | 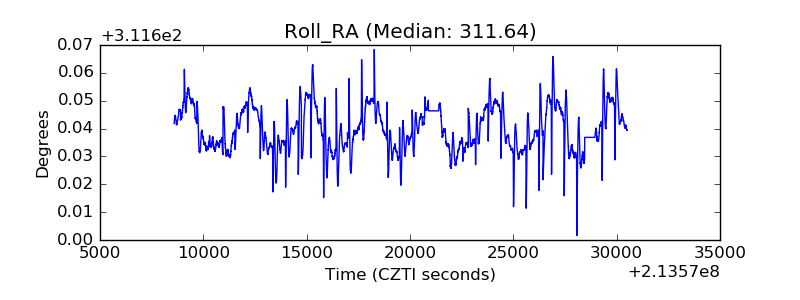 |
| Veto Counter | 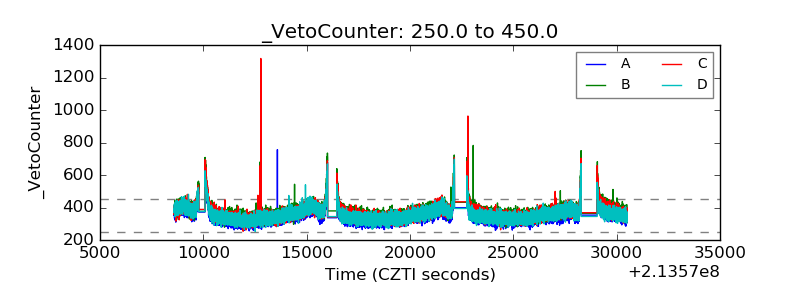 |