| Param | Original file | Final file |
|---|---|---|
| Filename | modeM0/AS1G06_129T01_9000000718_05567cztM0_level2.evt | modeM0/AS1G06_129T01_9000000718_05567cztM0_level2_quad_clean.evt |
| Size (bytes) | 466,776,000 | 60,733,440 |
| Size | 445.2 MB | 57.9 MB |
| Events in quadrant A | 3,155,211 | 343,898 |
| Events in quadrant B | 3,492,589 | 346,995 |
| Events in quadrant C | 3,716,794 | 342,519 |
| Events in quadrant D | 3,306,721 | 328,486 |
| Mode SS | |||
|---|---|---|---|
| Quadrant | BADHDUFLAG | Total packets | Discarded packets |
| A | 0 | 140 | 0 |
| B | 0 | 140 | 0 |
| C | 0 | 140 | 0 |
| D | 0 | 140 | 0 |
| Mode M0 | |||
|---|---|---|---|
| Quadrant | BADHDUFLAG | Total packets | Discarded packets |
| A | 0 | 13994 | 41 |
| B | 0 | 14668 | 58 |
| C | 0 | 15630 | 72 |
| D | 0 | 14547 | 54 |
| Mode M9 | |||
|---|---|---|---|
| Quadrant | BADHDUFLAG | Total packets | Discarded packets |
| A | 0 | 9 | 1 |
| B | 0 | 9 | 0 |
| C | 0 | 9 | 0 |
| D | 0 | 10 | 0 |
| Quadrant | Total seconds | Saturated seconds | Saturation percentage |
|---|---|---|---|
| A | 6845 | 53 | 0.774288% |
| B | 6837 | 76 | 1.111599% |
| C | 6832 | 106 | 1.551522% |
| D | 6838 | 67 | 0.979819% |
Noise dominated data is calculated using 1-second bins in cleaned event files. If a bin has >2000 counts, and if more than 50% of those come from <1% of pixels, then it is considered to be noise-dominated and hence unusable.
| Quadrant | # 1 sec bins | Bins with >0 counts | Bins with >2000 counts | High rate bins dominated by noise | Noise dominated (total time) | Noise dominated (detector-on time) | Marked lightcurve |
|---|---|---|---|---|---|---|---|
| A | 7779 | 6865 | 0 | 0 | 0.00% | 0.00% | 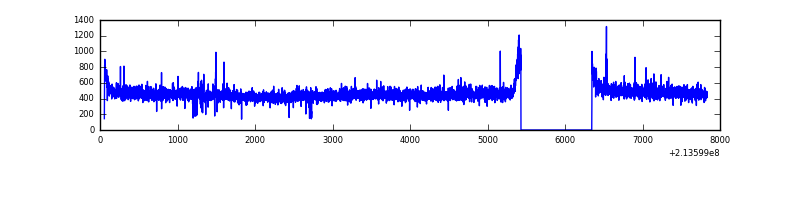 |
| B | 7779 | 6865 | 7 | 7 | 0.09% | 0.10% | 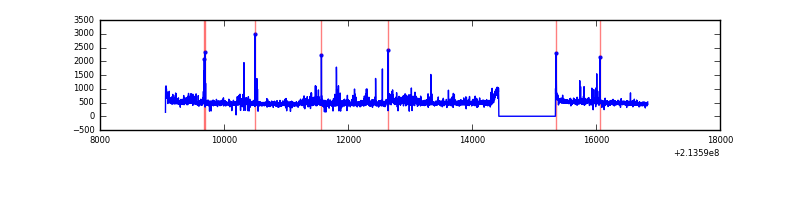 |
| C | 7779 | 6863 | 35 | 35 | 0.45% | 0.51% | 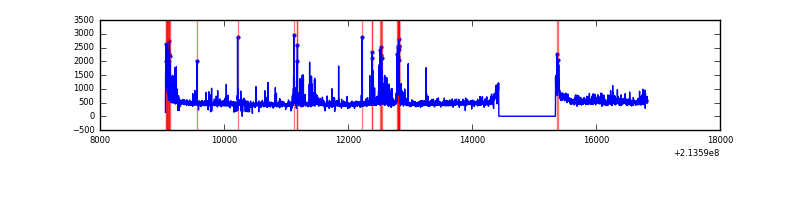 |
| D | 7779 | 6864 | 15 | 15 | 0.19% | 0.22% | 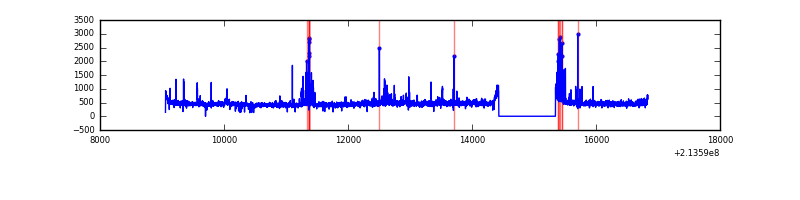 |
Top three noisy pixels from each quadrant. If the there are fewer than three noisy pixels in the level2.evt file, extra rows are filled as -1
| Pixel properties | Quadrant properties | ||||||
|---|---|---|---|---|---|---|---|
| Quadrant | DetID | PixID | Counts | Sigma | Mean | Median | Sigma |
| A | 13 | 14 | 22265 | 128.57 | 807 | 787 | 167.1 |
| A | 7 | 16 | 11882 | 66.41 | 807 | 787 | 167.1 |
| A | 10 | 133 | 8903 | 48.58 | 807 | 787 | 167.1 |
| B | 15 | 204 | 126308 | 800.56 | 816 | 796 | 156.8 |
| B | 11 | 51 | 104230 | 659.74 | 816 | 796 | 156.8 |
| B | 10 | 245 | 48826 | 306.35 | 816 | 796 | 156.8 |
| C | 9 | 16 | 441239 | 2426.99 | 778 | 781 | 181.5 |
| C | 1 | 16 | 143958 | 788.93 | 778 | 781 | 181.5 |
| C | 1 | 241 | 91504 | 499.9 | 778 | 781 | 181.5 |
| D | 2 | 136 | 169312 | 879.78 | 779 | 755 | 191.6 |
| D | 8 | 195 | 107497 | 557.14 | 779 | 755 | 191.6 |
| D | 2 | 152 | 36386 | 185.97 | 779 | 755 | 191.6 |
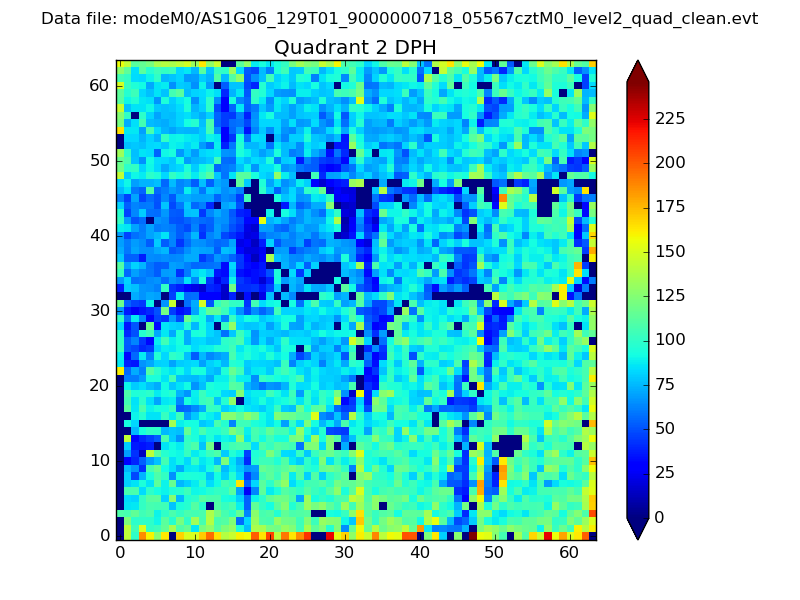
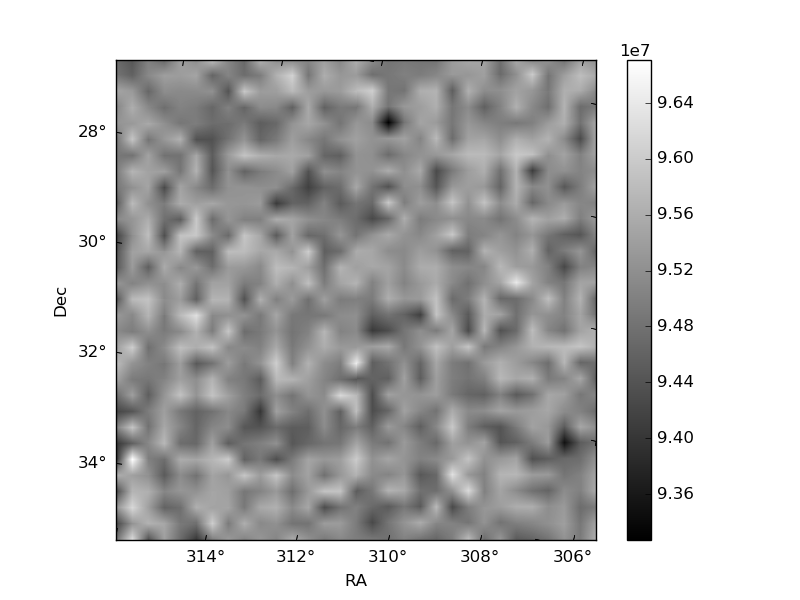
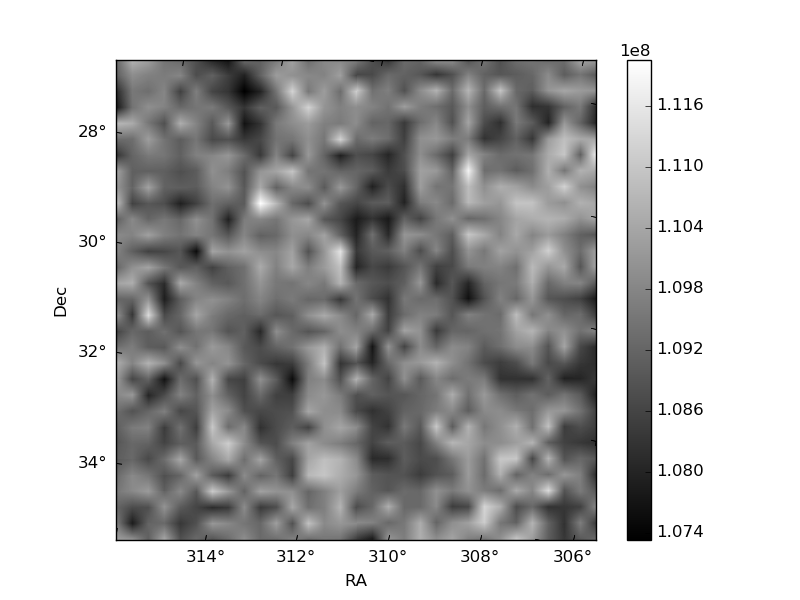
Histogram calculated using DETX and DETY for each event in the final _common_clean file
| Quadrant A | 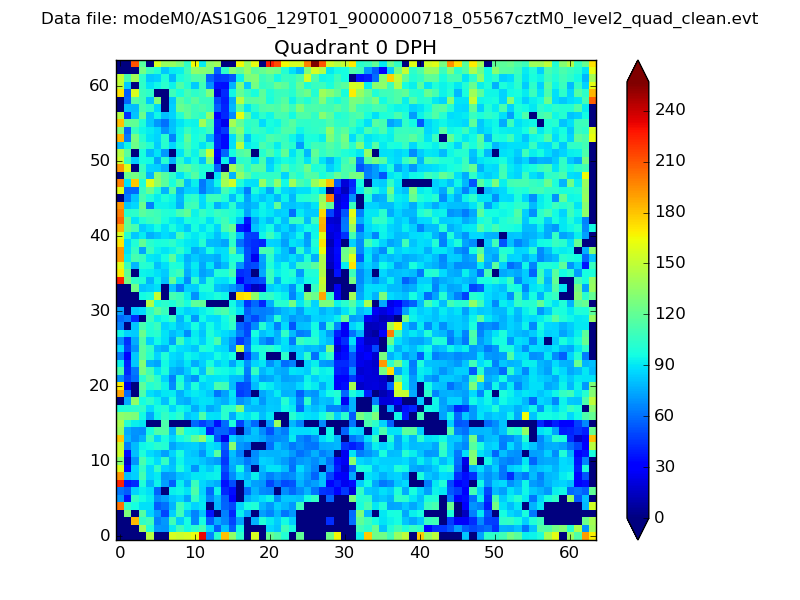 |
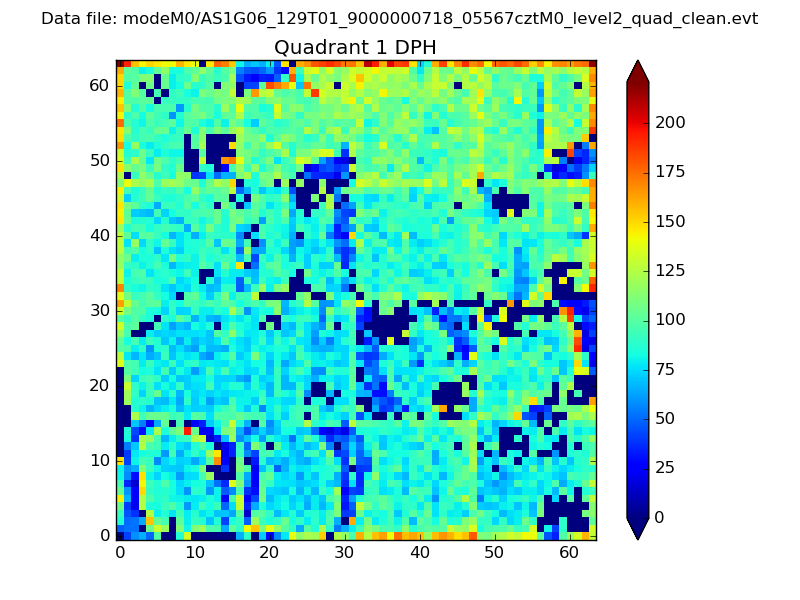 |
Quadrant B |
|---|---|---|---|
| Quadrant D | 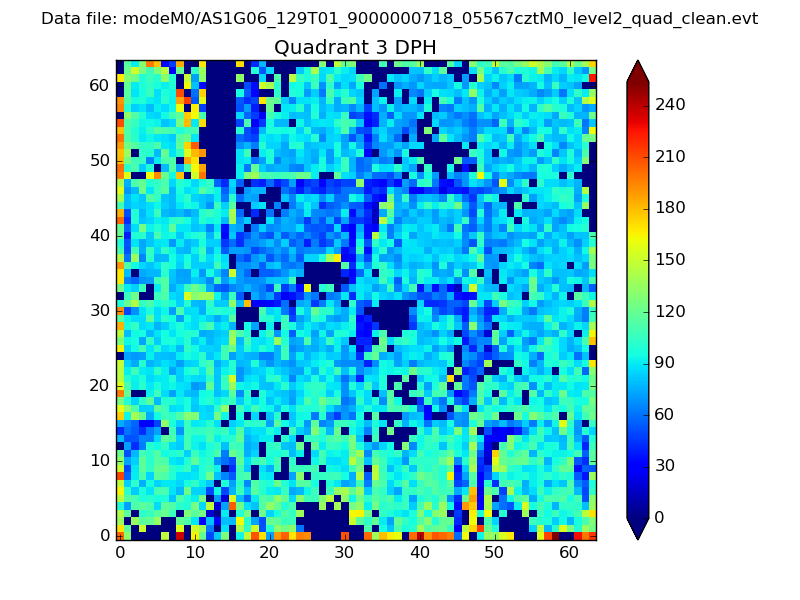 |
 |
Quadrant C |
| Plot type | Count rate plots | Images |
|---|---|---|
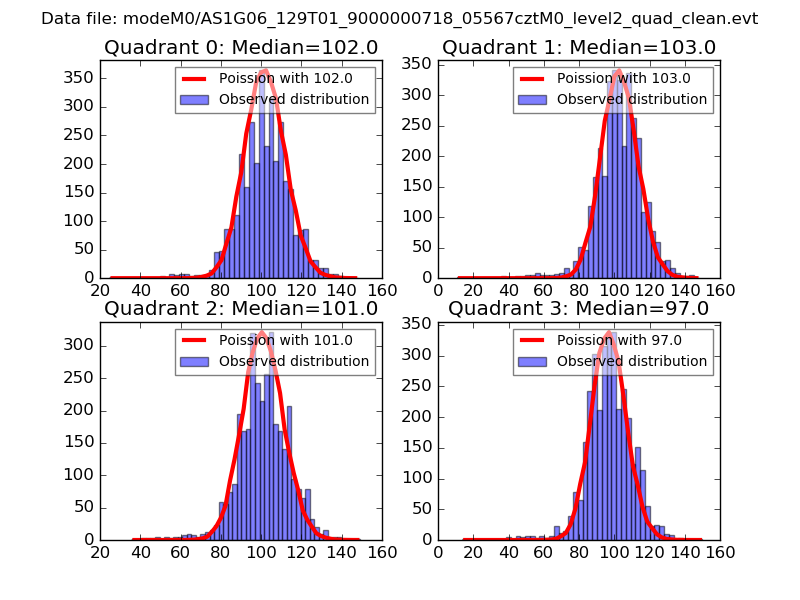
| Comparison with Poisson distribution Blue bars denote a histogram of data divided into 1 sec bins. Red curve is a Poisson curve with rate = median count rate of data. |
 |
 |
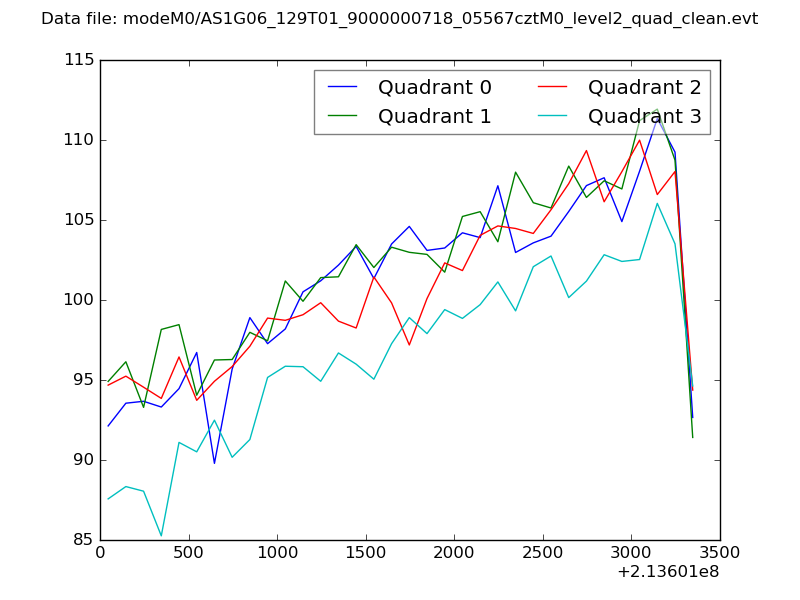
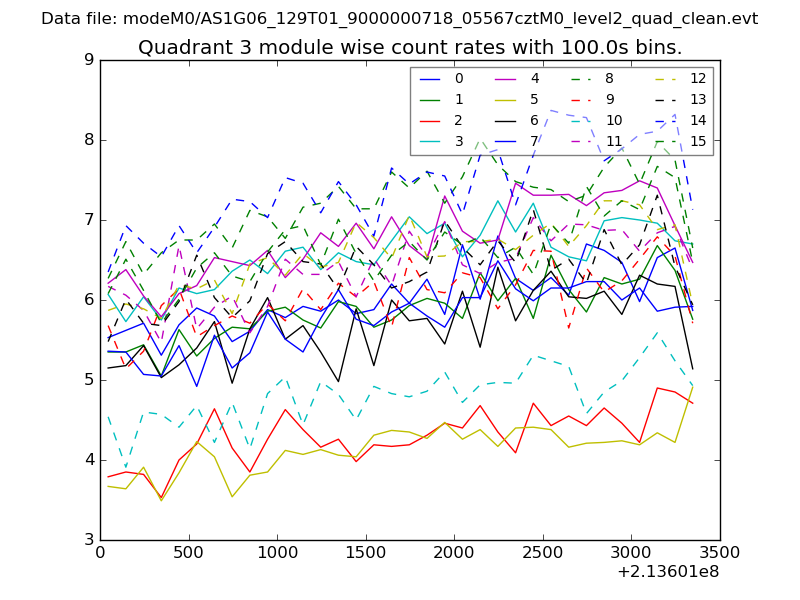
| Quadrant-wise count rates Data is divided into 100 sec bins |
 |
|
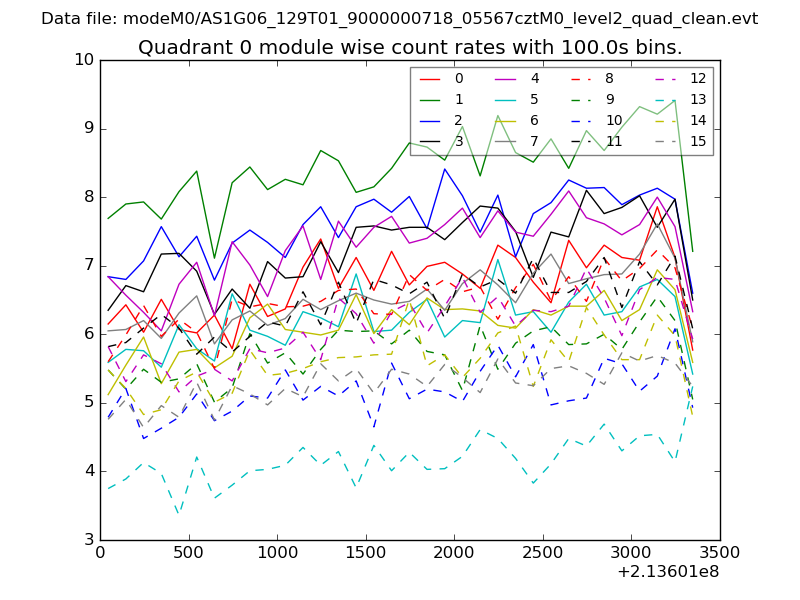
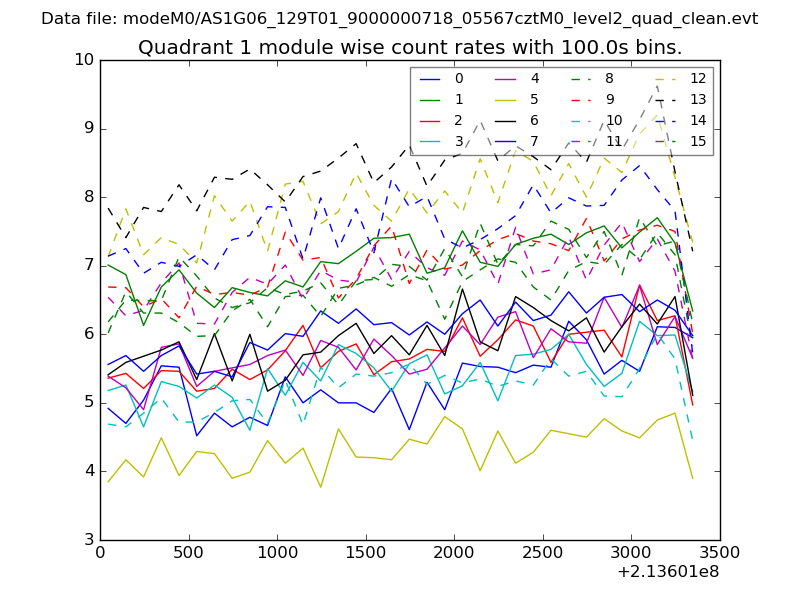
| Module-wise count rates for Quadrant A Data is divided into 100 sec bins |
 |
 |
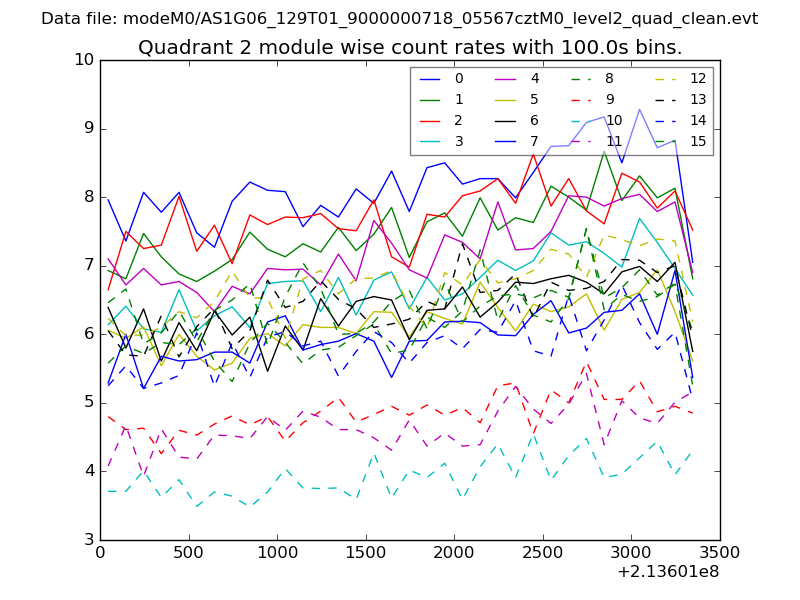
| Module-wise count rates for Quadrant B Data is divided into 100 sec bins |
 |
 |
| Module-wise count rates for Quadrant C Data is divided into 100 sec bins |
 |
 |
| Module-wise count rates for Quadrant D Data is divided into 100 sec bins |
 |
 |
| Parameter | Plot |
|---|---|
| CZT HV Monitor | 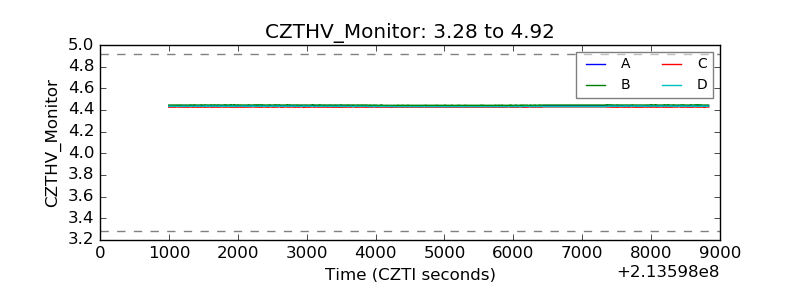 |
| D_VDD | 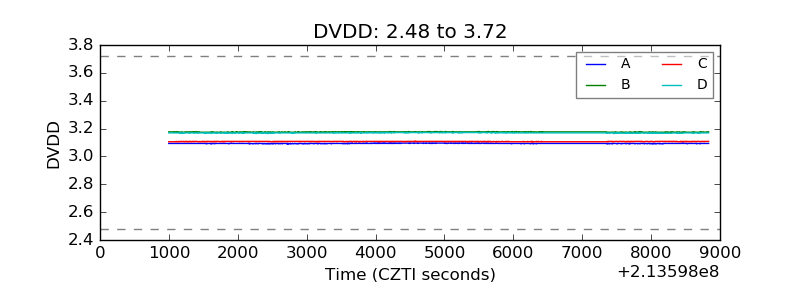 |
| Temperature 1 | 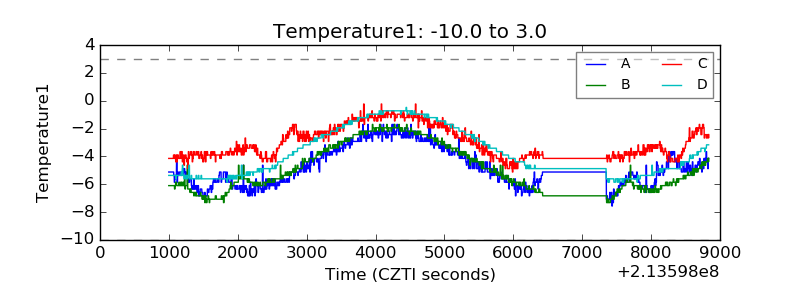 |
| Veto HV Monitor | 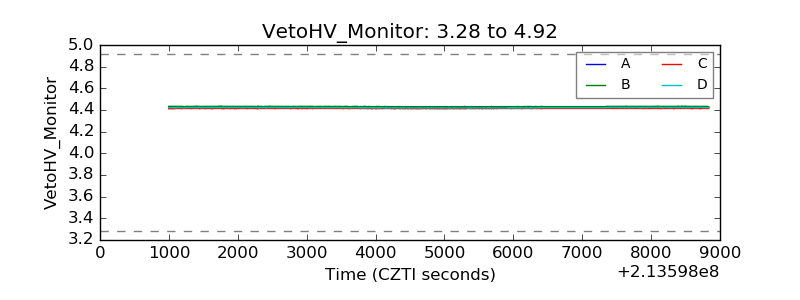 |
| Veto LLD | 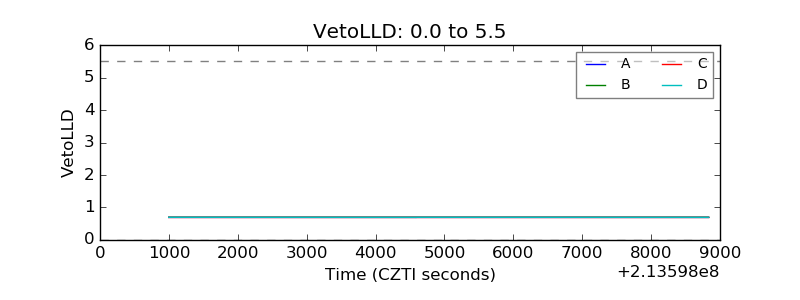 |
| Alpha Counter | 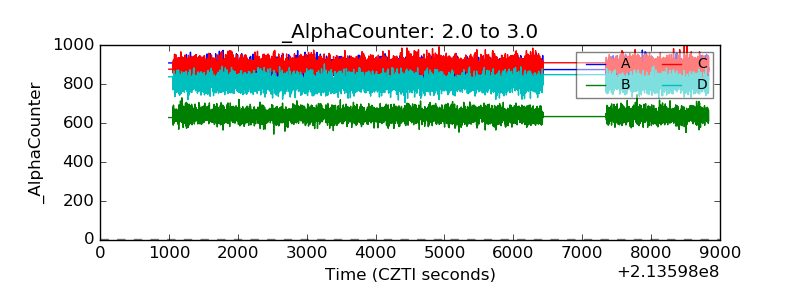 |
| _CPM_Rate | 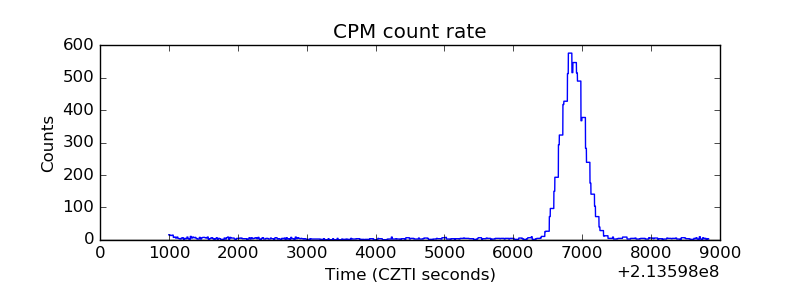 |
| CZT Counter | 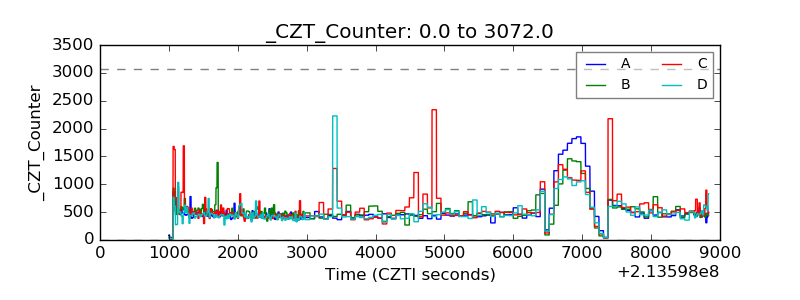 |
| +2.5 Volts monitor |  |
| +5 Volts monitor | 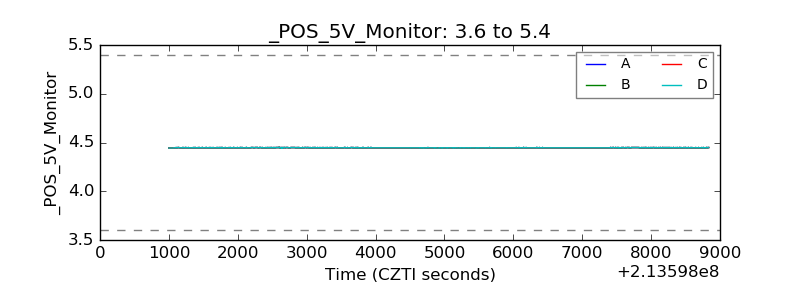 |
| _ROLL_ROT | 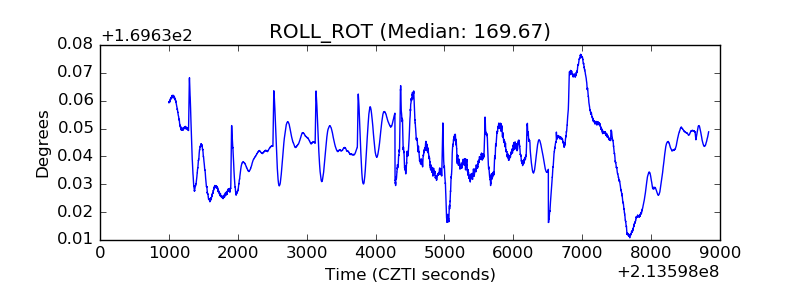 |
| _Roll_DEC | 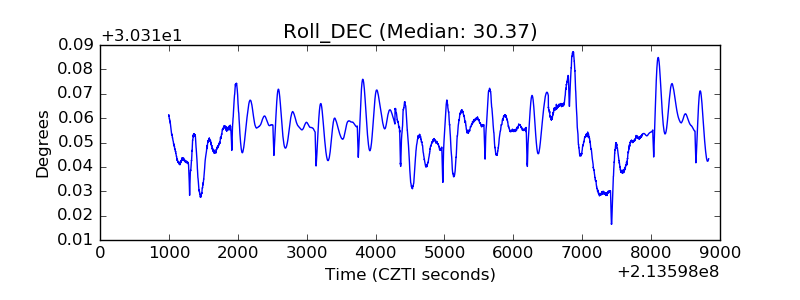 |
| _Roll_RA | 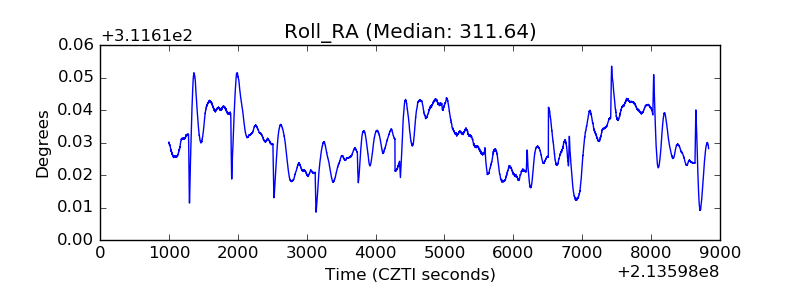 |
| Veto Counter | 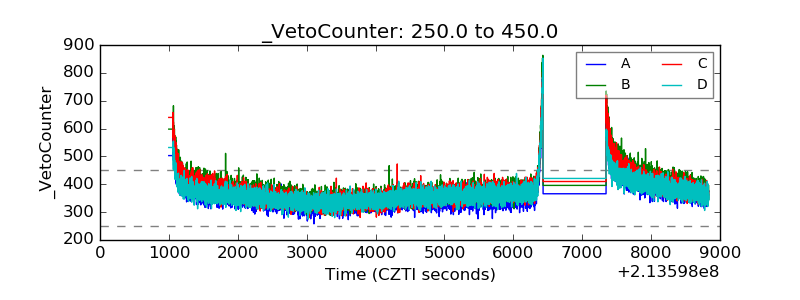 |