| Param | Original file | Final file |
|---|---|---|
| Filename | modeM0/AS1G06_129T01_9000000718_05570cztM0_level2.evt | modeM0/AS1G06_129T01_9000000718_05570cztM0_level2_quad_clean.evt |
| Size (bytes) | 541,131,840 | 73,926,720 |
| Size | 516.1 MB | 70.5 MB |
| Events in quadrant A | 3,191,733 | 464,634 |
| Events in quadrant B | 3,881,998 | 466,341 |
| Events in quadrant C | 5,629,118 | 417,526 |
| Events in quadrant D | 3,243,248 | 435,169 |
| Mode SS | |||
|---|---|---|---|
| Quadrant | BADHDUFLAG | Total packets | Discarded packets |
| A | 0 | 132 | 0 |
| B | 0 | 132 | 0 |
| C | 0 | 132 | 0 |
| D | 0 | 132 | 0 |
| Mode M0 | |||
|---|---|---|---|
| Quadrant | BADHDUFLAG | Total packets | Discarded packets |
| A | 0 | 13640 | 3 |
| B | 0 | 15734 | 2 |
| C | 0 | 21027 | 2 |
| D | 0 | 13894 | 2 |
| Mode M9 | |||
|---|---|---|---|
| Quadrant | BADHDUFLAG | Total packets | Discarded packets |
| A | 0 | 17 | 0 |
| B | 0 | 17 | 0 |
| C | 0 | 17 | 0 |
| D | 0 | 18 | 0 |
| Quadrant | Total seconds | Saturated seconds | Saturation percentage |
|---|---|---|---|
| A | 6517 | 87 | 1.334970% |
| B | 6517 | 133 | 2.040816% |
| C | 6517 | 957 | 14.684671% |
| D | 6517 | 83 | 1.273592% |
Noise dominated data is calculated using 1-second bins in cleaned event files. If a bin has >2000 counts, and if more than 50% of those come from <1% of pixels, then it is considered to be noise-dominated and hence unusable.
| Quadrant | # 1 sec bins | Bins with >0 counts | Bins with >2000 counts | High rate bins dominated by noise | Noise dominated (total time) | Noise dominated (detector-on time) | Marked lightcurve |
|---|---|---|---|---|---|---|---|
| A | 7637 | 6517 | 0 | 0 | 0.00% | 0.00% | 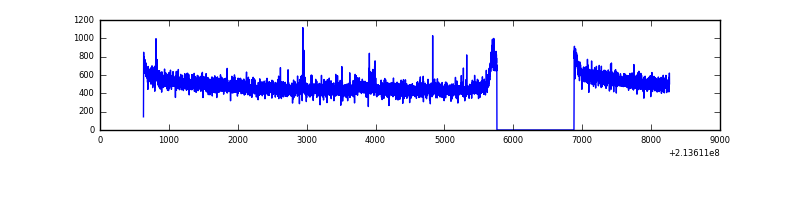 |
| B | 7637 | 6517 | 27 | 27 | 0.35% | 0.41% |  |
| C | 7637 | 6518 | 736 | 736 | 9.64% | 11.29% | 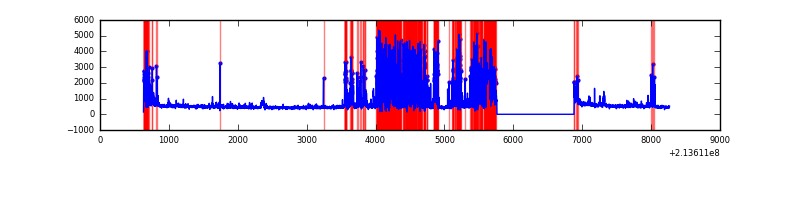 |
| D | 7637 | 6518 | 10 | 10 | 0.13% | 0.15% | 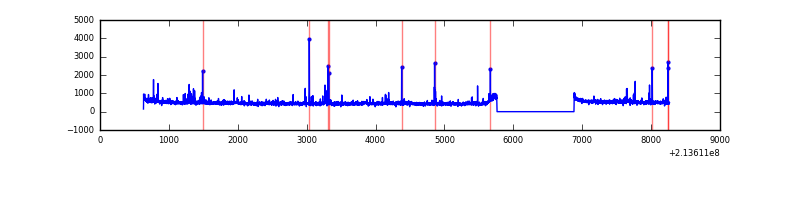 |
Top three noisy pixels from each quadrant. If the there are fewer than three noisy pixels in the level2.evt file, extra rows are filled as -1
| Pixel properties | Quadrant properties | ||||||
|---|---|---|---|---|---|---|---|
| Quadrant | DetID | PixID | Counts | Sigma | Mean | Median | Sigma |
| A | 13 | 14 | 25816 | 149.98 | 815 | 798 | 166.8 |
| A | 15 | 174 | 16145 | 92.0 | 815 | 798 | 166.8 |
| A | 7 | 16 | 8776 | 47.83 | 815 | 798 | 166.8 |
| B | 15 | 204 | 302520 | 1925.38 | 814 | 794 | 156.7 |
| B | 10 | 16 | 171309 | 1088.1 | 814 | 794 | 156.7 |
| B | 11 | 51 | 121323 | 769.12 | 814 | 794 | 156.7 |
| C | 9 | 16 | 2086588 | 12561.17 | 718 | 721 | 166.1 |
| C | 1 | 241 | 715810 | 4306.29 | 718 | 721 | 166.1 |
| C | 1 | 16 | 21028 | 122.29 | 718 | 721 | 166.1 |
| D | 8 | 195 | 100949 | 524.83 | 782 | 759 | 190.9 |
| D | 2 | 136 | 83072 | 431.19 | 782 | 759 | 190.9 |
| D | 2 | 152 | 52576 | 271.44 | 782 | 759 | 190.9 |
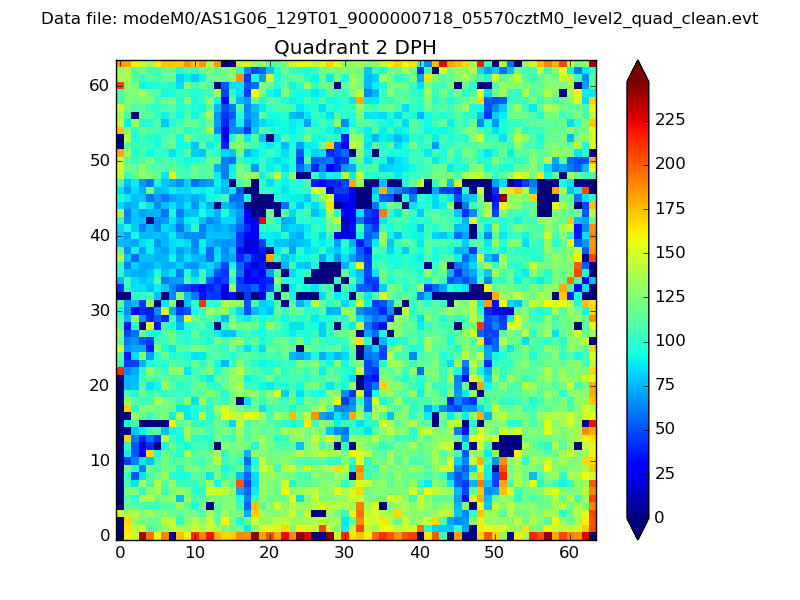
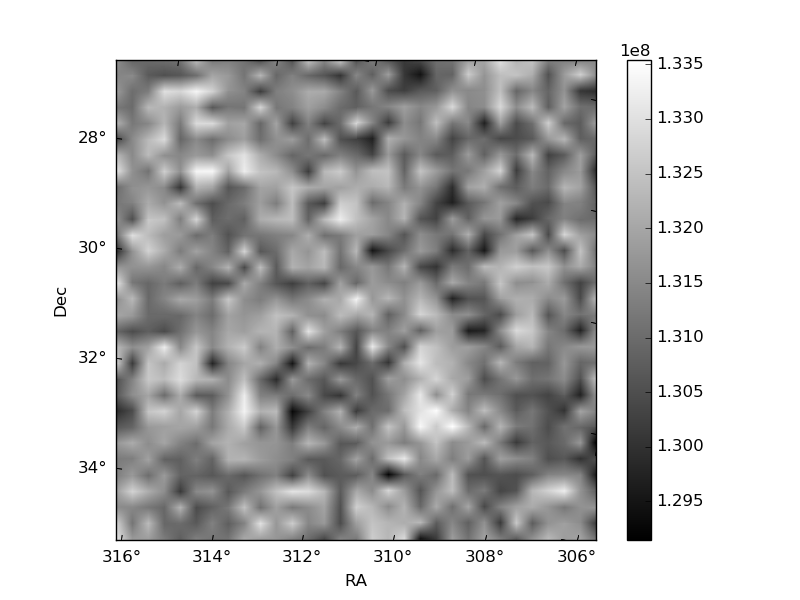
Histogram calculated using DETX and DETY for each event in the final _common_clean file
| Quadrant A | 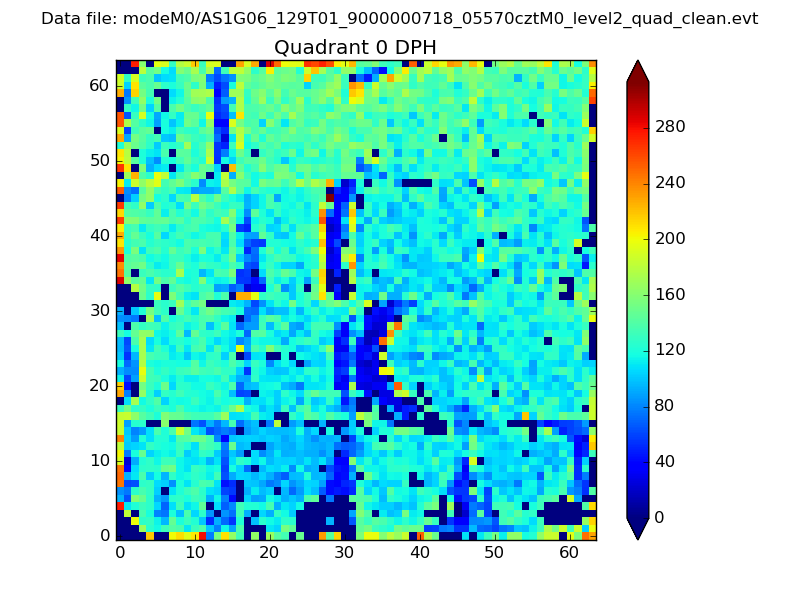 |
 |
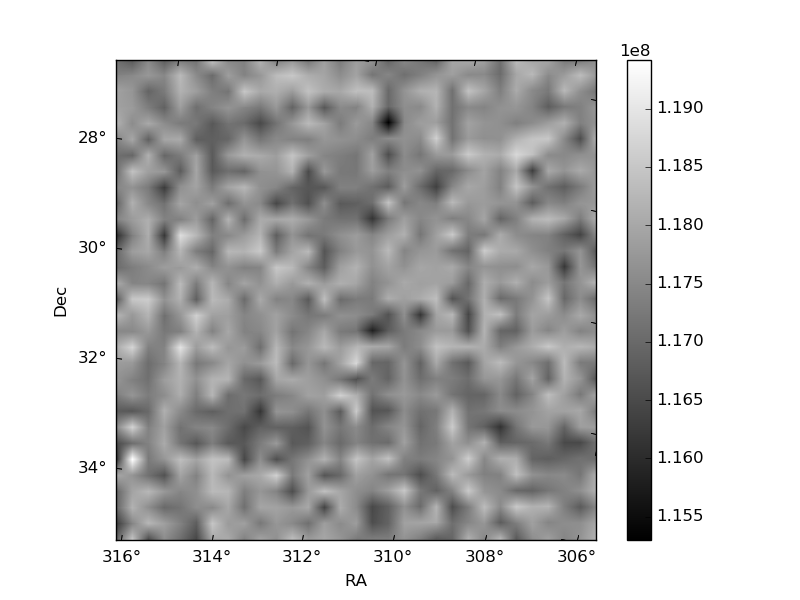
Quadrant B |
|---|---|---|---|
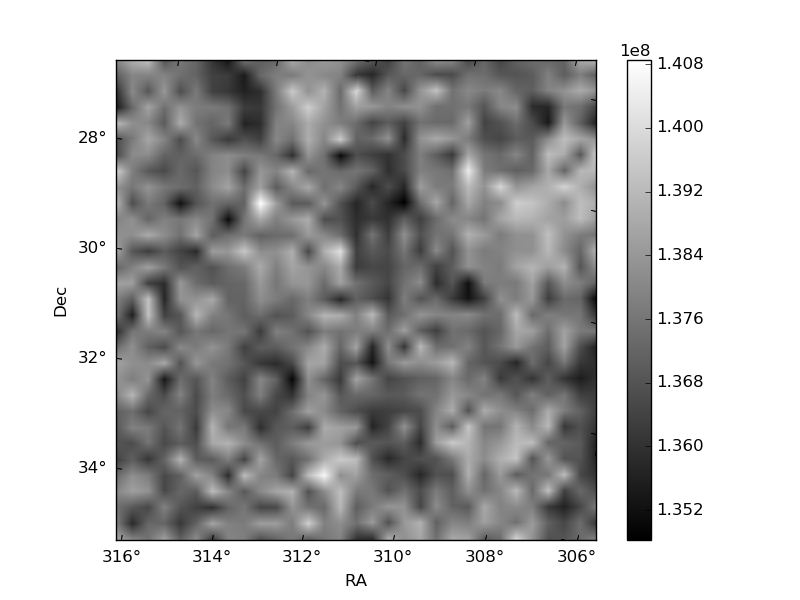
| Quadrant D | 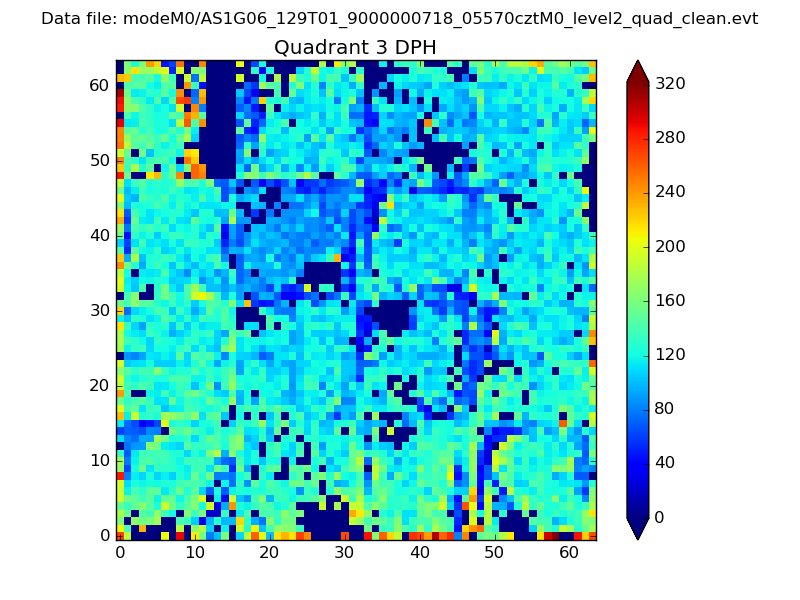 |
 |
Quadrant C |
| Plot type | Count rate plots | Images |
|---|---|---|
| Comparison with Poisson distribution Blue bars denote a histogram of data divided into 1 sec bins. Red curve is a Poisson curve with rate = median count rate of data. |
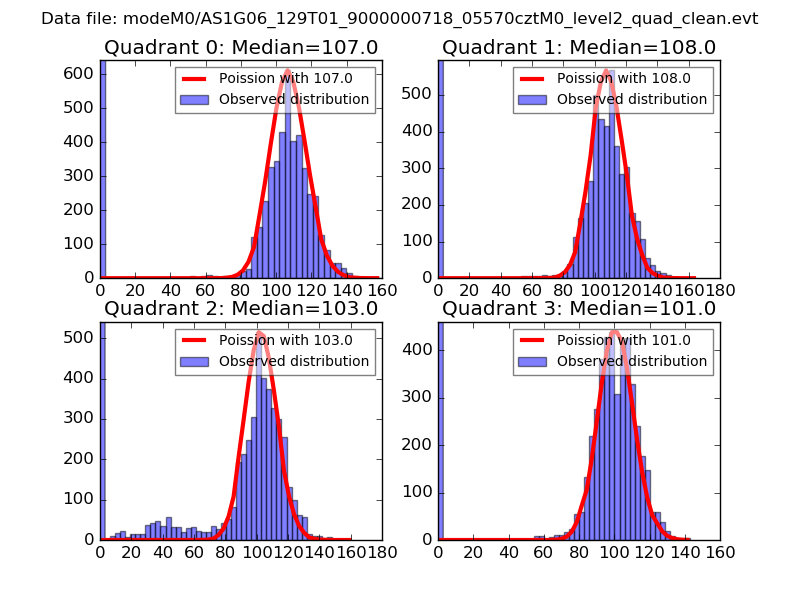 |
 |
| Quadrant-wise count rates Data is divided into 100 sec bins |
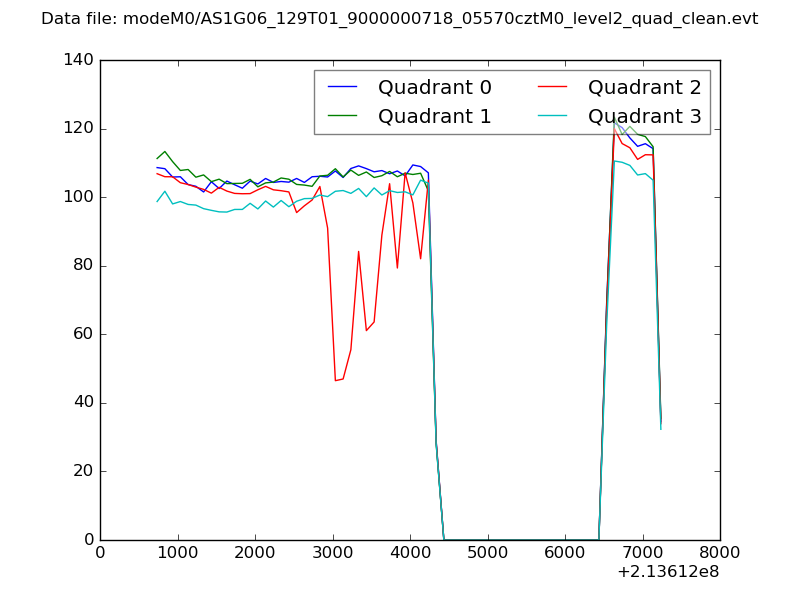 |
|
| Module-wise count rates for Quadrant A Data is divided into 100 sec bins |
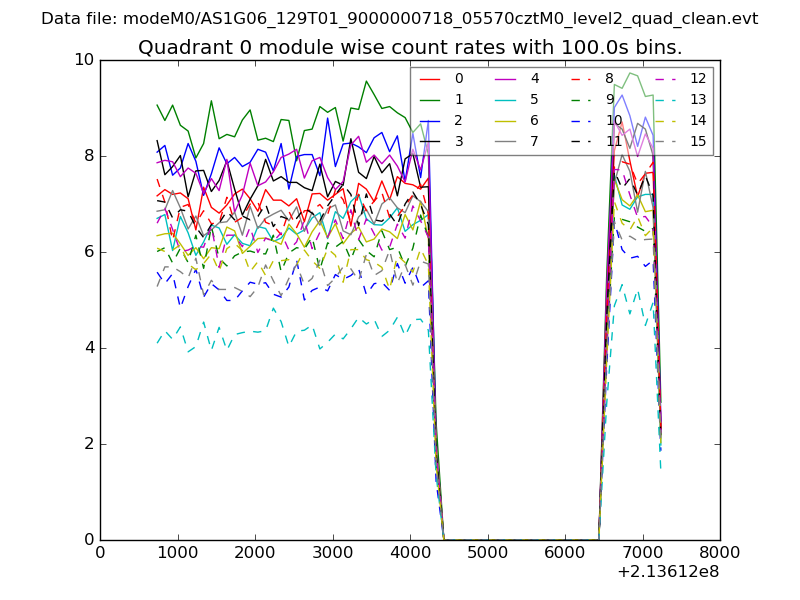 |
 |
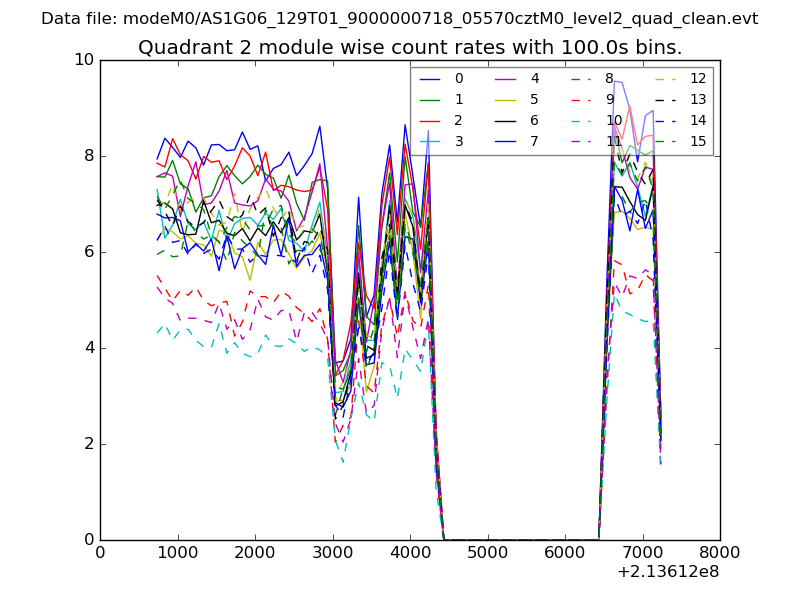
| Module-wise count rates for Quadrant B Data is divided into 100 sec bins |
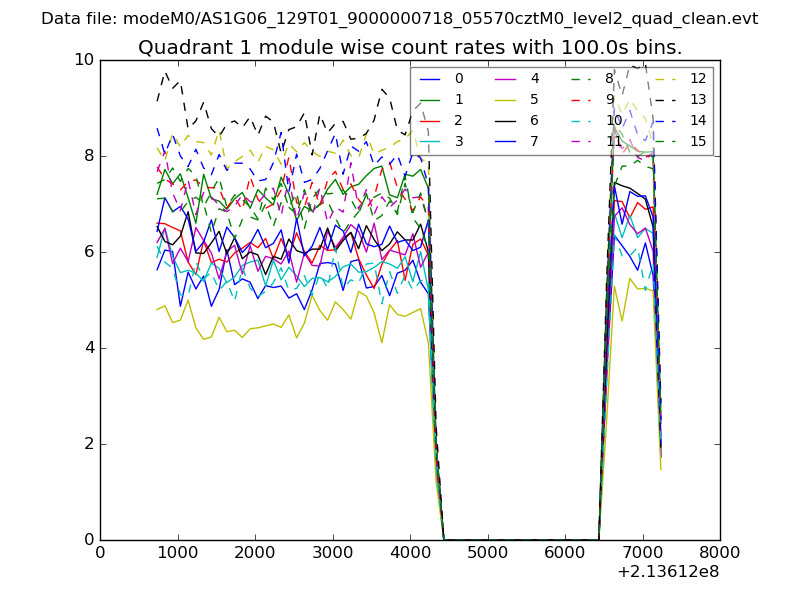 |
 |
| Module-wise count rates for Quadrant C Data is divided into 100 sec bins |
 |
 |
| Module-wise count rates for Quadrant D Data is divided into 100 sec bins |
 |
 |
| Parameter | Plot |
|---|---|
| CZT HV Monitor | 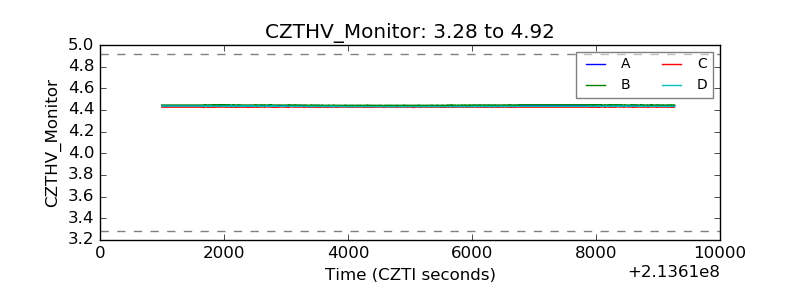 |
| D_VDD | 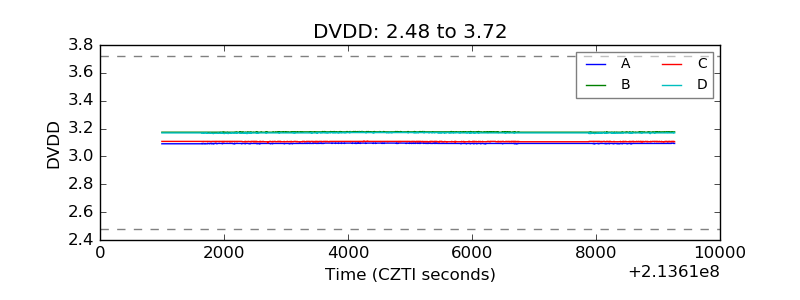 |
| Temperature 1 | 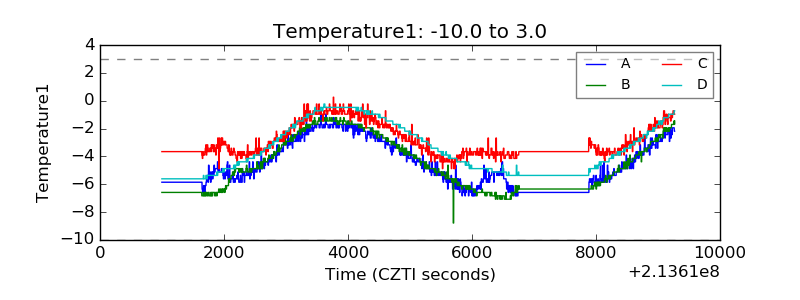 |
| Veto HV Monitor | 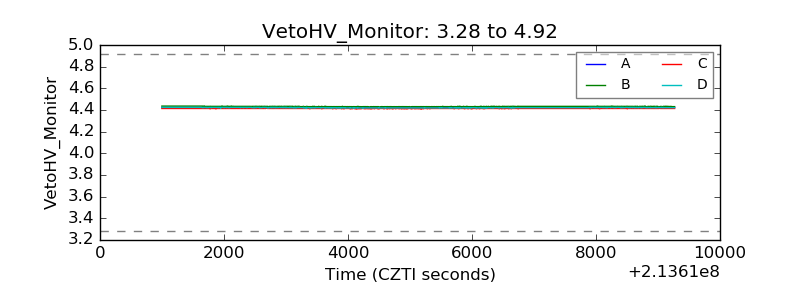 |
| Veto LLD |  |
| Alpha Counter | 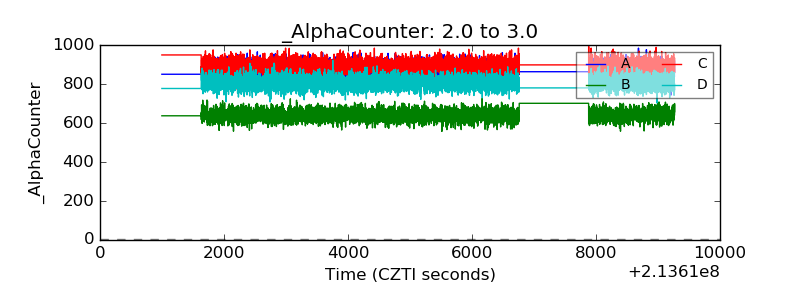 |
| _CPM_Rate | 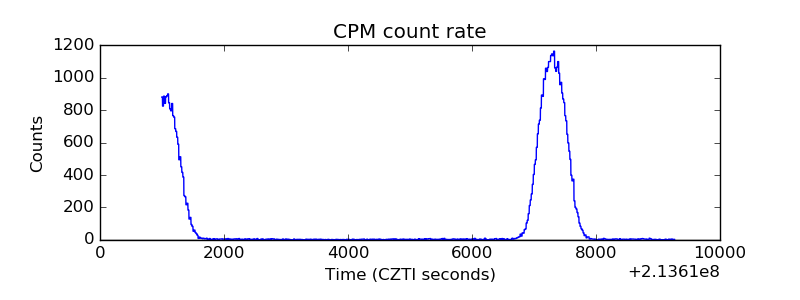 |
| CZT Counter | 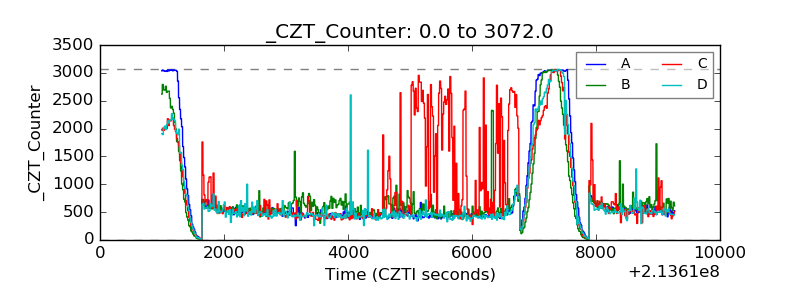 |
| +2.5 Volts monitor |  |
| +5 Volts monitor | 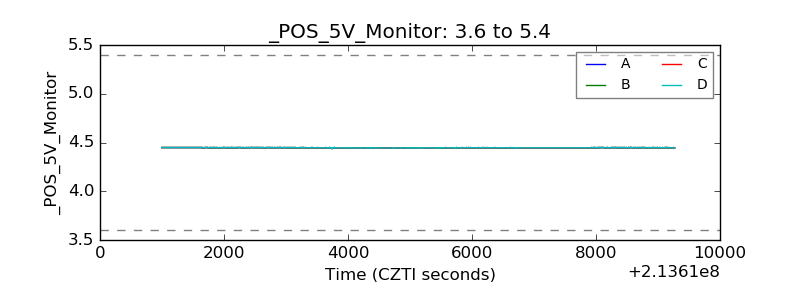 |
| _ROLL_ROT | 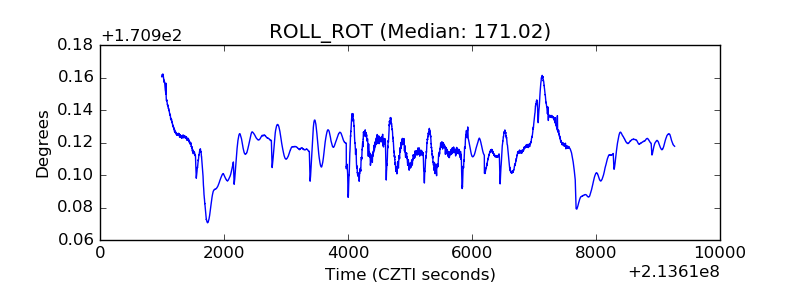 |
| _Roll_DEC | 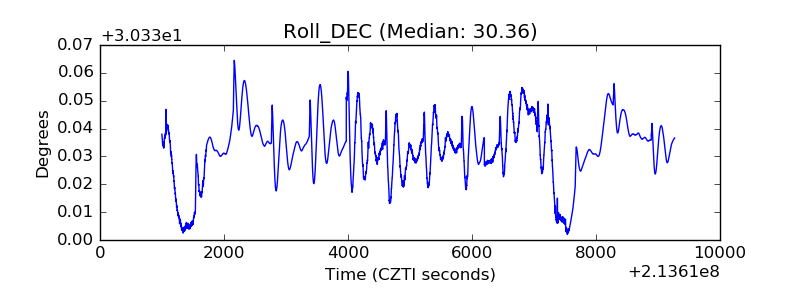 |
| _Roll_RA | 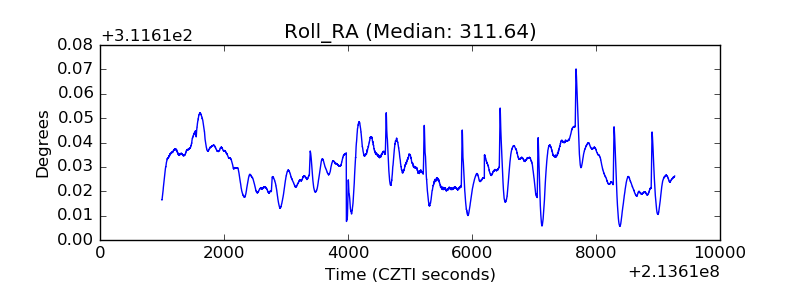 |
| Veto Counter | 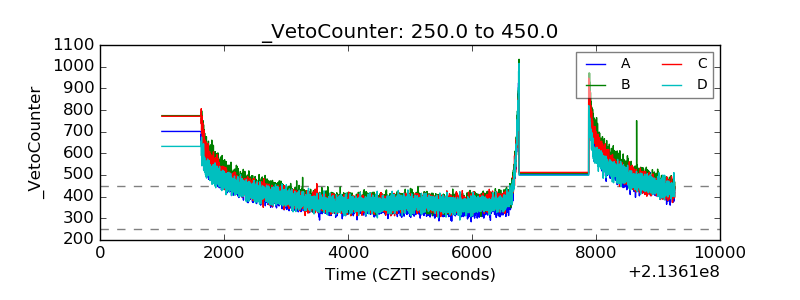 |