| Param | Original file | Final file |
|---|---|---|
| Filename | modeM0/AS1G06_129T01_9000000718_05572cztM0_level2.evt | modeM0/AS1G06_129T01_9000000718_05572cztM0_level2_quad_clean.evt |
| Size (bytes) | 493,165,440 | 84,254,400 |
| Size | 470.3 MB | 80.4 MB |
| Events in quadrant A | 2,900,553 | 564,621 |
| Events in quadrant B | 3,563,705 | 564,983 |
| Events in quadrant C | 4,885,629 | 479,576 |
| Events in quadrant D | 3,182,016 | 526,657 |
| Mode SS | |||
|---|---|---|---|
| Quadrant | BADHDUFLAG | Total packets | Discarded packets |
| A | 0 | 120 | 0 |
| B | 0 | 120 | 0 |
| C | 0 | 120 | 0 |
| D | 0 | 120 | 0 |
| Mode M0 | |||
|---|---|---|---|
| Quadrant | BADHDUFLAG | Total packets | Discarded packets |
| A | 0 | 12366 | 1 |
| B | 0 | 14387 | 0 |
| C | 0 | 18255 | 0 |
| D | 0 | 13167 | 0 |
| Mode M9 | |||
|---|---|---|---|
| Quadrant | BADHDUFLAG | Total packets | Discarded packets |
| A | 0 | 13 | 0 |
| B | 0 | 13 | 0 |
| C | 0 | 13 | 0 |
| D | 0 | 13 | 0 |
| Quadrant | Total seconds | Saturated seconds | Saturation percentage |
|---|---|---|---|
| A | 5947 | 86 | 1.446107% |
| B | 5947 | 114 | 1.916933% |
| C | 5947 | 877 | 14.746931% |
| D | 5947 | 109 | 1.832857% |
Noise dominated data is calculated using 1-second bins in cleaned event files. If a bin has >2000 counts, and if more than 50% of those come from <1% of pixels, then it is considered to be noise-dominated and hence unusable.
| Quadrant | # 1 sec bins | Bins with >0 counts | Bins with >2000 counts | High rate bins dominated by noise | Noise dominated (total time) | Noise dominated (detector-on time) | Marked lightcurve |
|---|---|---|---|---|---|---|---|
| A | 7197 | 5948 | 1 | 1 | 0.01% | 0.02% | 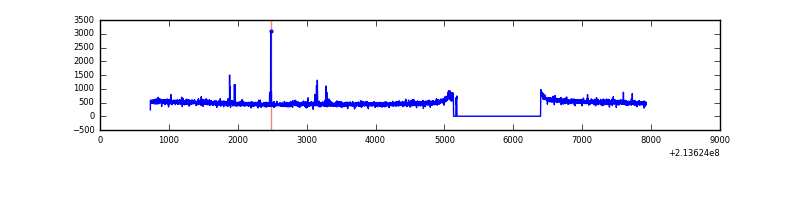 |
| B | 7197 | 5948 | 23 | 23 | 0.32% | 0.39% | 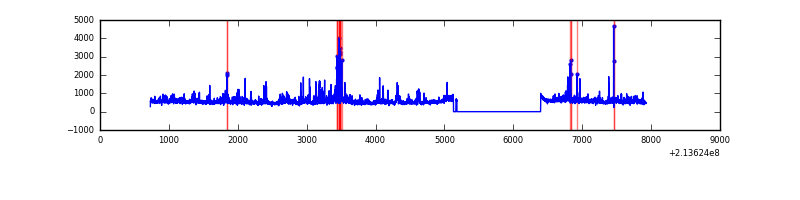 |
| C | 7197 | 5949 | 714 | 714 | 9.92% | 12.00% | 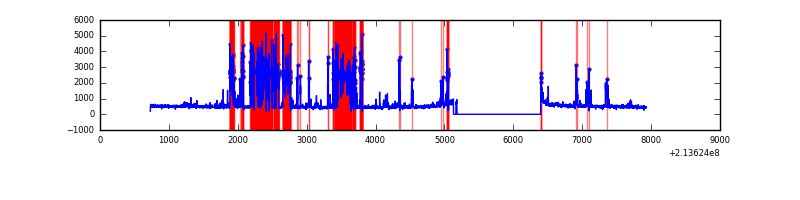 |
| D | 7197 | 5948 | 33 | 33 | 0.46% | 0.55% | 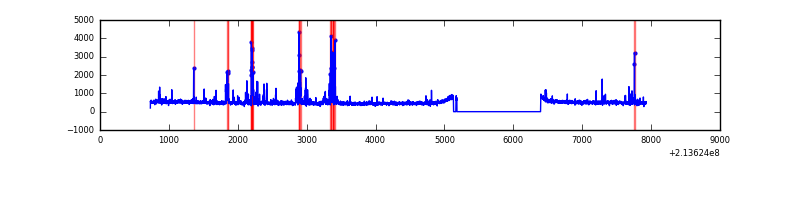 |
Top three noisy pixels from each quadrant. If the there are fewer than three noisy pixels in the level2.evt file, extra rows are filled as -1
| Pixel properties | Quadrant properties | ||||||
|---|---|---|---|---|---|---|---|
| Quadrant | DetID | PixID | Counts | Sigma | Mean | Median | Sigma |
| A | 13 | 14 | 21998 | 141.82 | 739 | 724 | 150.0 |
| A | 7 | 16 | 15245 | 96.8 | 739 | 724 | 150.0 |
| A | 0 | 50 | 9806 | 60.54 | 739 | 724 | 150.0 |
| B | 15 | 204 | 229894 | 1639.37 | 737 | 720 | 139.8 |
| B | 11 | 51 | 129630 | 922.14 | 737 | 720 | 139.8 |
| B | 4 | 81 | 108162 | 768.57 | 737 | 720 | 139.8 |
| C | 1 | 241 | 2254522 | 15194.53 | 643 | 647 | 148.3 |
| C | 1 | 16 | 81356 | 544.1 | 643 | 647 | 148.3 |
| C | 9 | 16 | 36760 | 243.46 | 643 | 647 | 148.3 |
| D | 8 | 195 | 141251 | 800.35 | 716 | 695 | 175.6 |
| D | 2 | 152 | 140635 | 796.84 | 716 | 695 | 175.6 |
| D | 2 | 136 | 140365 | 795.31 | 716 | 695 | 175.6 |
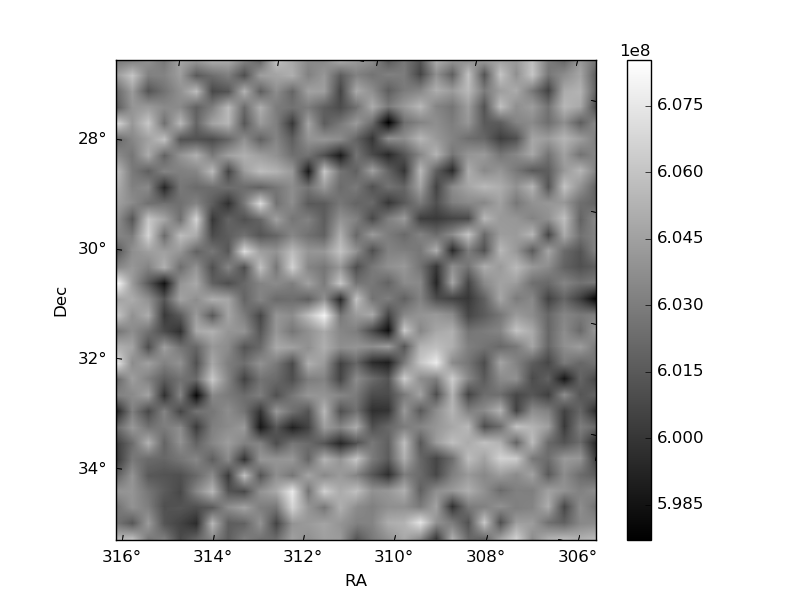
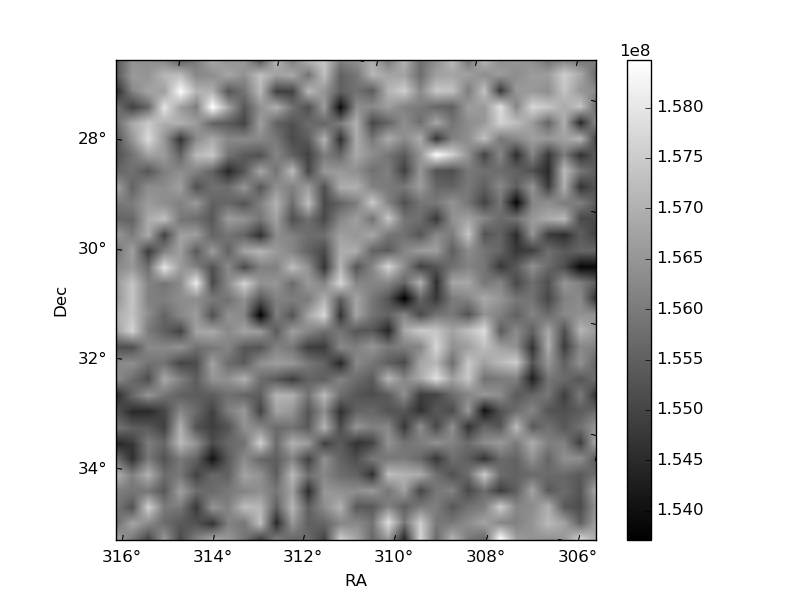
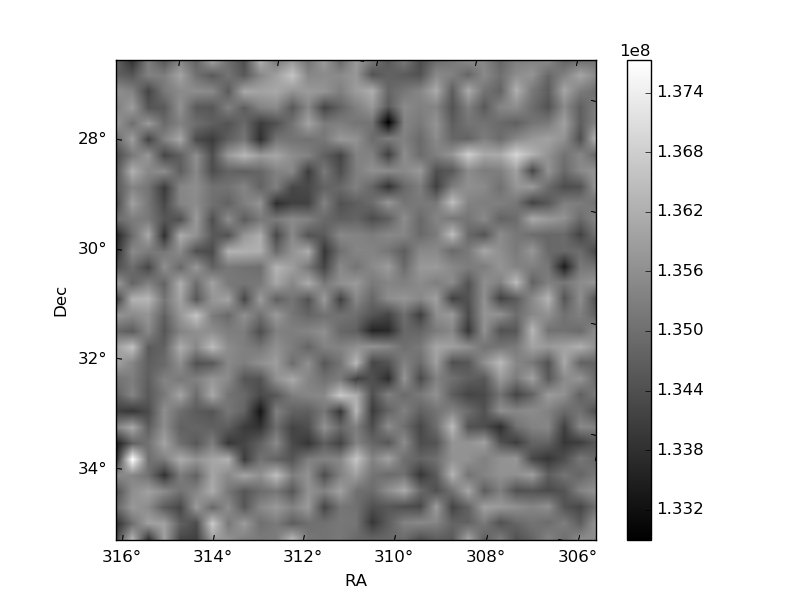
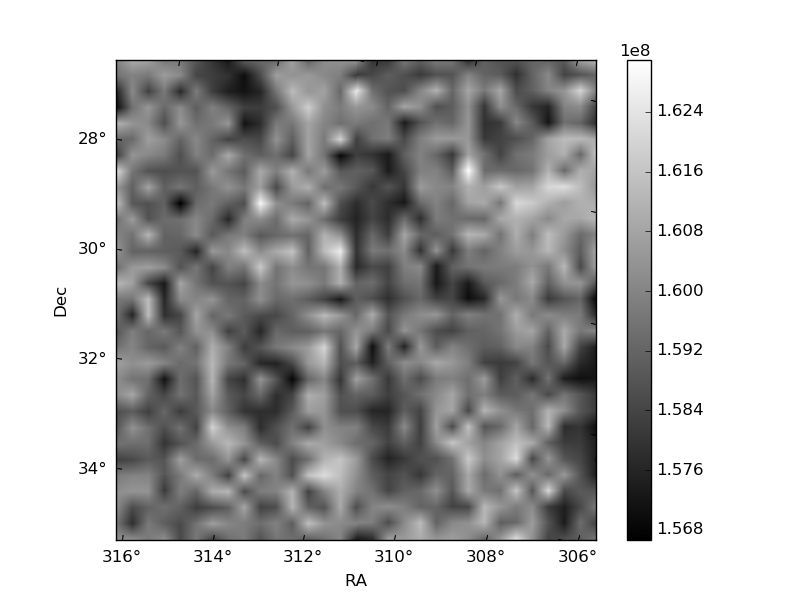
Histogram calculated using DETX and DETY for each event in the final _common_clean file
| Quadrant A | 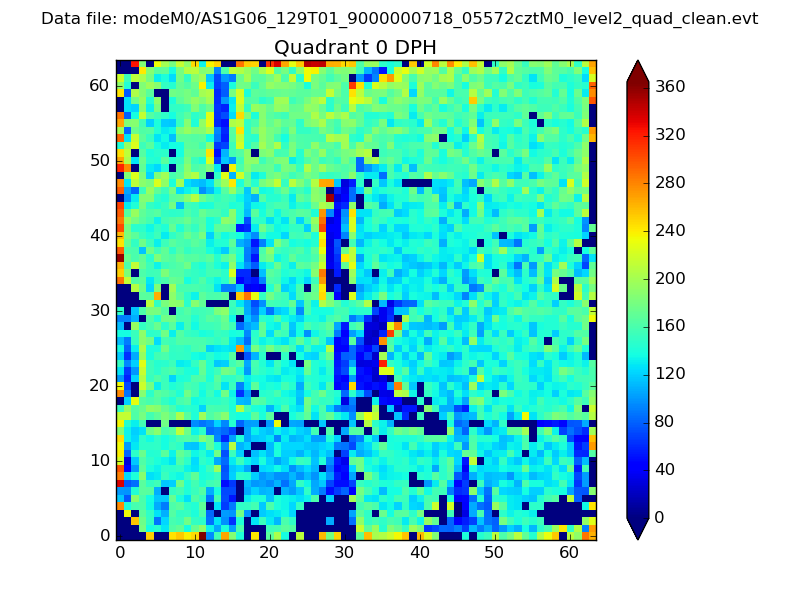 |
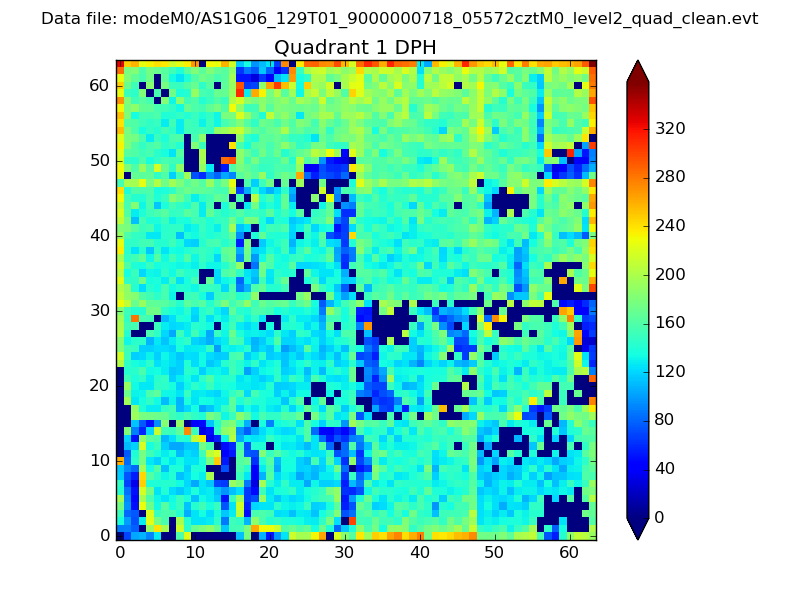 |
Quadrant B |
|---|---|---|---|
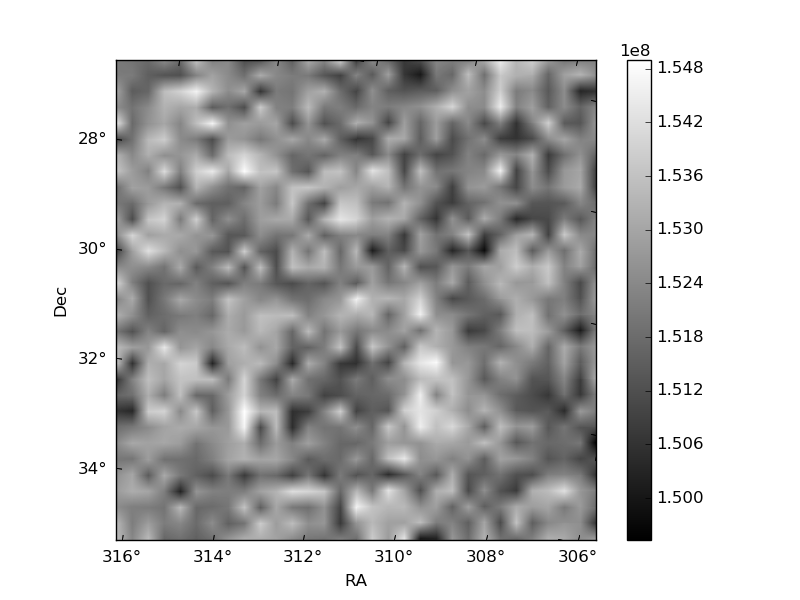
| Quadrant D | 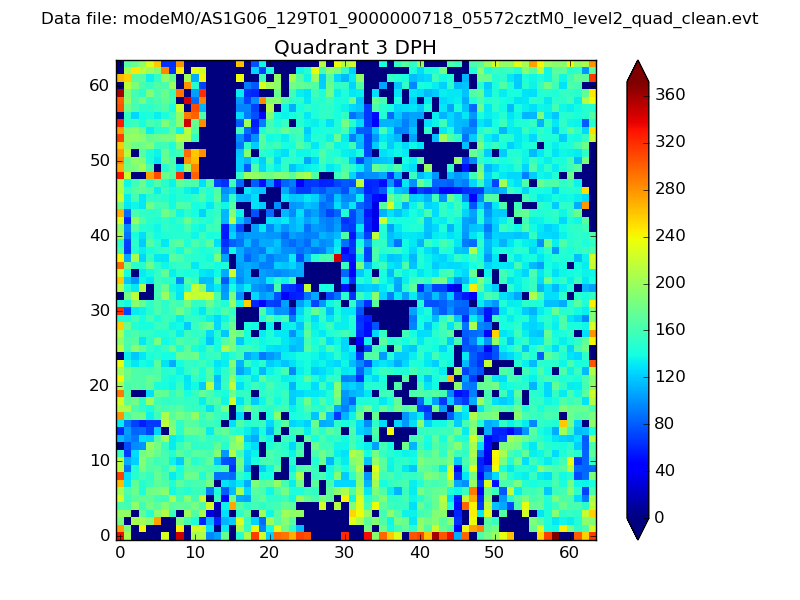 |
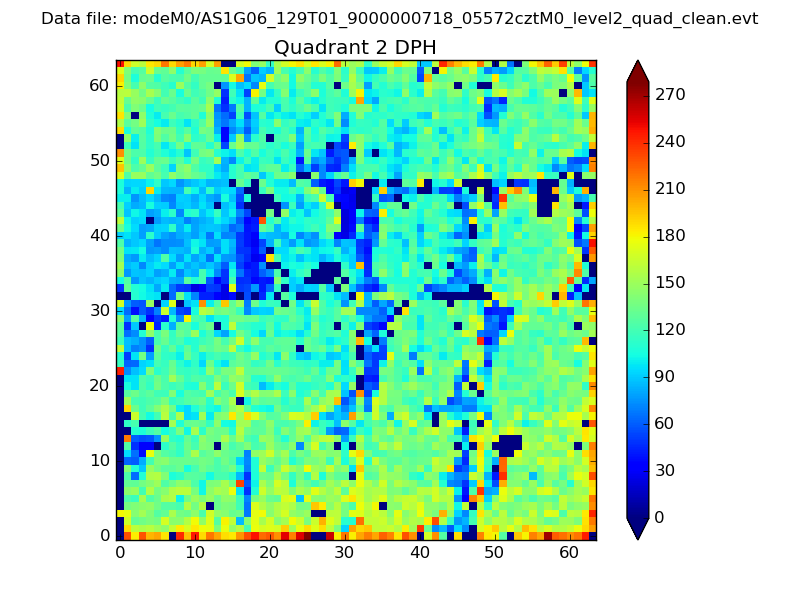 |
Quadrant C |
| Plot type | Count rate plots | Images |
|---|---|---|
| Comparison with Poisson distribution Blue bars denote a histogram of data divided into 1 sec bins. Red curve is a Poisson curve with rate = median count rate of data. |
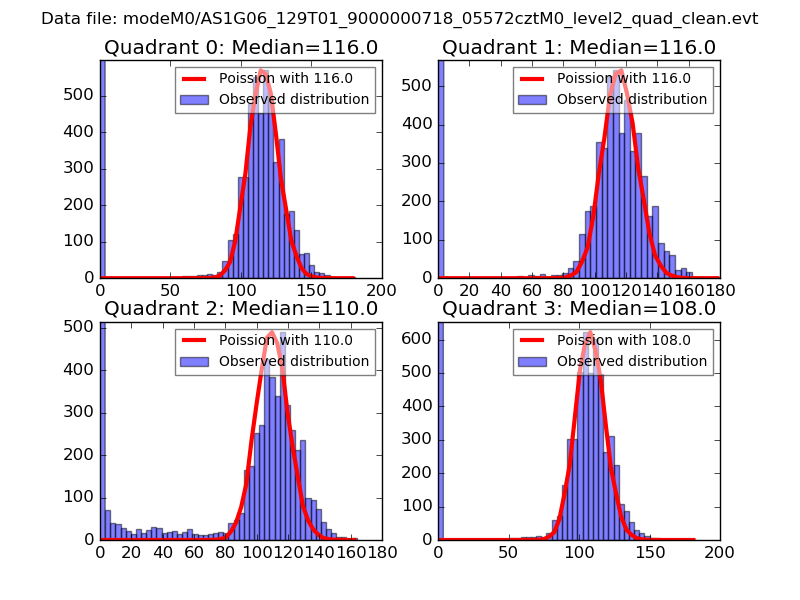 |
 |
| Quadrant-wise count rates Data is divided into 100 sec bins |
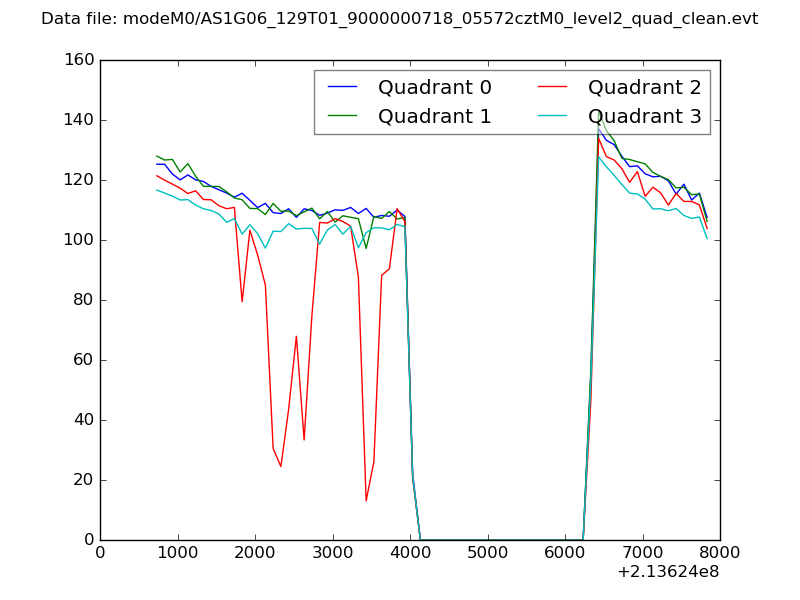 |
|
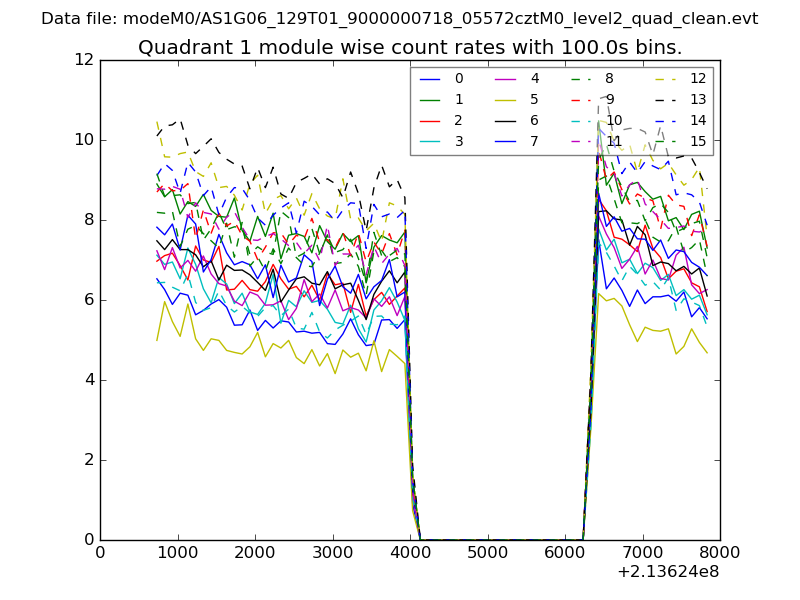
| Module-wise count rates for Quadrant A Data is divided into 100 sec bins |
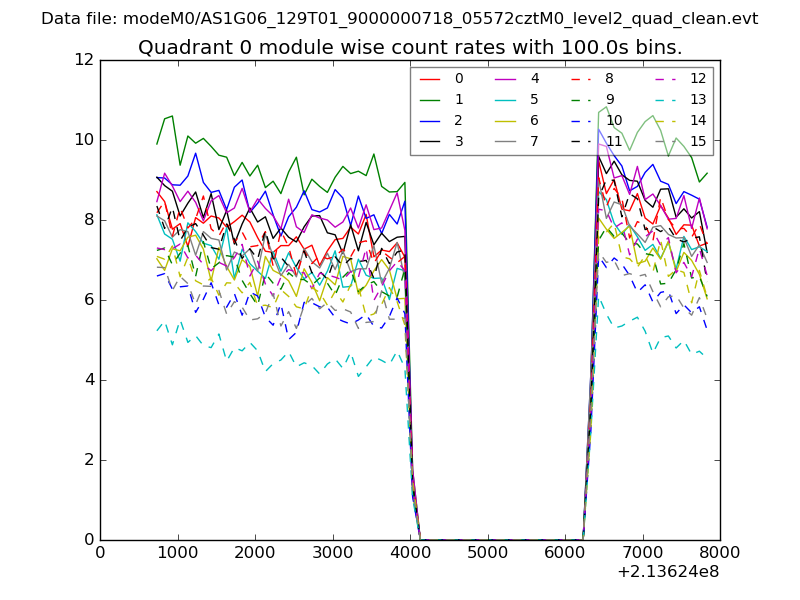 |
 |
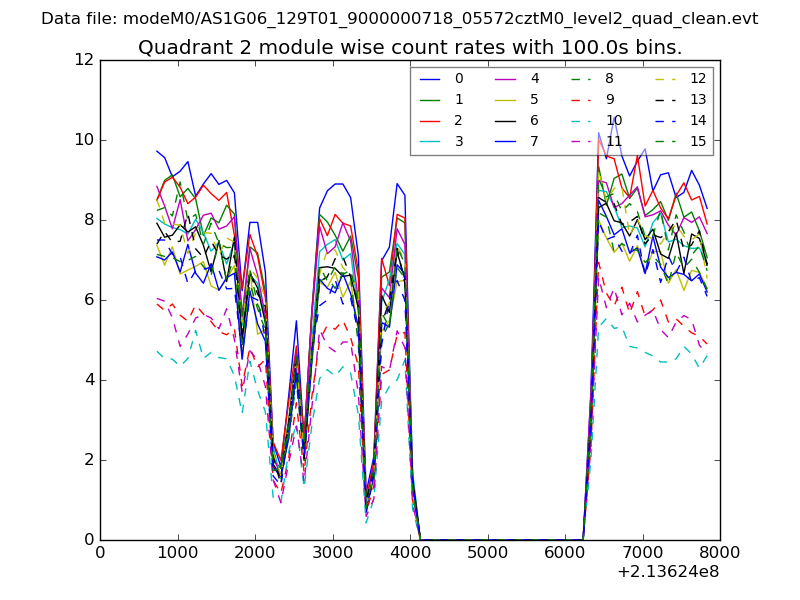
| Module-wise count rates for Quadrant B Data is divided into 100 sec bins |
 |
 |
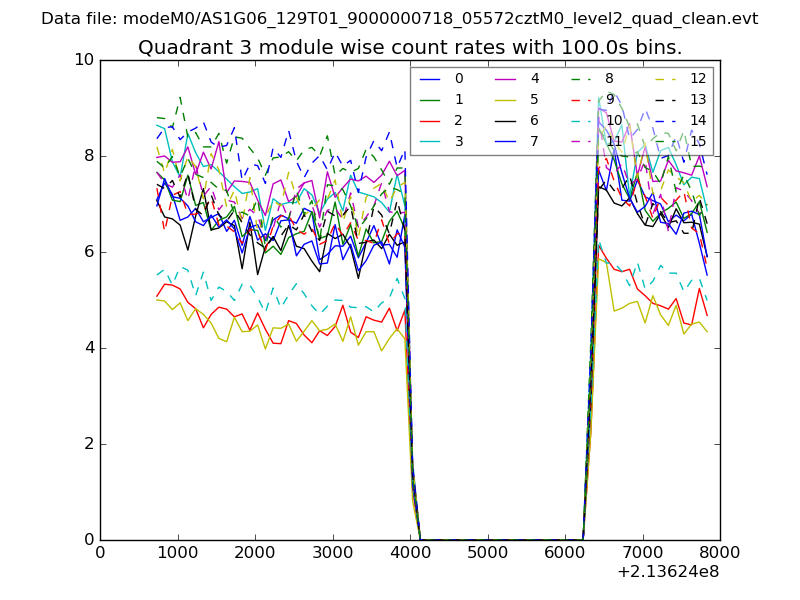
| Module-wise count rates for Quadrant C Data is divided into 100 sec bins |
 |
 |
| Module-wise count rates for Quadrant D Data is divided into 100 sec bins |
 |
 |
| Parameter | Plot |
|---|---|
| CZT HV Monitor | 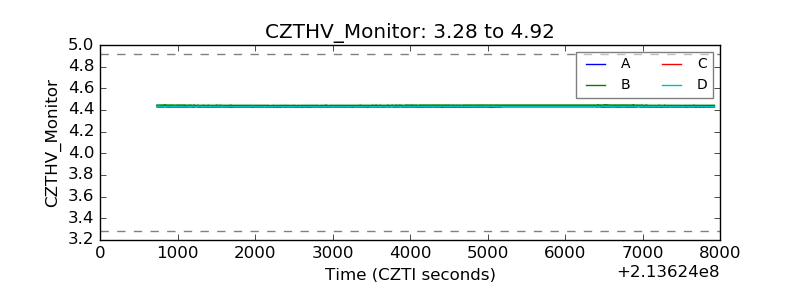 |
| D_VDD | 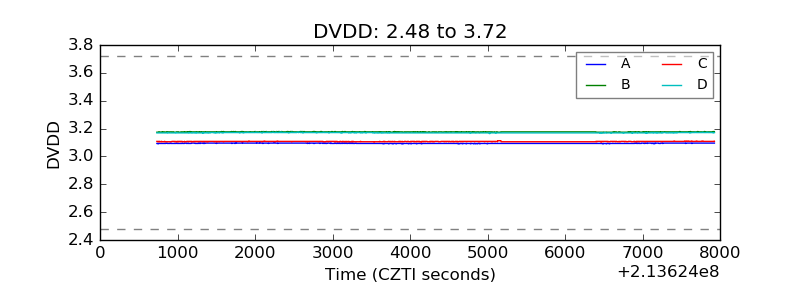 |
| Temperature 1 | 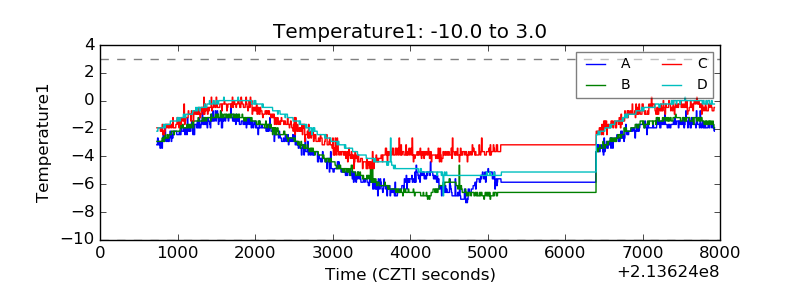 |
| Veto HV Monitor | 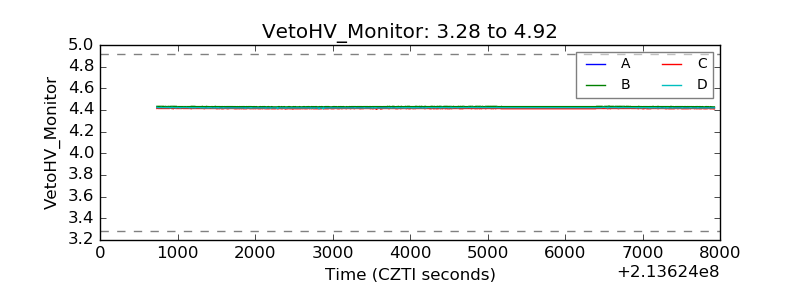 |
| Veto LLD | 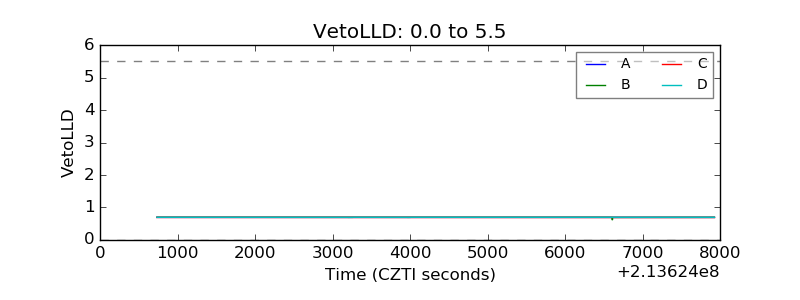 |
| Alpha Counter | 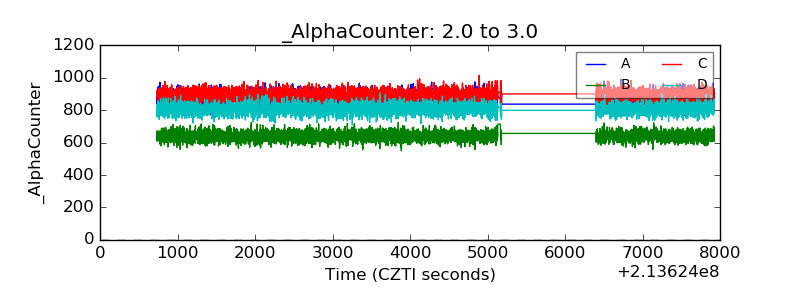 |
| _CPM_Rate | 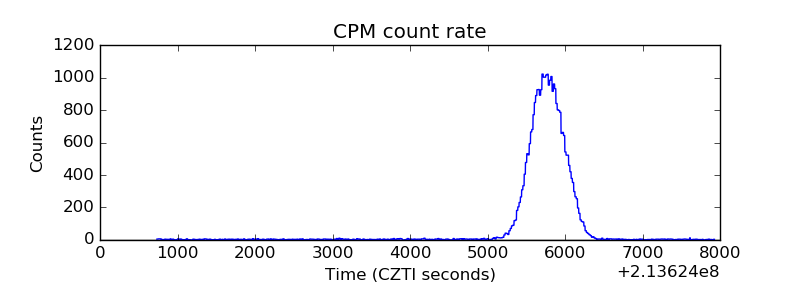 |
| CZT Counter | 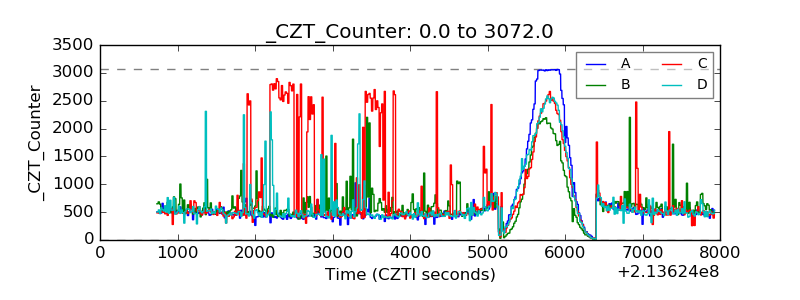 |
| +2.5 Volts monitor |  |
| +5 Volts monitor |  |
| _ROLL_ROT | 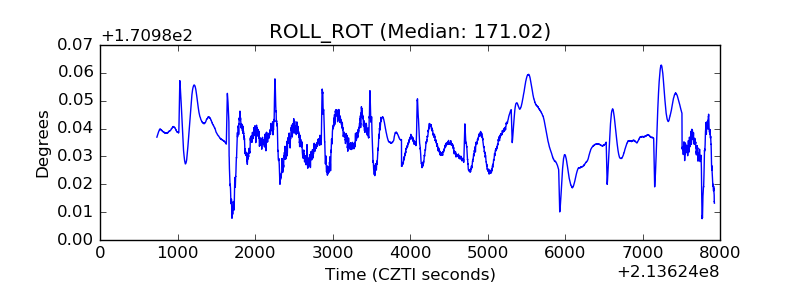 |
| _Roll_DEC |  |
| _Roll_RA | 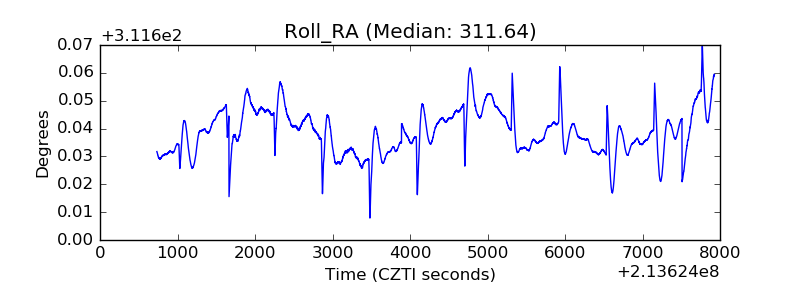 |
| Veto Counter | 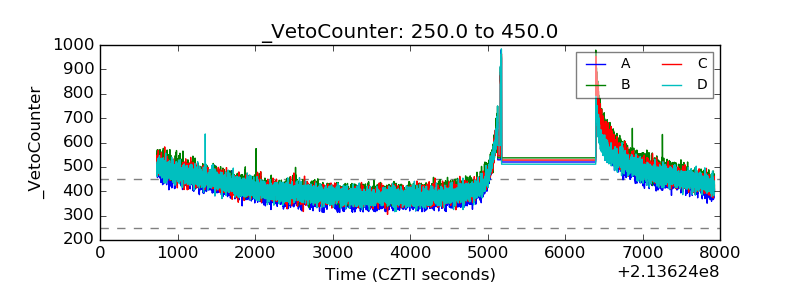 |