| Param | Original file | Final file |
|---|---|---|
| Filename | modeM0/AS1G06_129T01_9000000718_05573cztM0_level2.evt | modeM0/AS1G06_129T01_9000000718_05573cztM0_level2_quad_clean.evt |
| Size (bytes) | 451,667,520 | 85,236,480 |
| Size | 430.7 MB | 81.3 MB |
| Events in quadrant A | 3,046,626 | 548,667 |
| Events in quadrant B | 3,741,057 | 545,647 |
| Events in quadrant C | 3,140,180 | 533,653 |
| Events in quadrant D | 3,323,735 | 514,516 |
| Mode SS | |||
|---|---|---|---|
| Quadrant | BADHDUFLAG | Total packets | Discarded packets |
| A | 0 | 128 | 0 |
| B | 0 | 128 | 0 |
| C | 0 | 128 | 0 |
| D | 0 | 128 | 0 |
| Mode M0 | |||
|---|---|---|---|
| Quadrant | BADHDUFLAG | Total packets | Discarded packets |
| A | 0 | 13131 | 2 |
| B | 0 | 15300 | 1 |
| C | 0 | 13484 | 1 |
| D | 0 | 13923 | 3 |
| Mode M9 | |||
|---|---|---|---|
| Quadrant | BADHDUFLAG | Total packets | Discarded packets |
| A | 0 | 12 | 0 |
| B | 0 | 12 | 0 |
| C | 0 | 12 | 0 |
| D | 0 | 13 | 0 |
| Quadrant | Total seconds | Saturated seconds | Saturation percentage |
|---|---|---|---|
| A | 6285 | 91 | 1.447892% |
| B | 6285 | 175 | 2.784407% |
| C | 6285 | 91 | 1.447892% |
| D | 6284 | 85 | 1.352642% |
Noise dominated data is calculated using 1-second bins in cleaned event files. If a bin has >2000 counts, and if more than 50% of those come from <1% of pixels, then it is considered to be noise-dominated and hence unusable.
| Quadrant | # 1 sec bins | Bins with >0 counts | Bins with >2000 counts | High rate bins dominated by noise | Noise dominated (total time) | Noise dominated (detector-on time) | Marked lightcurve |
|---|---|---|---|---|---|---|---|
| A | 7505 | 6286 | 0 | 0 | 0.00% | 0.00% | 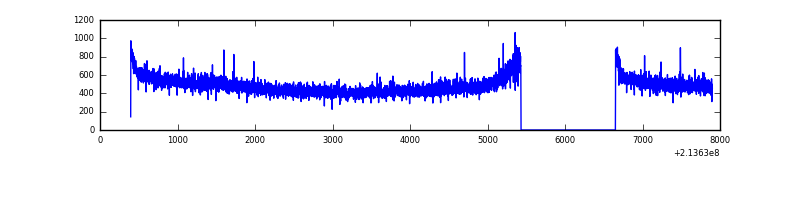 |
| B | 7505 | 6286 | 70 | 70 | 0.93% | 1.11% |  |
| C | 7505 | 6286 | 14 | 14 | 0.19% | 0.22% | 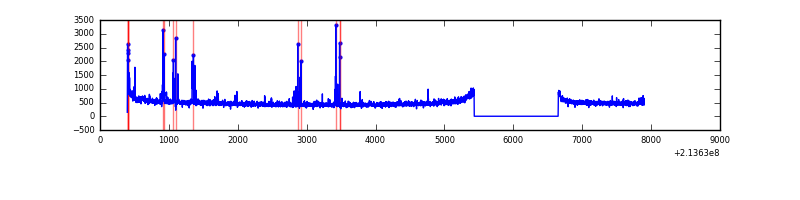 |
| D | 7505 | 6286 | 16 | 16 | 0.21% | 0.25% | 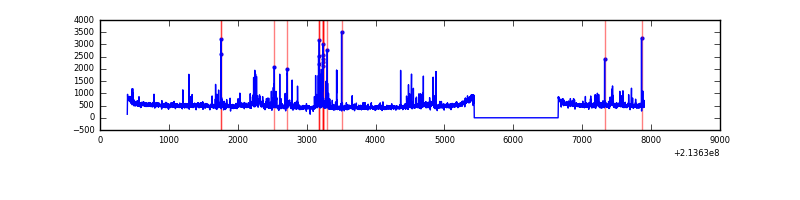 |
Top three noisy pixels from each quadrant. If the there are fewer than three noisy pixels in the level2.evt file, extra rows are filled as -1
| Pixel properties | Quadrant properties | ||||||
|---|---|---|---|---|---|---|---|
| Quadrant | DetID | PixID | Counts | Sigma | Mean | Median | Sigma |
| A | 13 | 14 | 23913 | 144.25 | 783 | 766 | 160.5 |
| A | 0 | 226 | 7805 | 43.87 | 783 | 766 | 160.5 |
| A | 12 | 194 | 7771 | 43.65 | 783 | 766 | 160.5 |
| B | 5 | 172 | 274520 | 1855.99 | 778 | 760 | 147.5 |
| B | 15 | 204 | 216723 | 1464.15 | 778 | 760 | 147.5 |
| B | 11 | 51 | 80971 | 543.8 | 778 | 760 | 147.5 |
| C | 1 | 241 | 85915 | 490.79 | 751 | 755 | 173.5 |
| C | 1 | 16 | 62845 | 357.84 | 751 | 755 | 173.5 |
| C | 9 | 16 | 55162 | 313.56 | 751 | 755 | 173.5 |
| D | 2 | 152 | 116629 | 626.92 | 761 | 737 | 184.9 |
| D | 8 | 195 | 82563 | 442.64 | 761 | 737 | 184.9 |
| D | 2 | 136 | 57124 | 305.03 | 761 | 737 | 184.9 |
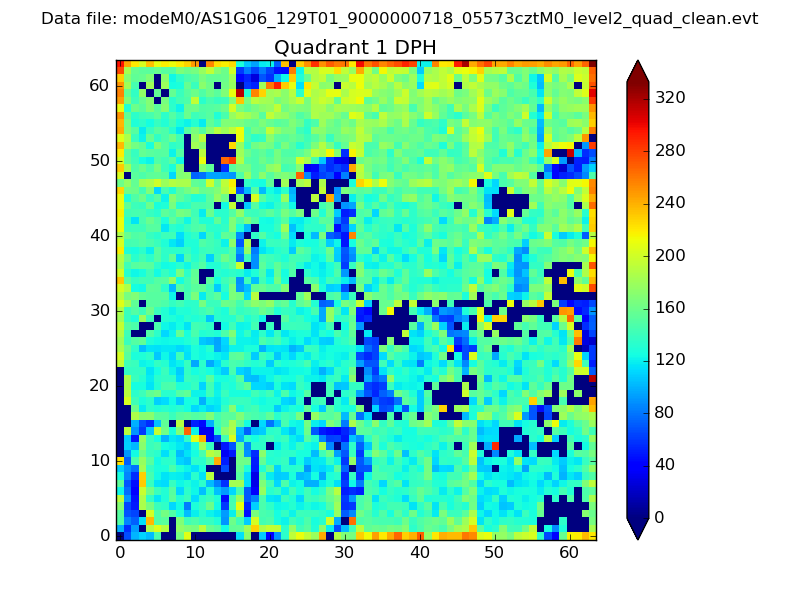
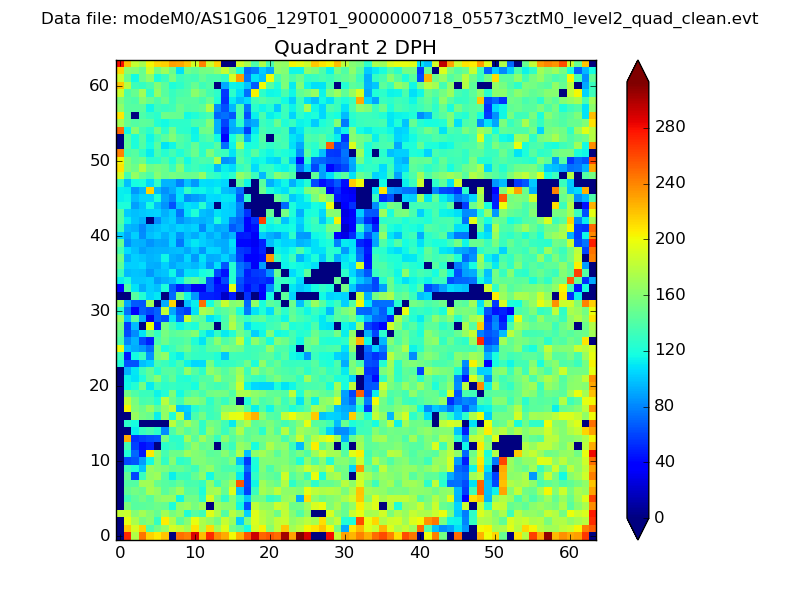
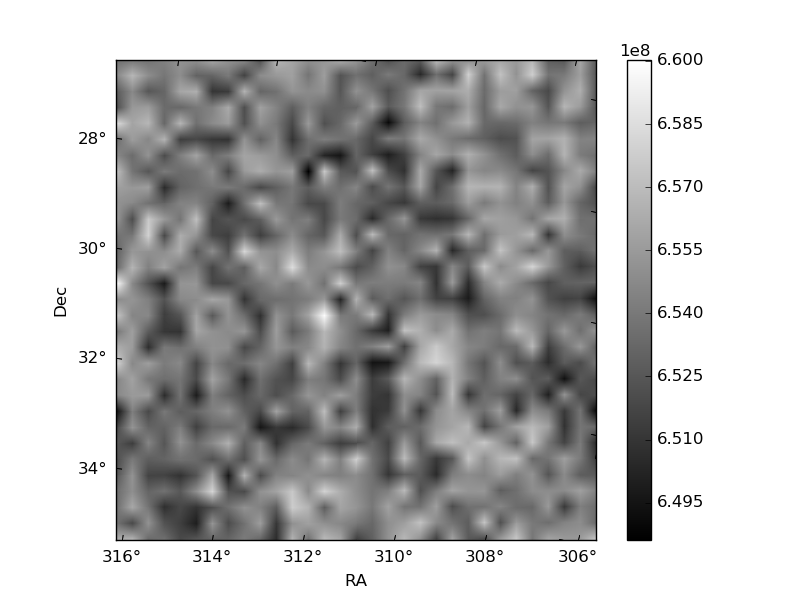
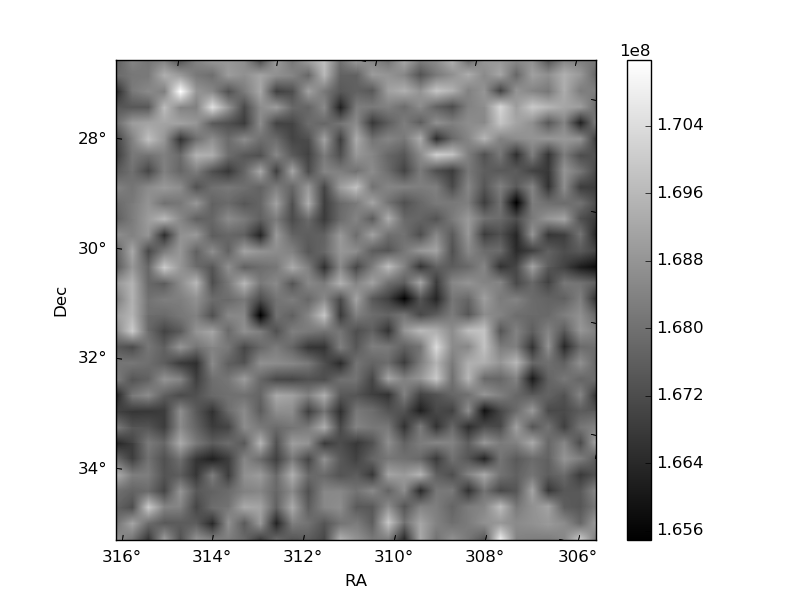
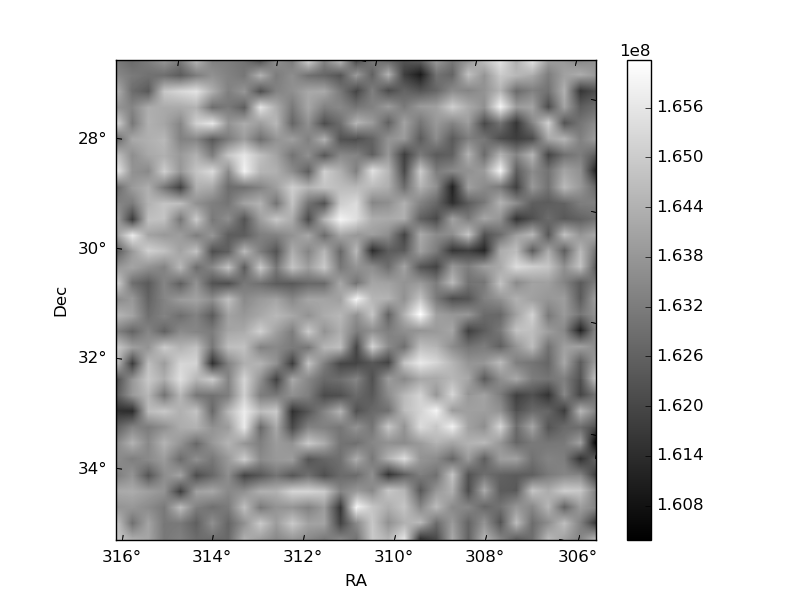
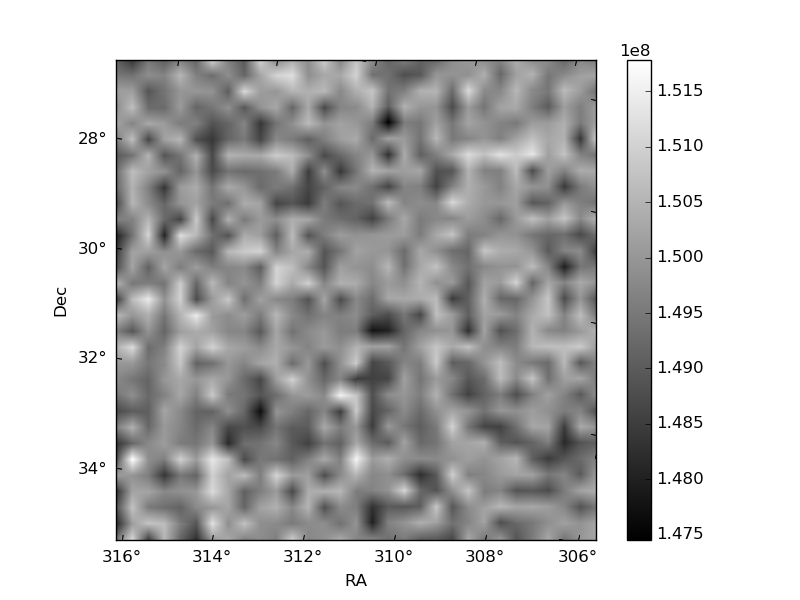
Histogram calculated using DETX and DETY for each event in the final _common_clean file
| Quadrant A | 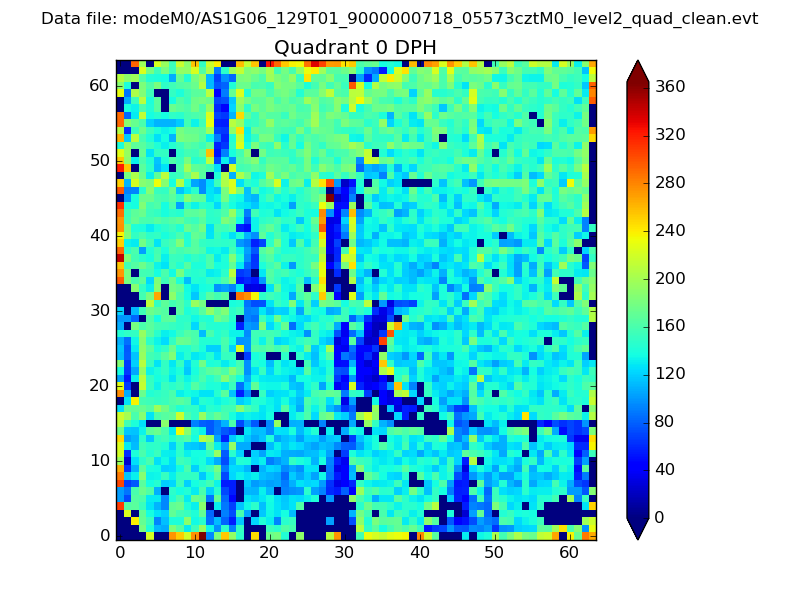 |
 |
Quadrant B |
|---|---|---|---|
| Quadrant D | 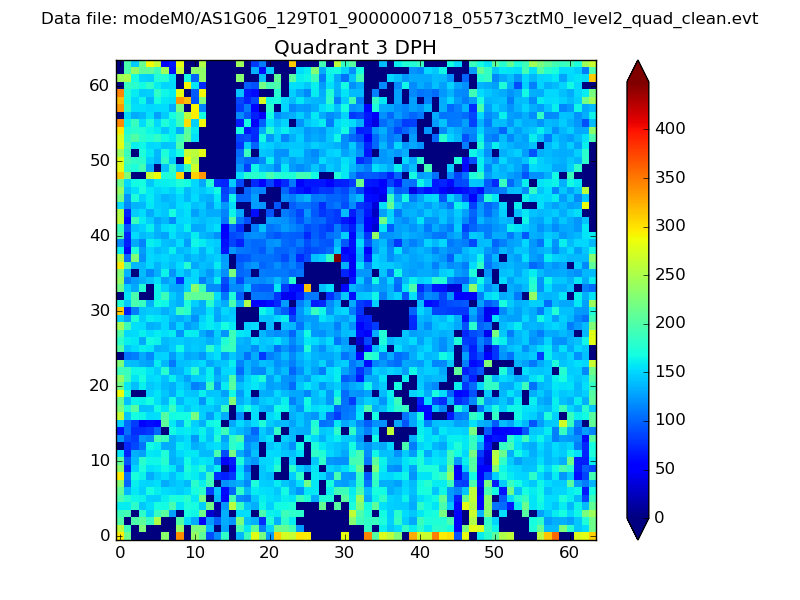 |
 |
Quadrant C |
| Plot type | Count rate plots | Images |
|---|---|---|
| Comparison with Poisson distribution Blue bars denote a histogram of data divided into 1 sec bins. Red curve is a Poisson curve with rate = median count rate of data. |
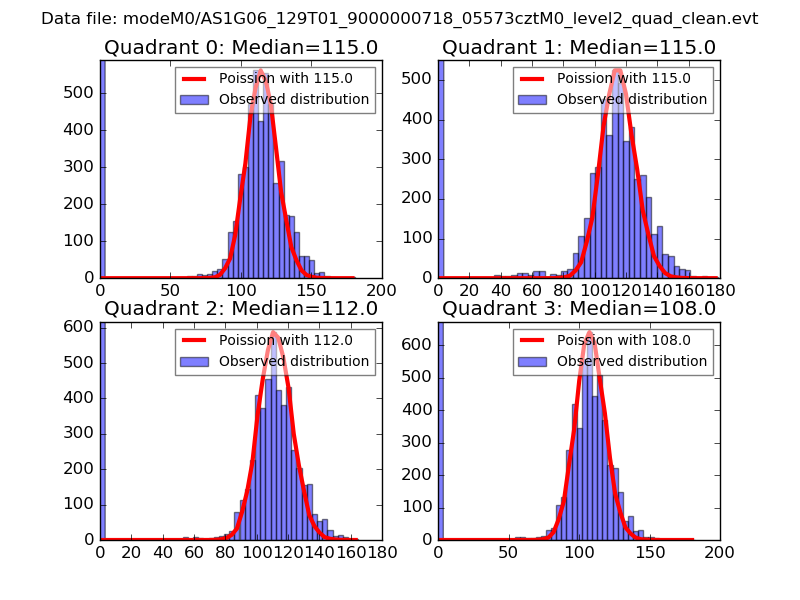 |
 |
| Quadrant-wise count rates Data is divided into 100 sec bins |
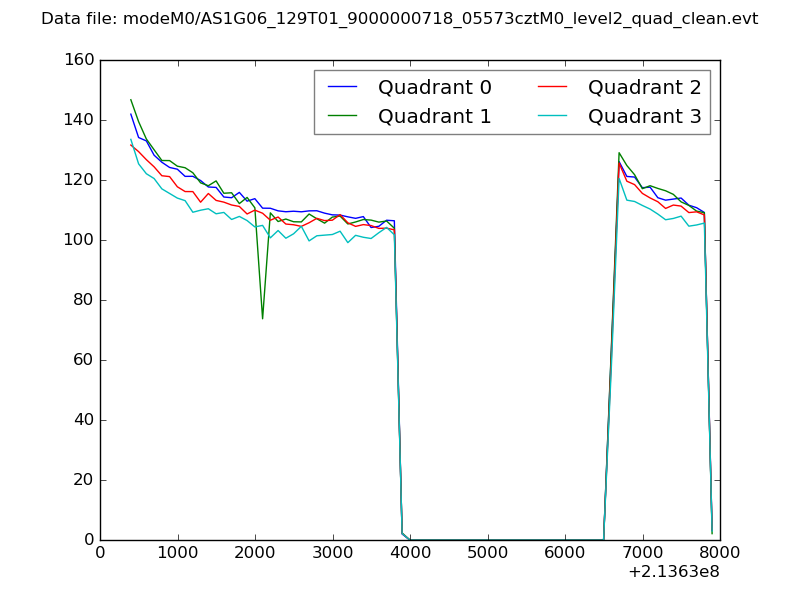 |
|
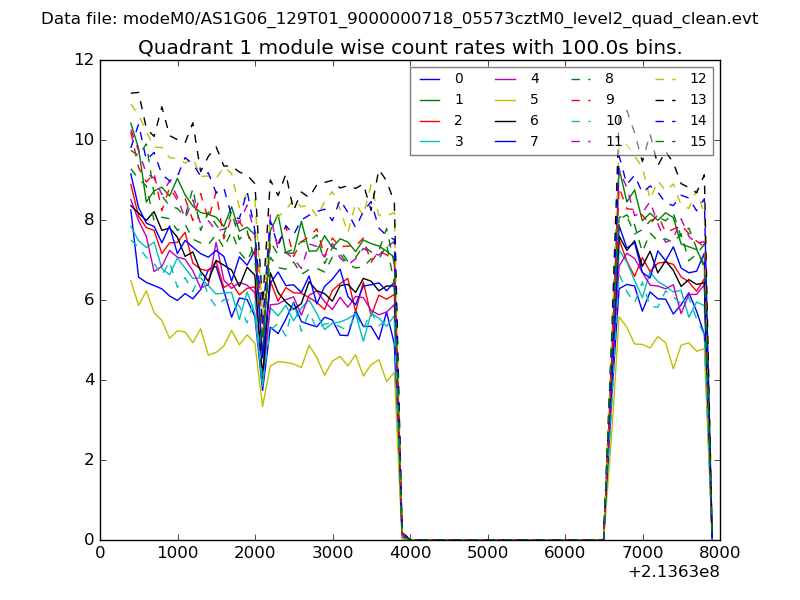
| Module-wise count rates for Quadrant A Data is divided into 100 sec bins |
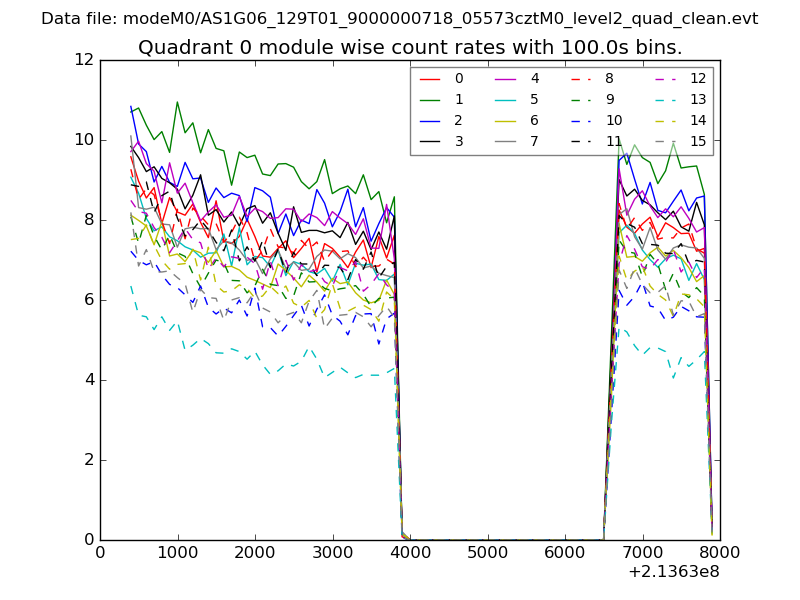 |
 |
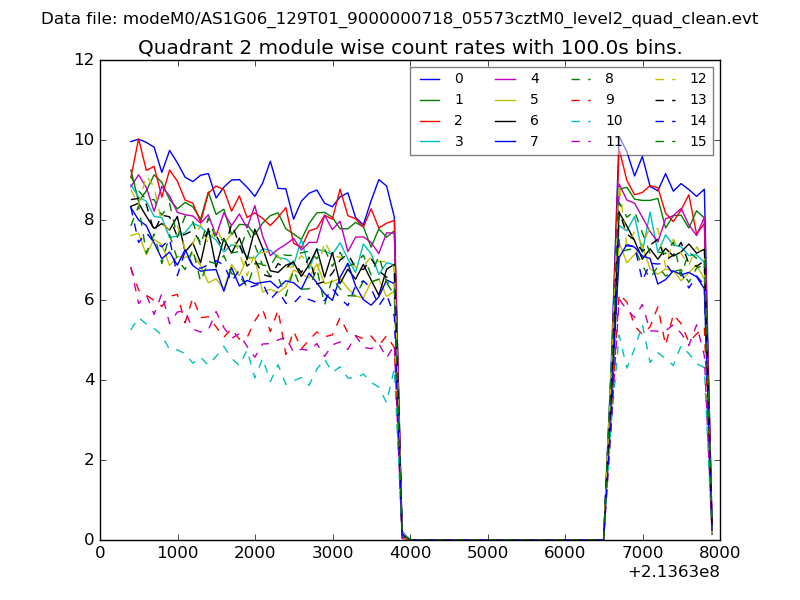
| Module-wise count rates for Quadrant B Data is divided into 100 sec bins |
 |
 |
| Module-wise count rates for Quadrant C Data is divided into 100 sec bins |
 |
 |
| Module-wise count rates for Quadrant D Data is divided into 100 sec bins |
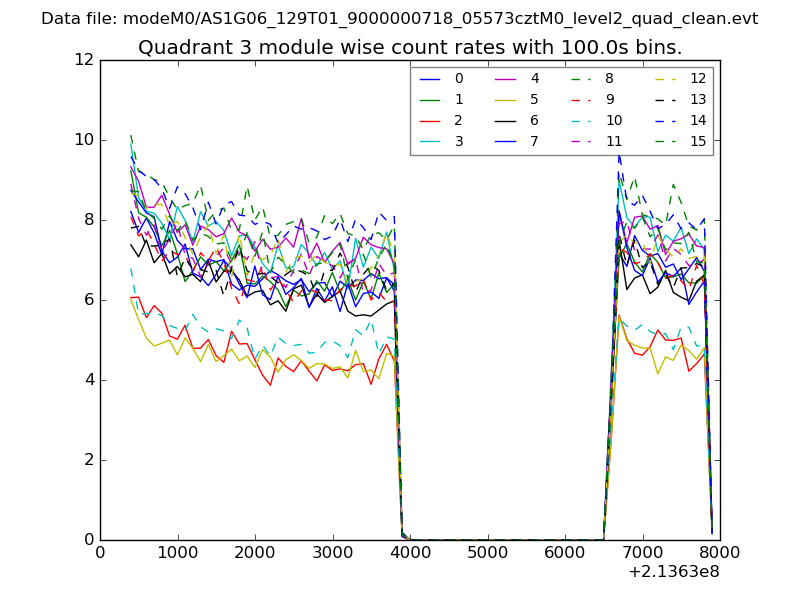 |
 |
| Parameter | Plot |
|---|---|
| CZT HV Monitor | 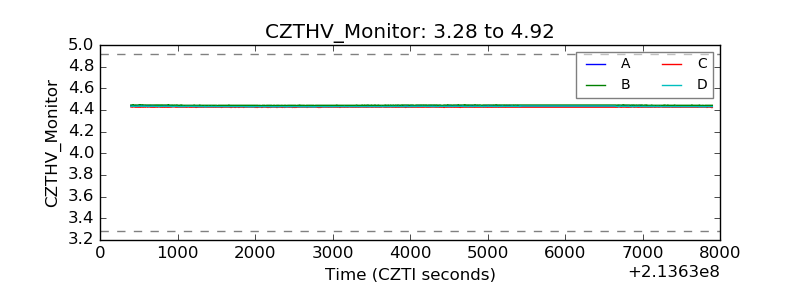 |
| D_VDD | 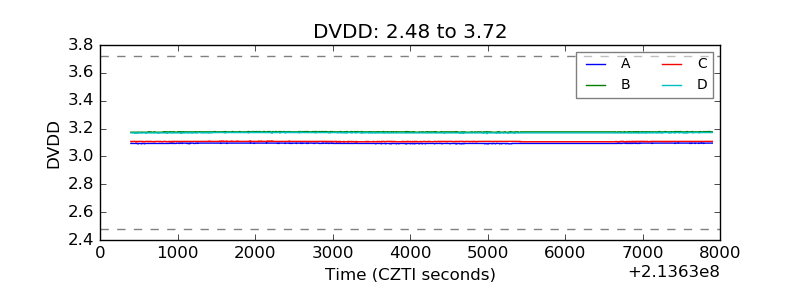 |
| Temperature 1 |  |
| Veto HV Monitor | 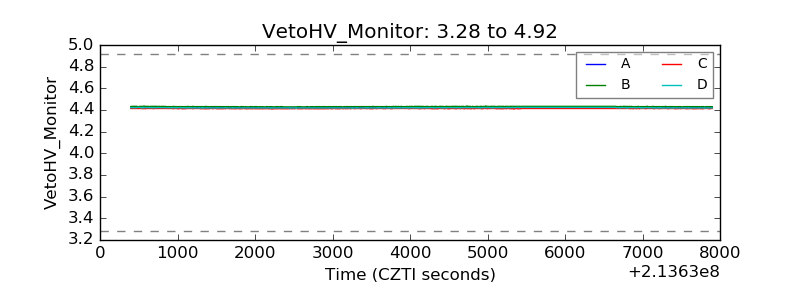 |
| Veto LLD | 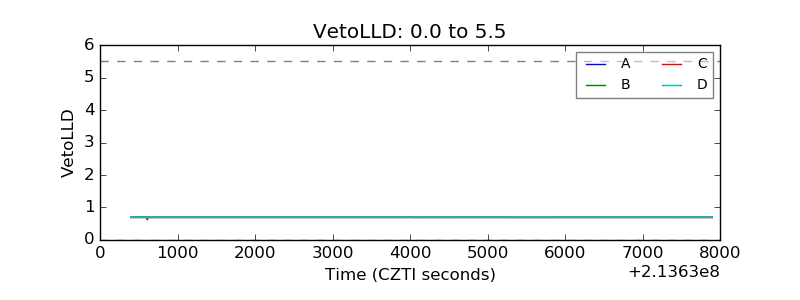 |
| Alpha Counter | 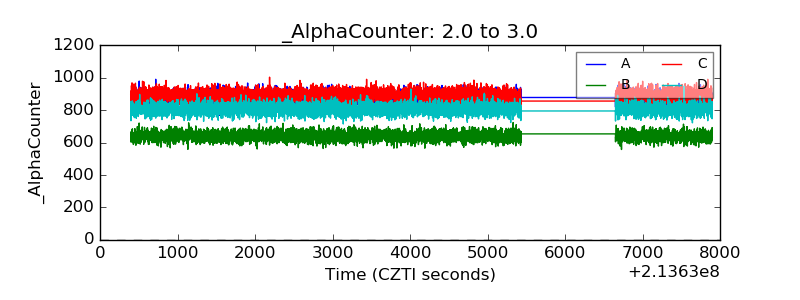 |
| _CPM_Rate | 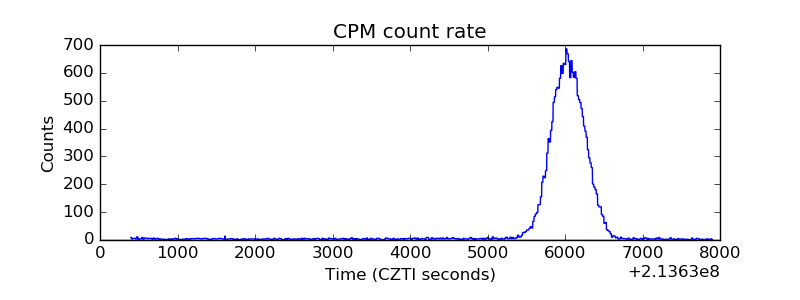 |
| CZT Counter | 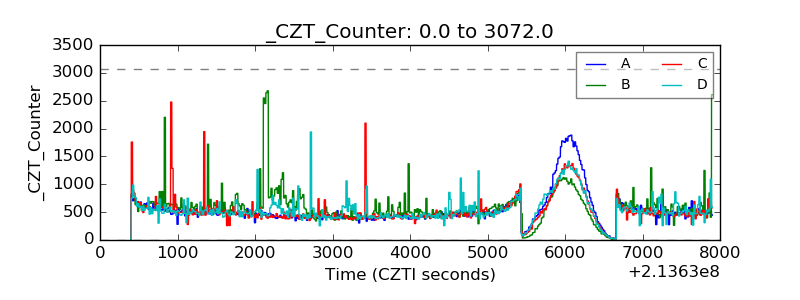 |
| +2.5 Volts monitor | 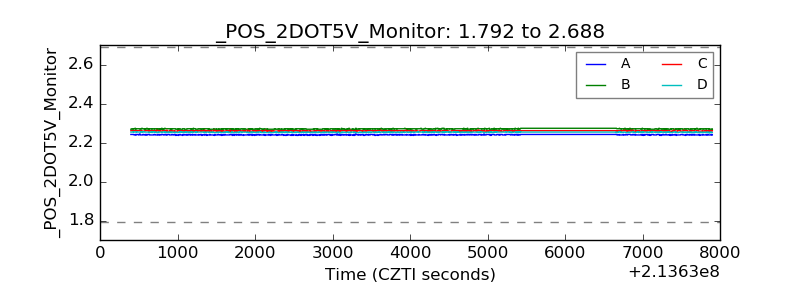 |
| +5 Volts monitor |  |
| _ROLL_ROT | 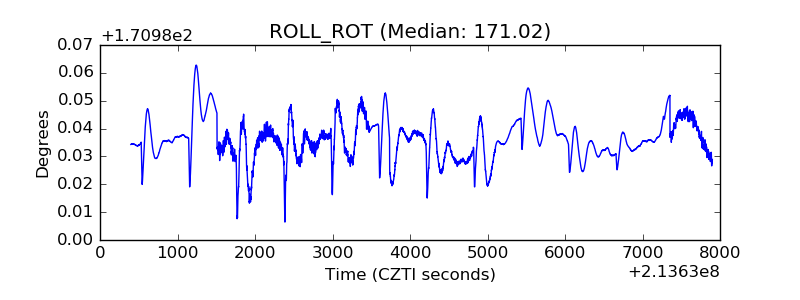 |
| _Roll_DEC | 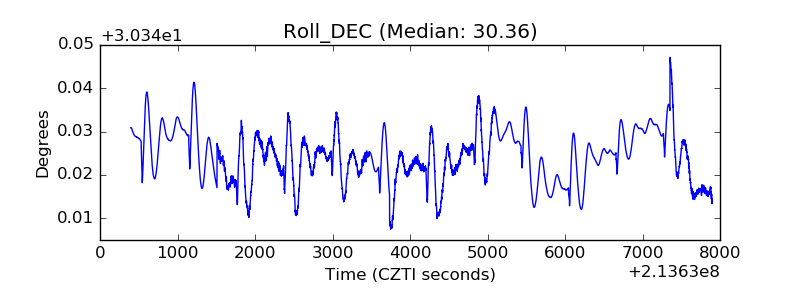 |
| _Roll_RA | 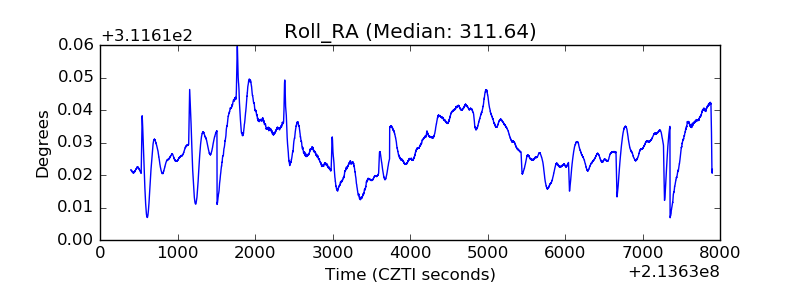 |
| Veto Counter | 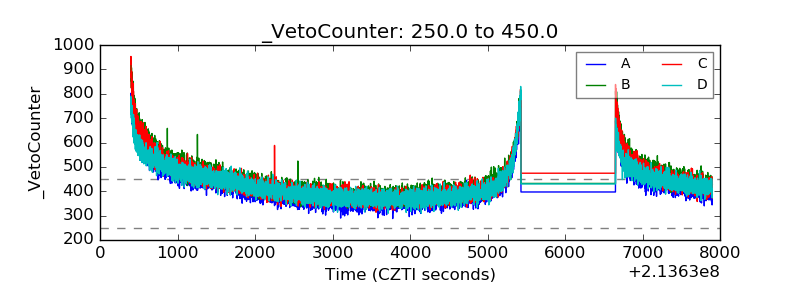 |