| Param | Original file | Final file |
|---|---|---|
| Filename | modeM0/AS1A02_081T01_9000000720_05574cztM0_level2.evt | modeM0/AS1A02_081T01_9000000720_05574cztM0_level2_quad_clean.evt |
| Size (bytes) | 310,080,960 | 48,159,360 |
| Size | 295.7 MB | 45.9 MB |
| Events in quadrant A | 2,065,555 | 295,868 |
| Events in quadrant B | 2,339,899 | 294,061 |
| Events in quadrant C | 2,038,117 | 285,395 |
| Events in quadrant D | 2,642,757 | 268,666 |
| Mode M9 | |||
|---|---|---|---|
| Quadrant | BADHDUFLAG | Total packets | Discarded packets |
| A | 0 | 10 | 0 |
| B | 0 | 10 | 0 |
| C | 0 | 10 | 0 |
| D | 0 | 10 | 0 |
| Mode SS | |||
|---|---|---|---|
| Quadrant | BADHDUFLAG | Total packets | Discarded packets |
| A | 0 | 92 | 0 |
| B | 0 | 92 | 0 |
| C | 0 | 92 | 0 |
| D | 0 | 92 | 0 |
| Mode M0 | |||
|---|---|---|---|
| Quadrant | BADHDUFLAG | Total packets | Discarded packets |
| A | 0 | 9325 | 2 |
| B | 0 | 9925 | 1 |
| C | 0 | 9280 | 1 |
| D | 0 | 10858 | 1 |
| Quadrant | Total seconds | Saturated seconds | Saturation percentage |
|---|---|---|---|
| A | 4458 | 58 | 1.301032% |
| B | 4458 | 65 | 1.458053% |
| C | 4458 | 59 | 1.323463% |
| D | 4458 | 181 | 4.060117% |
Noise dominated data is calculated using 1-second bins in cleaned event files. If a bin has >2000 counts, and if more than 50% of those come from <1% of pixels, then it is considered to be noise-dominated and hence unusable.
| Quadrant | # 1 sec bins | Bins with >0 counts | Bins with >2000 counts | High rate bins dominated by noise | Noise dominated (total time) | Noise dominated (detector-on time) | Marked lightcurve |
|---|---|---|---|---|---|---|---|
| A | 5503 | 4459 | 2 | 2 | 0.04% | 0.04% | 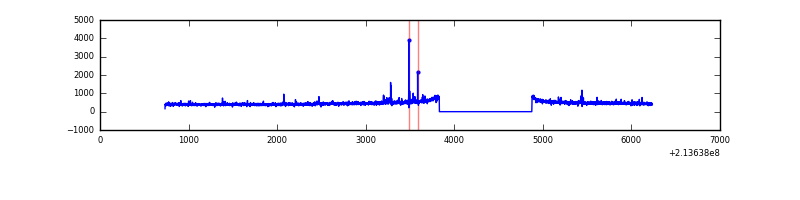 |
| B | 5503 | 4459 | 5 | 5 | 0.09% | 0.11% | 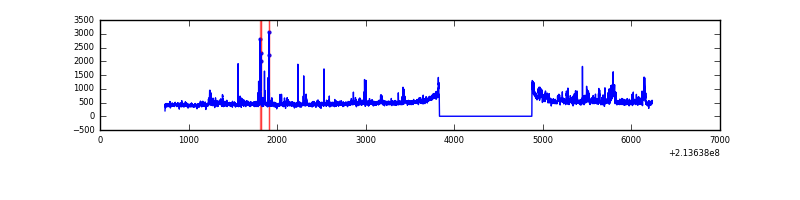 |
| C | 5503 | 4459 | 0 | 0 | 0.00% | 0.00% | 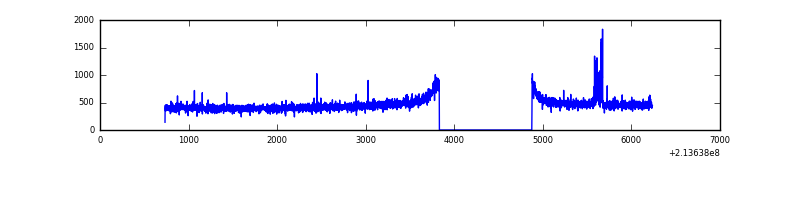 |
| D | 5503 | 4459 | 76 | 76 | 1.38% | 1.70% | 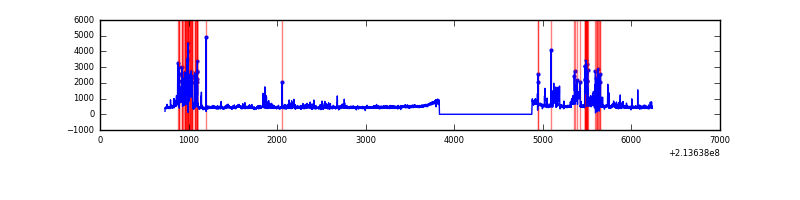 |
Top three noisy pixels from each quadrant. If the there are fewer than three noisy pixels in the level2.evt file, extra rows are filled as -1
| Pixel properties | Quadrant properties | ||||||
|---|---|---|---|---|---|---|---|
| Quadrant | DetID | PixID | Counts | Sigma | Mean | Median | Sigma |
| A | 7 | 16 | 35972 | 330.32 | 521 | 509 | 107.4 |
| A | 13 | 14 | 12020 | 107.22 | 521 | 509 | 107.4 |
| A | 0 | 50 | 9919 | 87.65 | 521 | 509 | 107.4 |
| B | 15 | 204 | 195885 | 1913.32 | 526 | 513 | 102.1 |
| B | 10 | 245 | 53588 | 519.77 | 526 | 513 | 102.1 |
| B | 4 | 48 | 28773 | 276.76 | 526 | 513 | 102.1 |
| C | 9 | 16 | 42690 | 354.48 | 509 | 510 | 119.0 |
| C | 13 | 61 | 4121 | 30.35 | 509 | 510 | 119.0 |
| C | 8 | 222 | 3230 | 22.86 | 509 | 510 | 119.0 |
| D | 2 | 152 | 240753 | 1945.87 | 503 | 489 | 123.5 |
| D | 2 | 63 | 184123 | 1487.23 | 503 | 489 | 123.5 |
| D | 11 | 241 | 104059 | 838.8 | 503 | 489 | 123.5 |
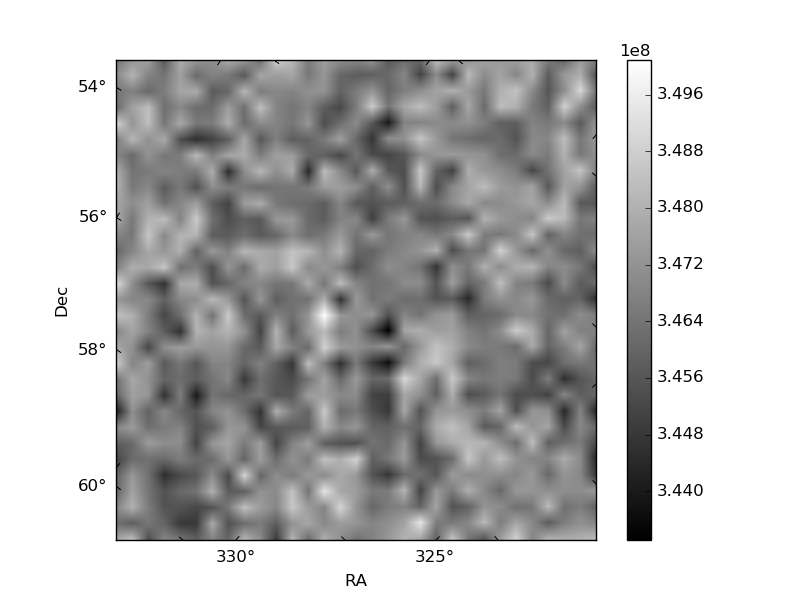
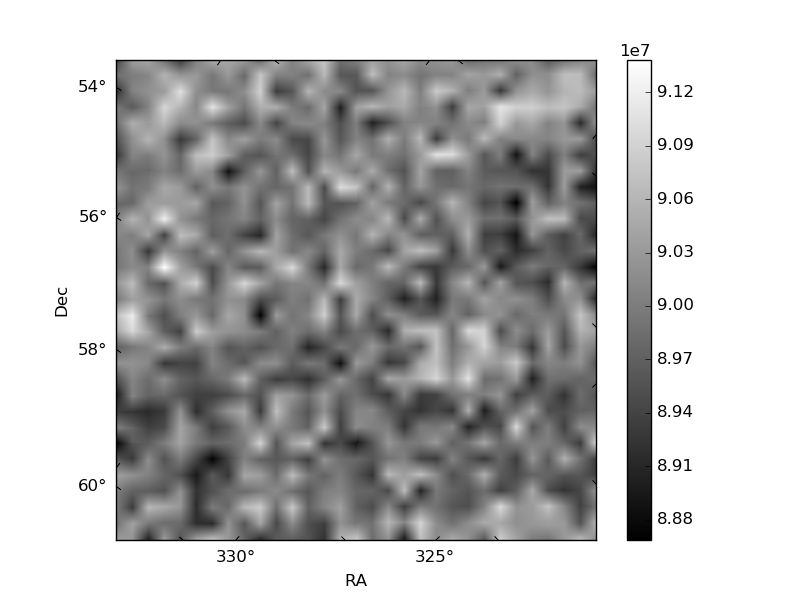
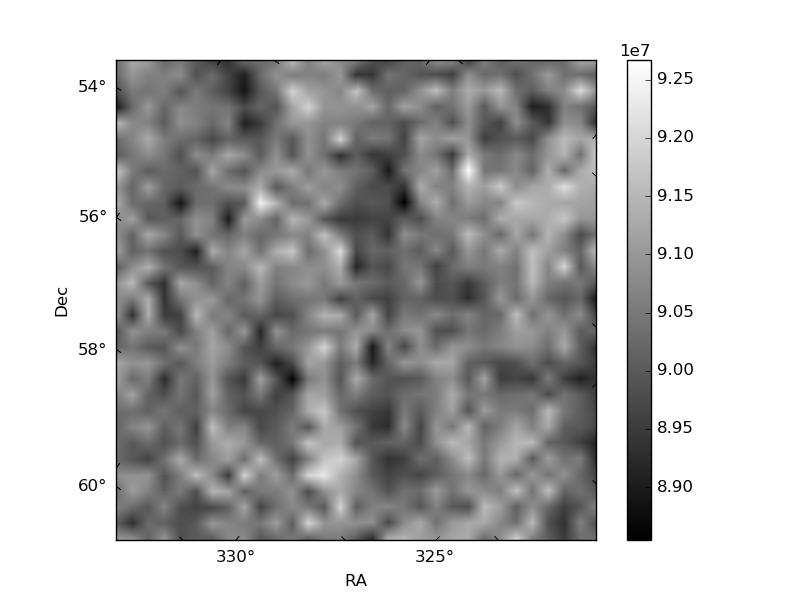
Histogram calculated using DETX and DETY for each event in the final _common_clean file
| Quadrant A | 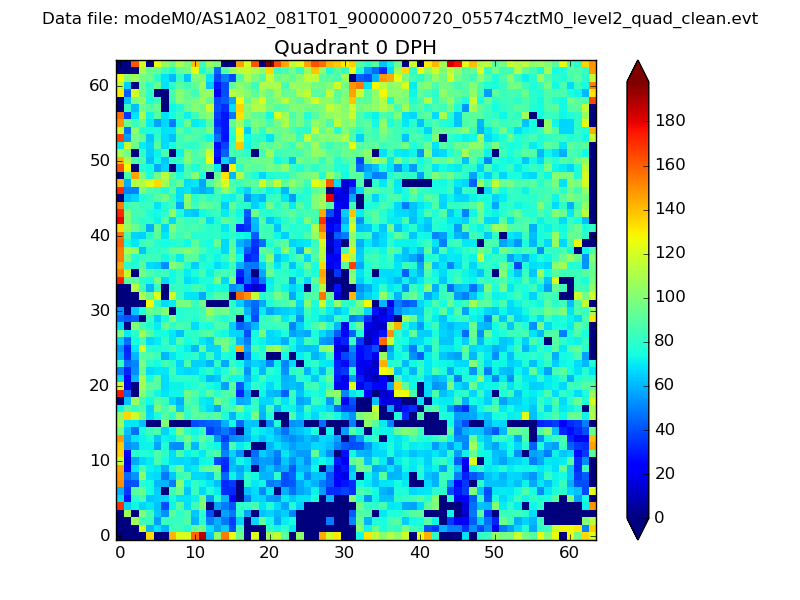 |
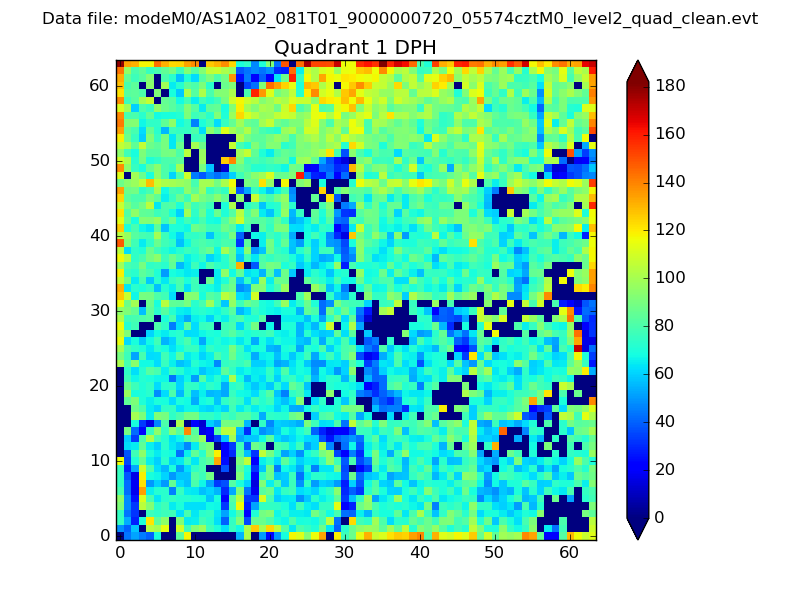 |
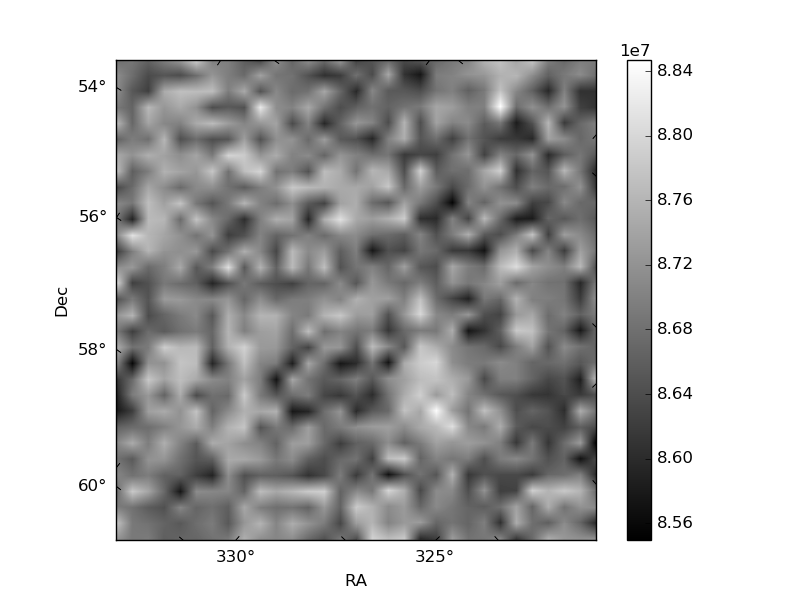
Quadrant B |
|---|---|---|---|
| Quadrant D | 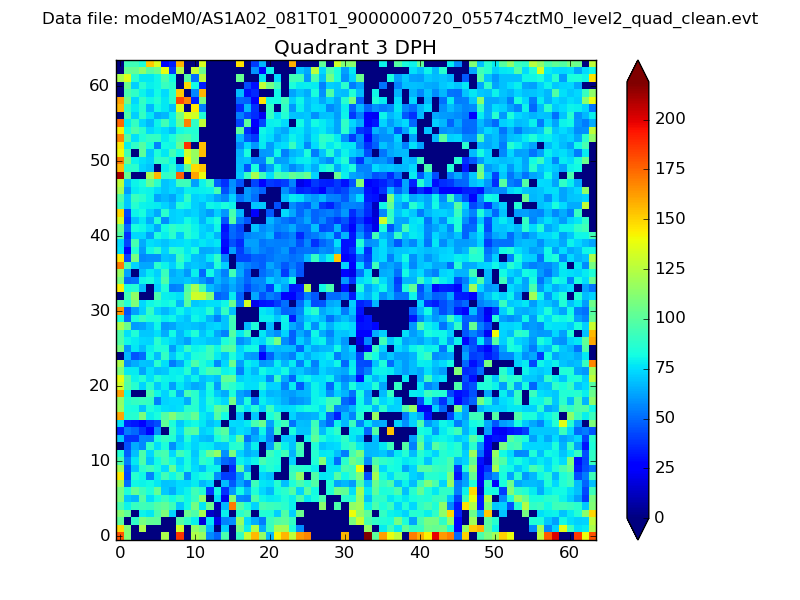 |
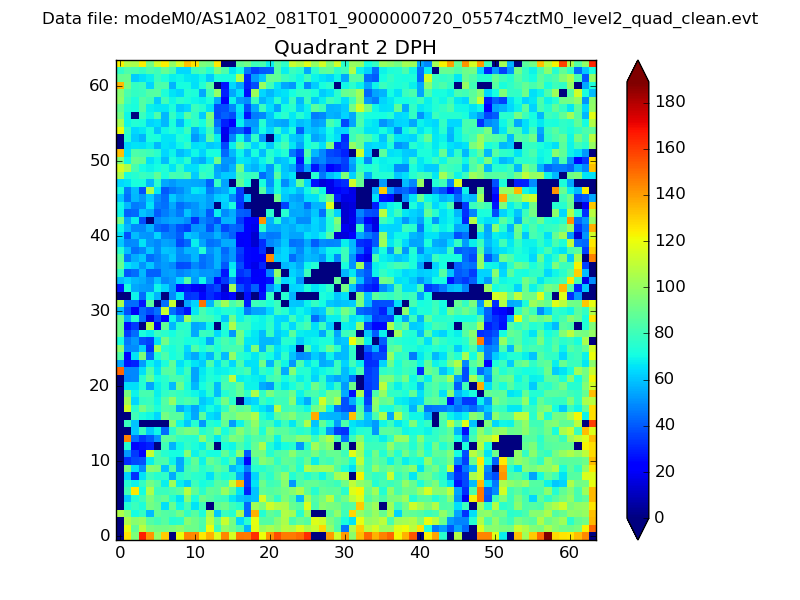 |
Quadrant C |
| Plot type | Count rate plots | Images |
|---|---|---|
| Comparison with Poisson distribution Blue bars denote a histogram of data divided into 1 sec bins. Red curve is a Poisson curve with rate = median count rate of data. |
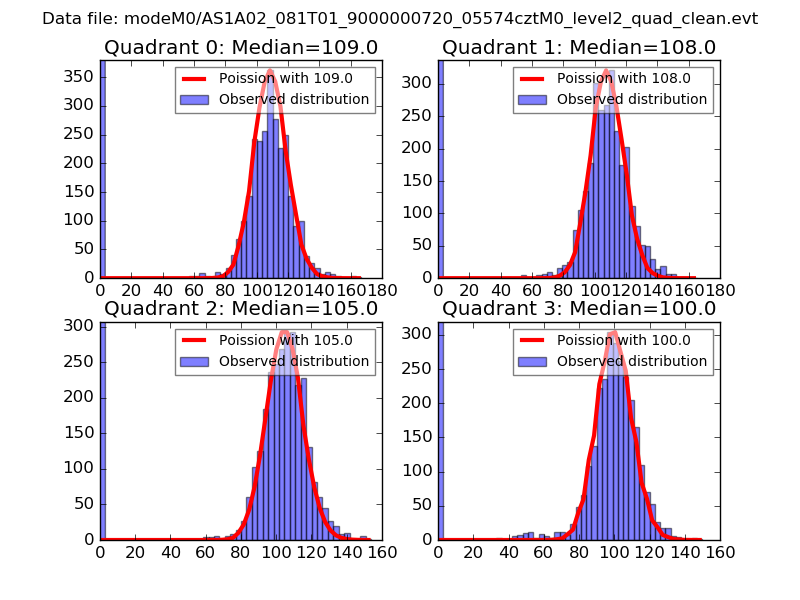 |
 |
| Quadrant-wise count rates Data is divided into 100 sec bins |
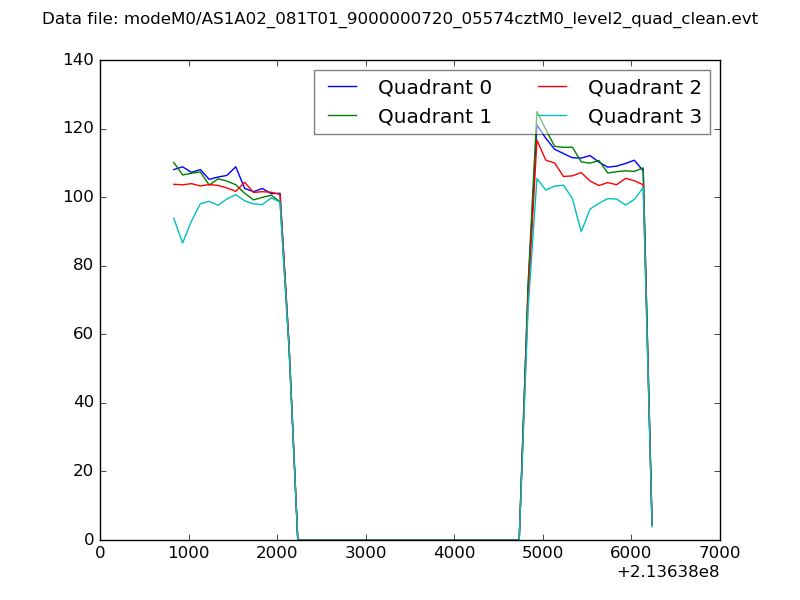 |
|
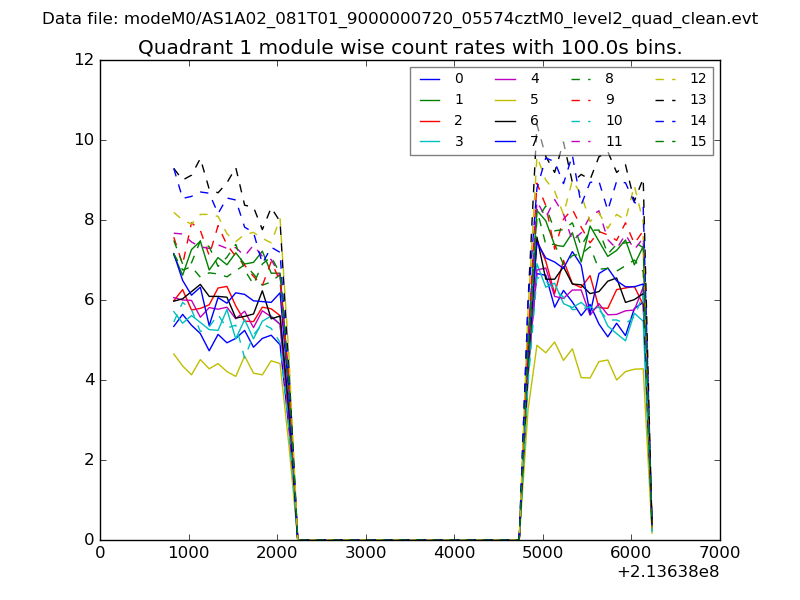
| Module-wise count rates for Quadrant A Data is divided into 100 sec bins |
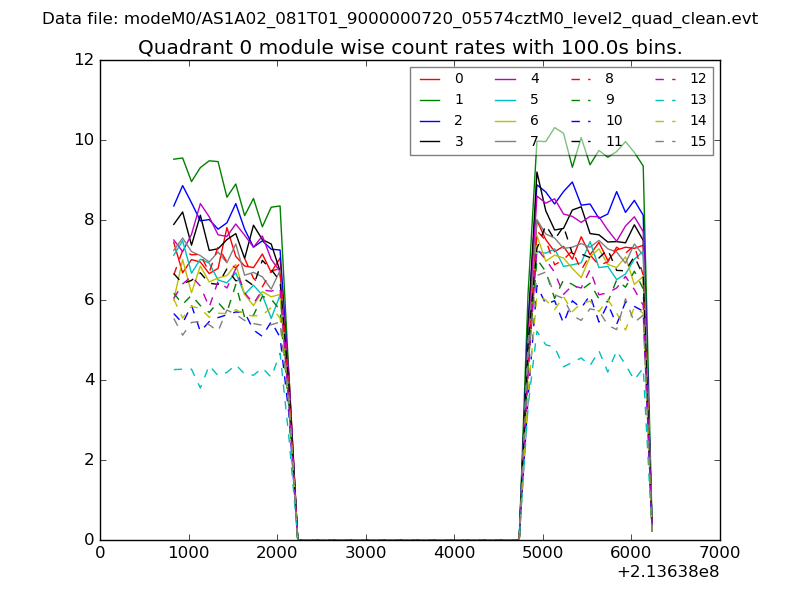 |
 |
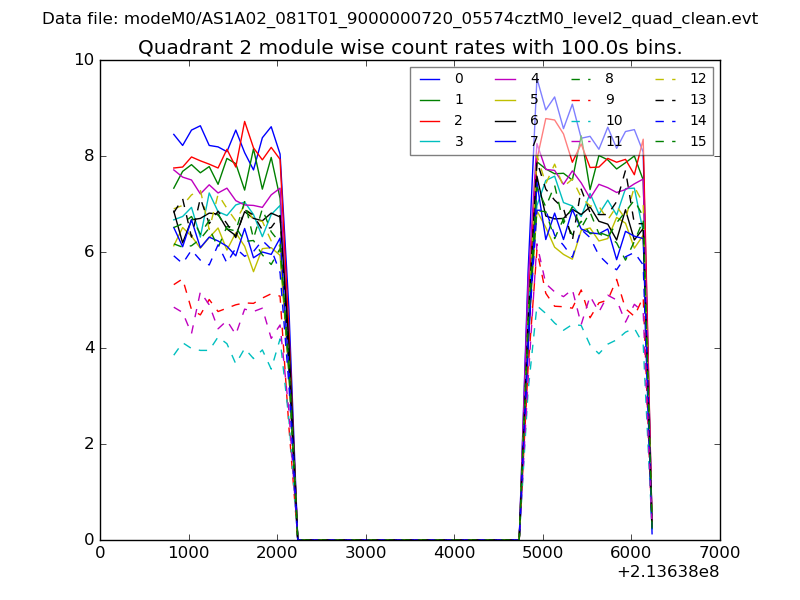
| Module-wise count rates for Quadrant B Data is divided into 100 sec bins |
 |
 |
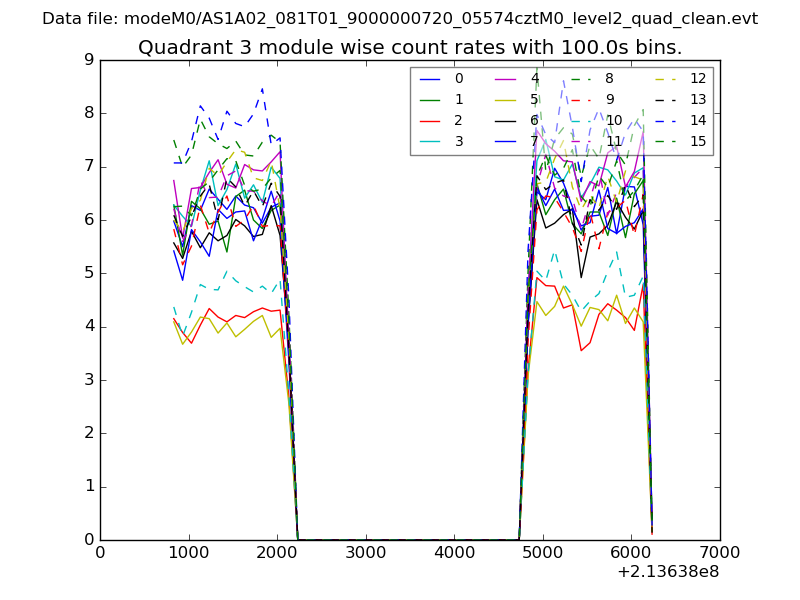
| Module-wise count rates for Quadrant C Data is divided into 100 sec bins |
 |
 |
| Module-wise count rates for Quadrant D Data is divided into 100 sec bins |
 |
 |
| Parameter | Plot |
|---|---|
| CZT HV Monitor | 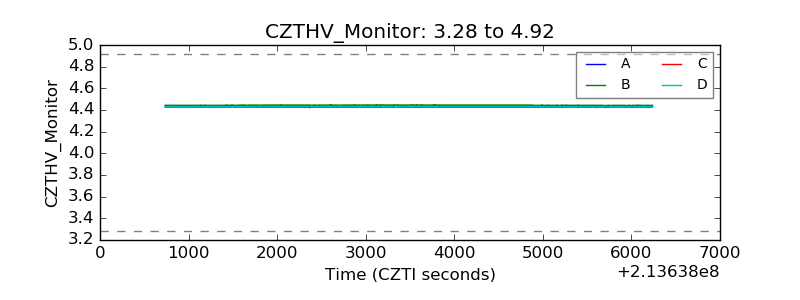 |
| D_VDD |  |
| Temperature 1 | 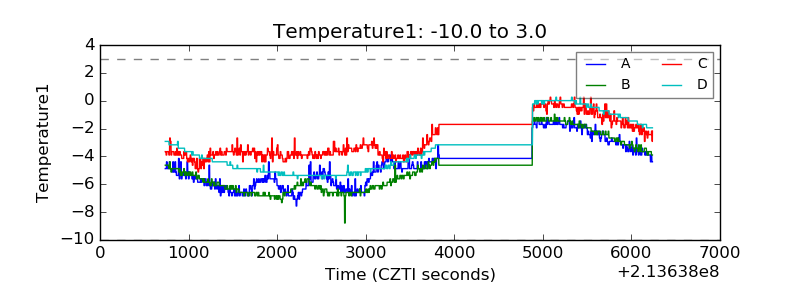 |
| Veto HV Monitor | 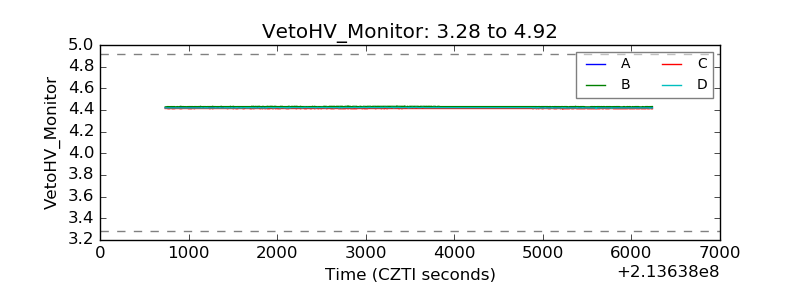 |
| Veto LLD | 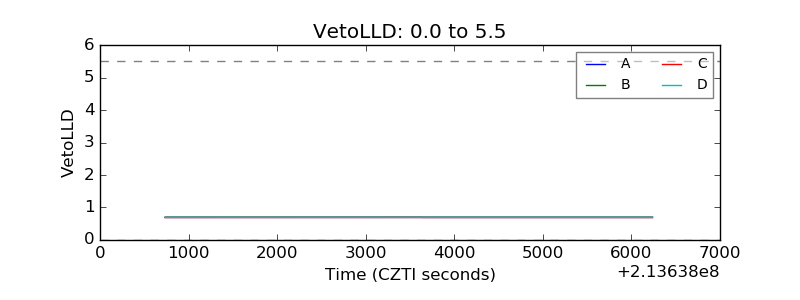 |
| Alpha Counter | 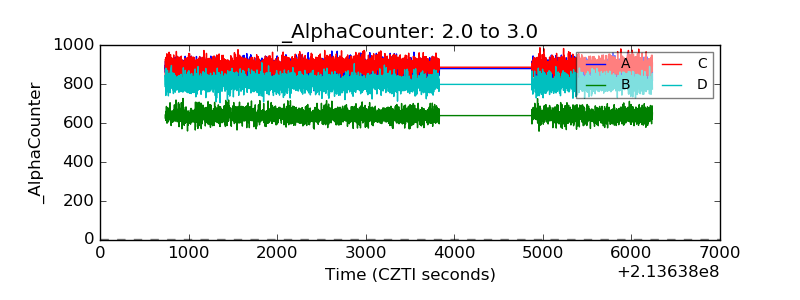 |
| _CPM_Rate | 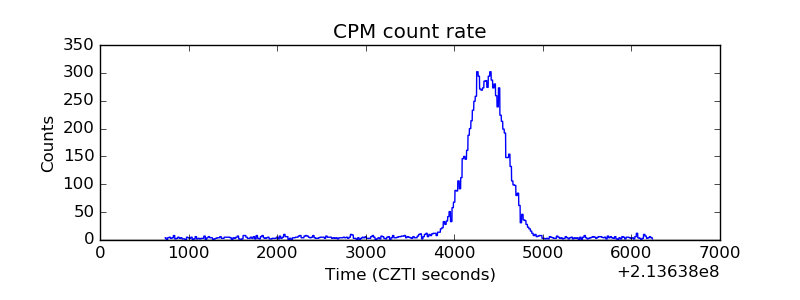 |
| CZT Counter | 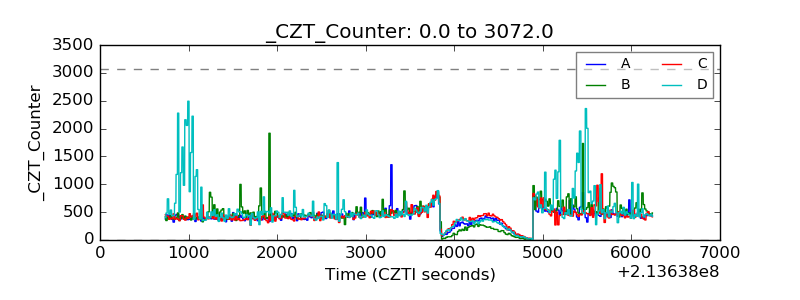 |
| +2.5 Volts monitor |  |
| +5 Volts monitor |  |
| _ROLL_ROT | 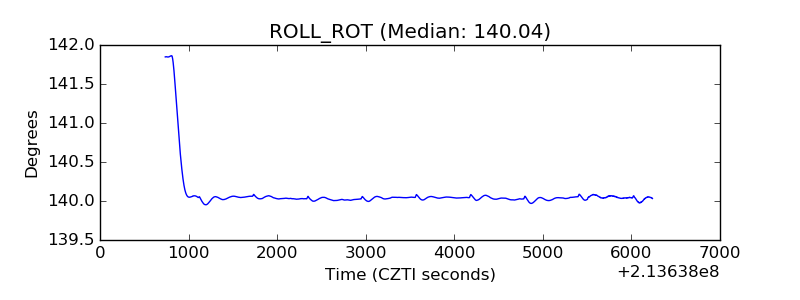 |
| _Roll_DEC | 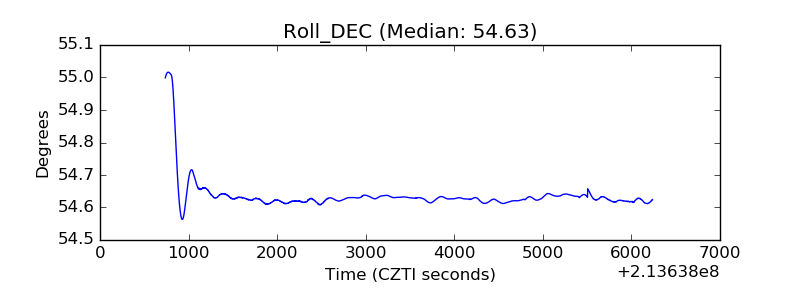 |
| _Roll_RA | 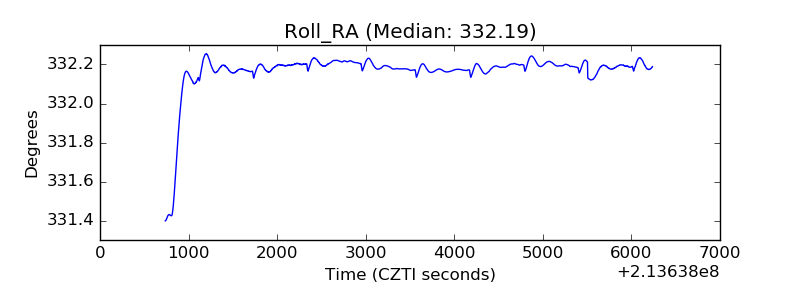 |
| Veto Counter | 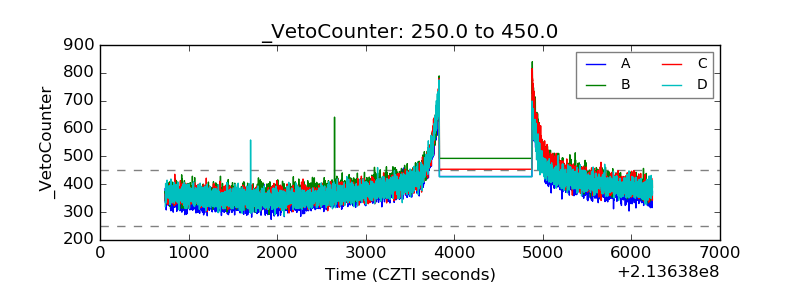 |