| Param | Original file | Final file |
|---|---|---|
| Filename | modeM0/AS1A02_081T01_9000000720_05577cztM0_level2.evt | modeM0/AS1A02_081T01_9000000720_05577cztM0_level2_quad_clean.evt |
| Size (bytes) | 541,736,640 | 103,815,360 |
| Size | 516.6 MB | 99.0 MB |
| Events in quadrant A | 3,751,406 | 662,058 |
| Events in quadrant B | 4,378,612 | 660,783 |
| Events in quadrant C | 3,746,907 | 642,967 |
| Events in quadrant D | 3,978,513 | 613,921 |
| Mode M9 | |||
|---|---|---|---|
| Quadrant | BADHDUFLAG | Total packets | Discarded packets |
| A | 0 | 6 | 0 |
| B | 0 | 6 | 0 |
| C | 0 | 6 | 0 |
| D | 0 | 6 | 0 |
| Mode SS | |||
|---|---|---|---|
| Quadrant | BADHDUFLAG | Total packets | Discarded packets |
| A | 0 | 164 | 0 |
| B | 0 | 164 | 0 |
| C | 0 | 164 | 0 |
| D | 0 | 164 | 0 |
| Mode M0 | |||
|---|---|---|---|
| Quadrant | BADHDUFLAG | Total packets | Discarded packets |
| A | 0 | 16992 | 3 |
| B | 0 | 18612 | 2 |
| C | 0 | 17009 | 2 |
| D | 0 | 17653 | 2 |
| Quadrant | Total seconds | Saturated seconds | Saturation percentage |
|---|---|---|---|
| A | 8118 | 64 | 0.788372% |
| B | 8118 | 141 | 1.736881% |
| C | 8118 | 56 | 0.689825% |
| D | 8118 | 48 | 0.591279% |
Noise dominated data is calculated using 1-second bins in cleaned event files. If a bin has >2000 counts, and if more than 50% of those come from <1% of pixels, then it is considered to be noise-dominated and hence unusable.
| Quadrant | # 1 sec bins | Bins with >0 counts | Bins with >2000 counts | High rate bins dominated by noise | Noise dominated (total time) | Noise dominated (detector-on time) | Marked lightcurve |
|---|---|---|---|---|---|---|---|
| A | 8703 | 8121 | 3 | 3 | 0.03% | 0.04% | 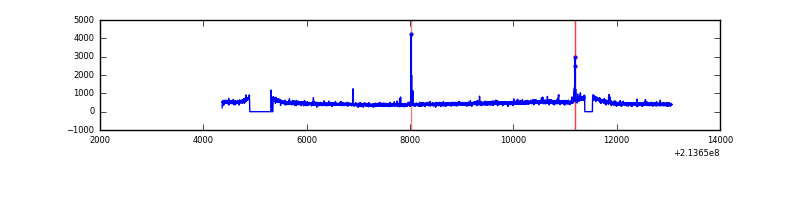 |
| B | 8703 | 8121 | 21 | 21 | 0.24% | 0.26% | 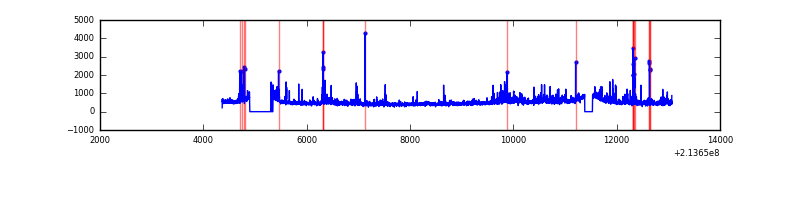 |
| C | 8703 | 8121 | 7 | 7 | 0.08% | 0.09% | 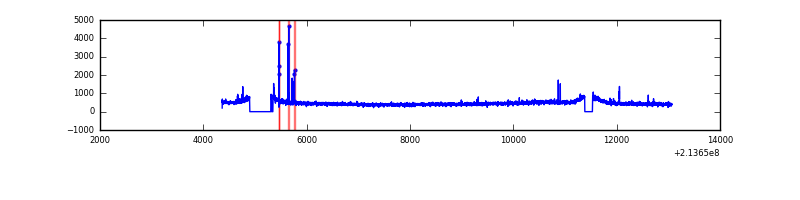 |
| D | 8703 | 8121 | 17 | 17 | 0.20% | 0.21% | 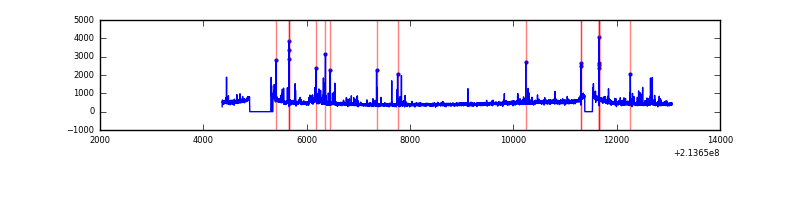 |
Top three noisy pixels from each quadrant. If the there are fewer than three noisy pixels in the level2.evt file, extra rows are filled as -1
| Pixel properties | Quadrant properties | ||||||
|---|---|---|---|---|---|---|---|
| Quadrant | DetID | PixID | Counts | Sigma | Mean | Median | Sigma |
| A | 15 | 174 | 29372 | 145.47 | 955 | 934 | 195.5 |
| A | 7 | 16 | 17558 | 85.03 | 955 | 934 | 195.5 |
| A | 13 | 14 | 15557 | 74.8 | 955 | 934 | 195.5 |
| B | 15 | 204 | 190735 | 1016.37 | 965 | 939 | 186.7 |
| B | 0 | 214 | 101786 | 540.04 | 965 | 939 | 186.7 |
| B | 11 | 51 | 88533 | 469.07 | 965 | 939 | 186.7 |
| C | 9 | 16 | 65885 | 298.05 | 933 | 934 | 217.9 |
| C | 8 | 128 | 16746 | 72.56 | 933 | 934 | 217.9 |
| C | 8 | 112 | 8171 | 33.21 | 933 | 934 | 217.9 |
| D | 8 | 195 | 144316 | 626.8 | 928 | 896 | 228.8 |
| D | 2 | 33 | 103592 | 448.82 | 928 | 896 | 228.8 |
| D | 2 | 152 | 73183 | 315.92 | 928 | 896 | 228.8 |
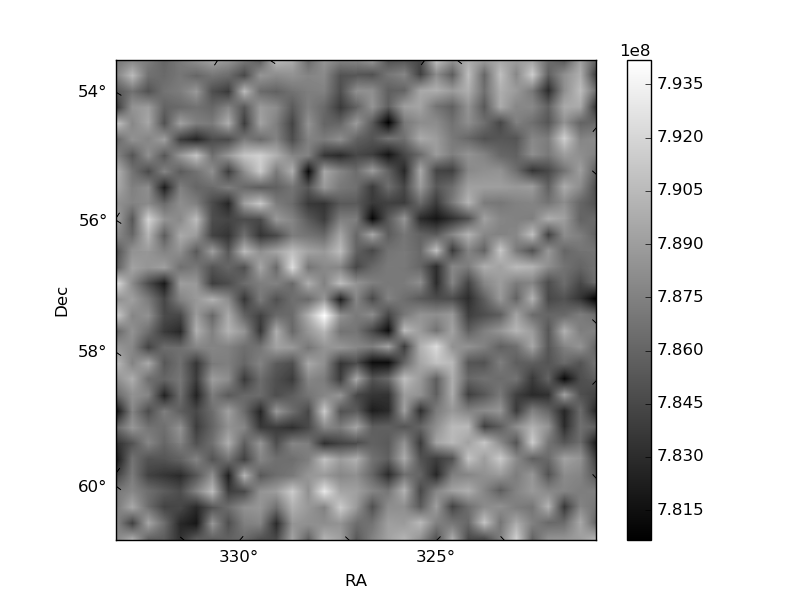
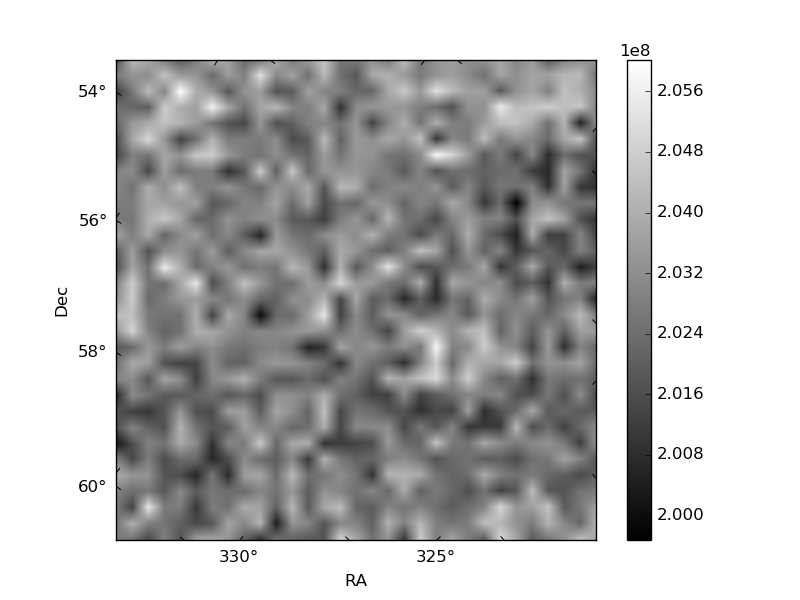
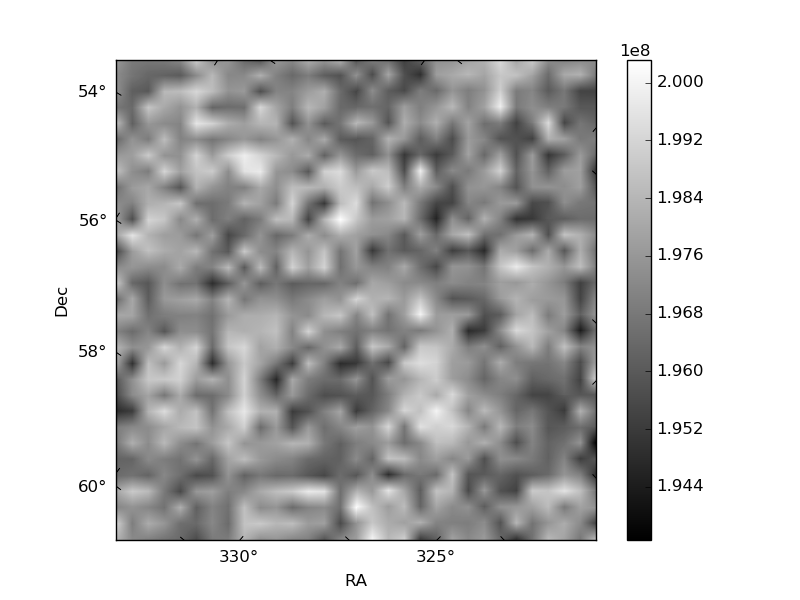
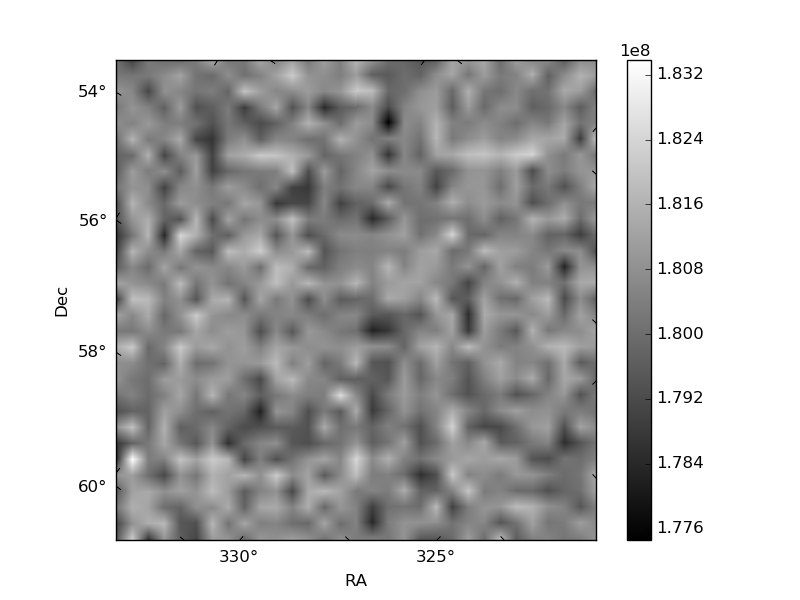
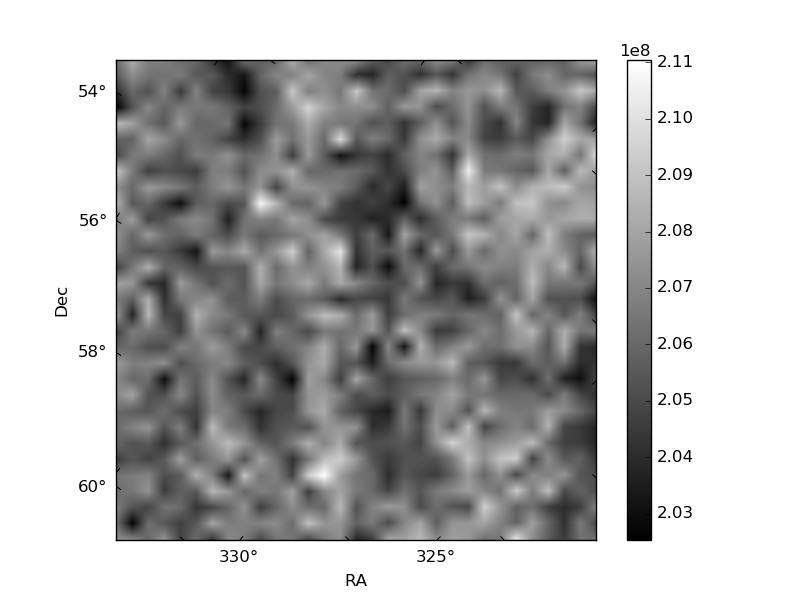
Histogram calculated using DETX and DETY for each event in the final _common_clean file
| Quadrant A | 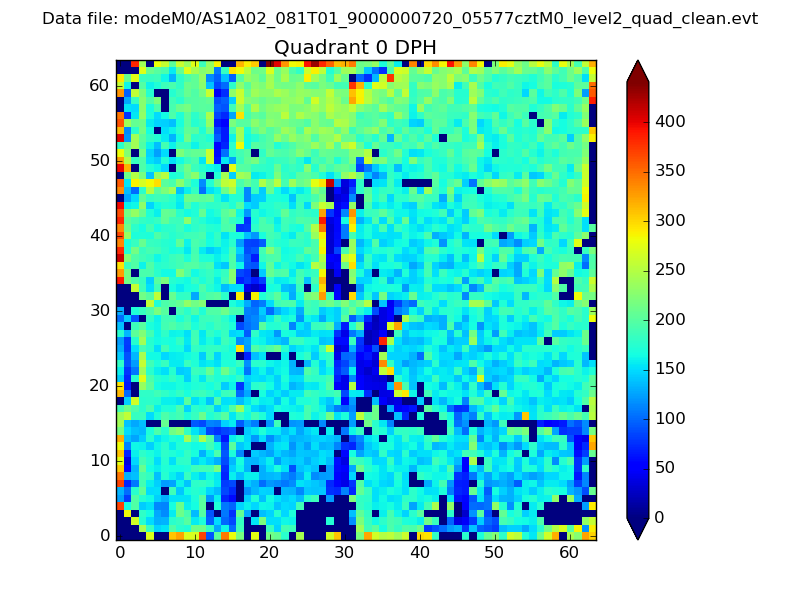 |
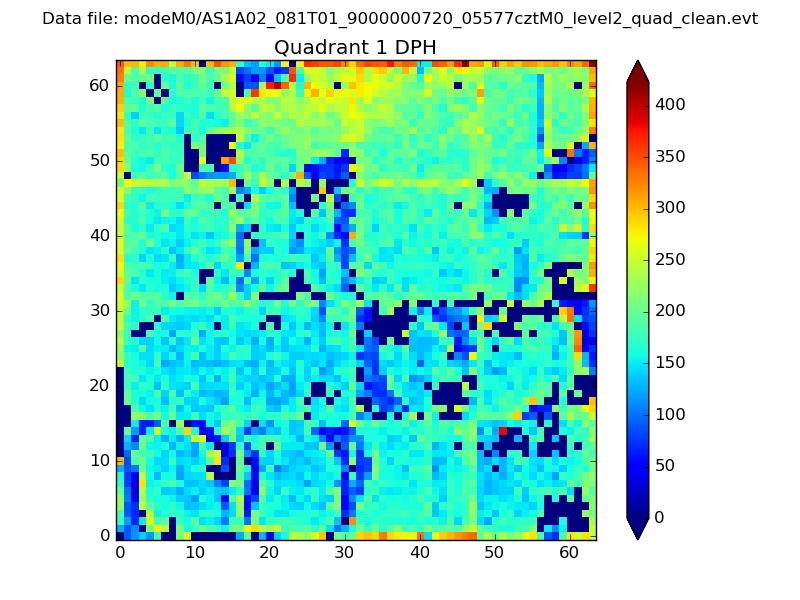 |
Quadrant B |
|---|---|---|---|
| Quadrant D | 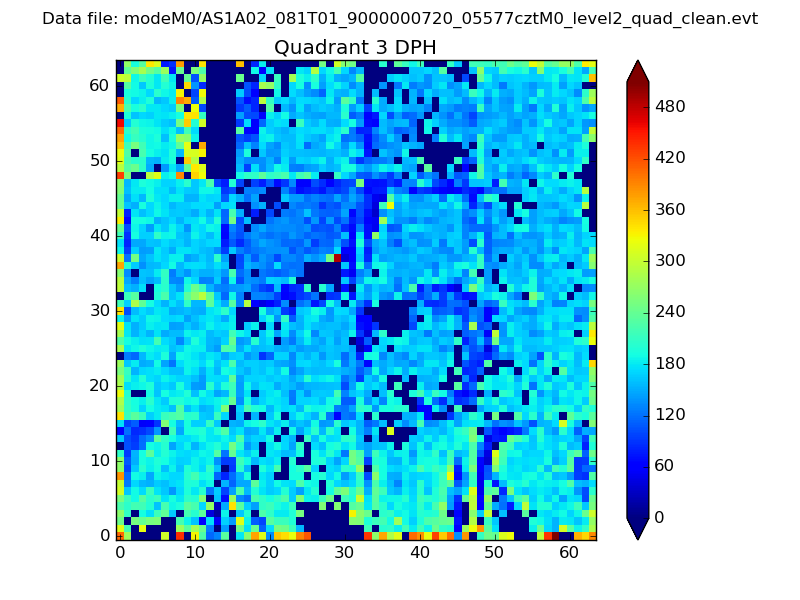 |
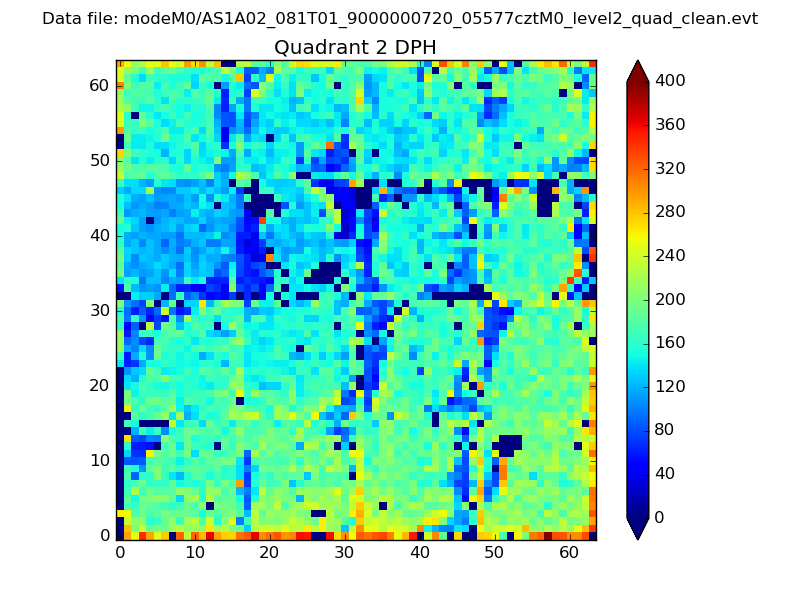 |
Quadrant C |
| Plot type | Count rate plots | Images |
|---|---|---|
| Comparison with Poisson distribution Blue bars denote a histogram of data divided into 1 sec bins. Red curve is a Poisson curve with rate = median count rate of data. |
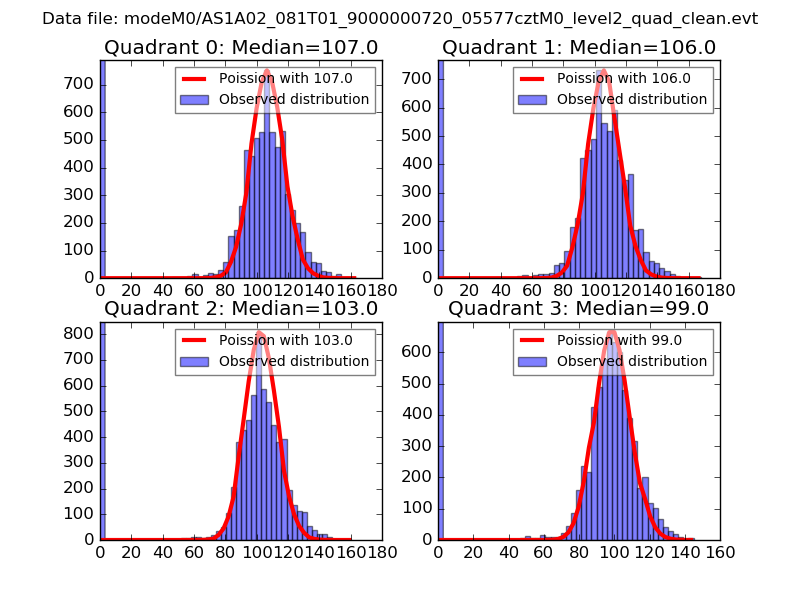 |
 |
| Quadrant-wise count rates Data is divided into 100 sec bins |
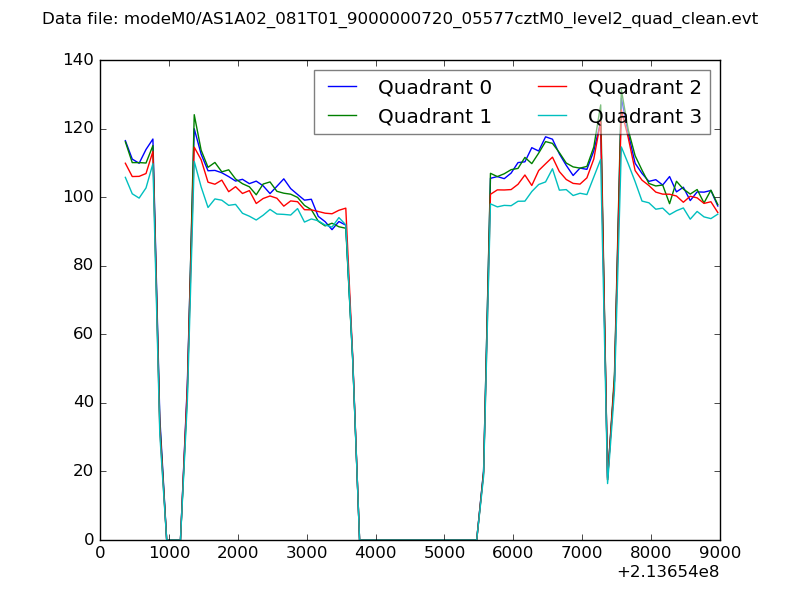 |
|
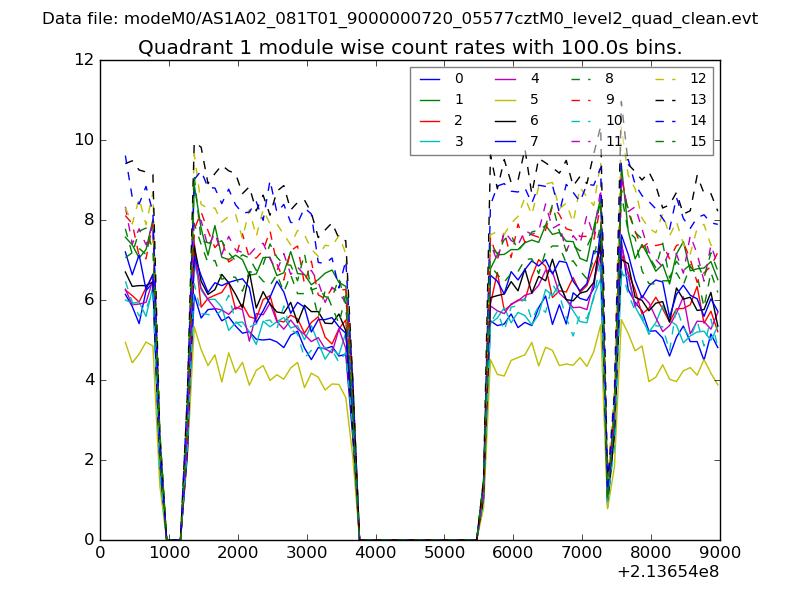
| Module-wise count rates for Quadrant A Data is divided into 100 sec bins |
 |
 |
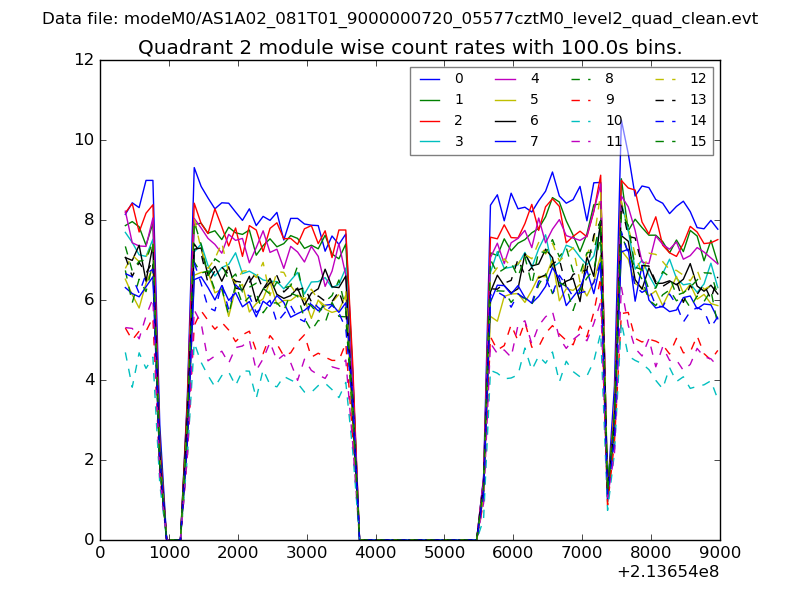
| Module-wise count rates for Quadrant B Data is divided into 100 sec bins |
 |
 |
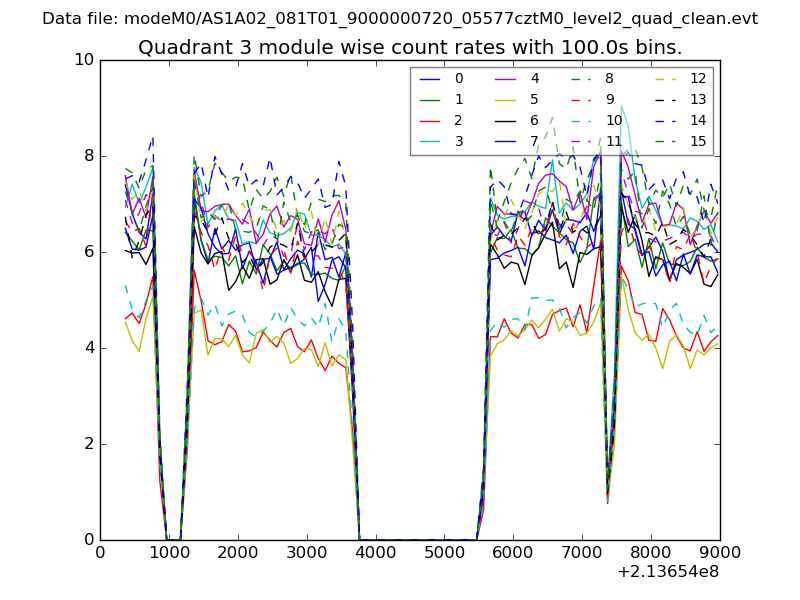
| Module-wise count rates for Quadrant C Data is divided into 100 sec bins |
 |
 |
| Module-wise count rates for Quadrant D Data is divided into 100 sec bins |
 |
 |
| Parameter | Plot |
|---|---|
| CZT HV Monitor | 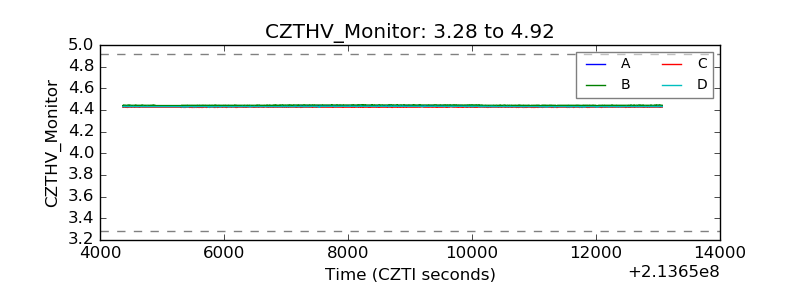 |
| D_VDD | 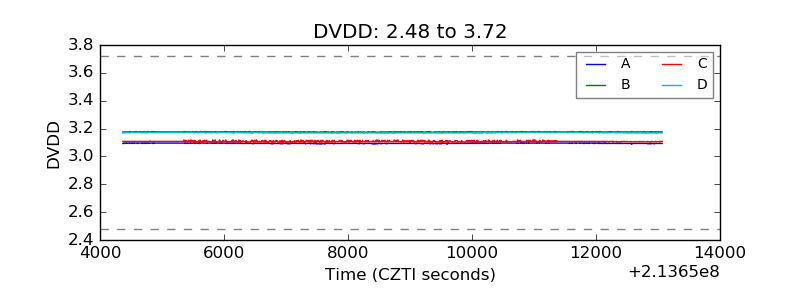 |
| Temperature 1 | 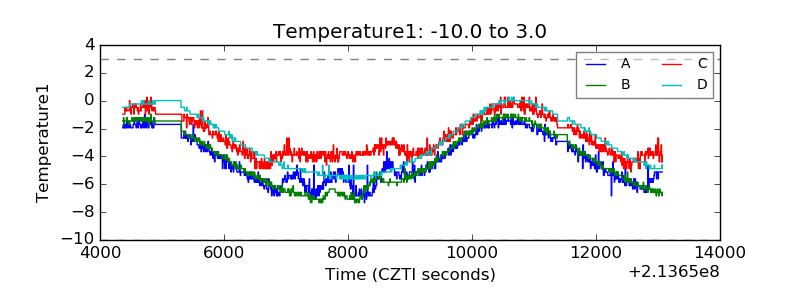 |
| Veto HV Monitor | 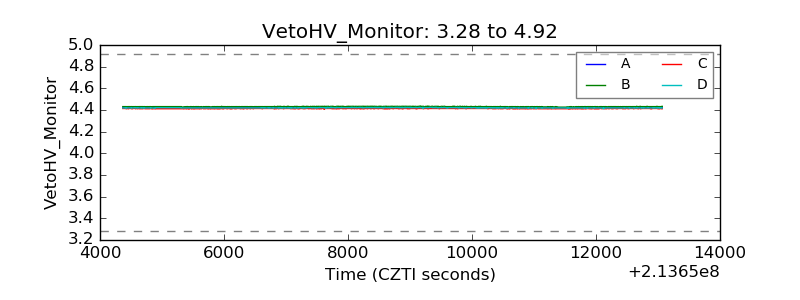 |
| Veto LLD | 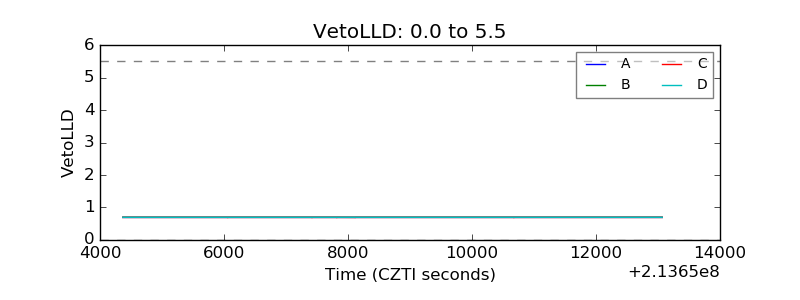 |
| Alpha Counter | 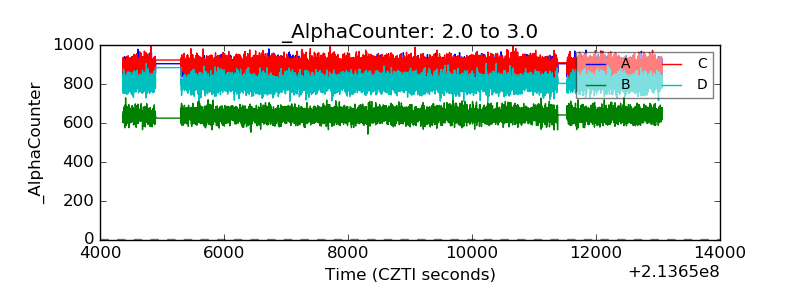 |
| _CPM_Rate | 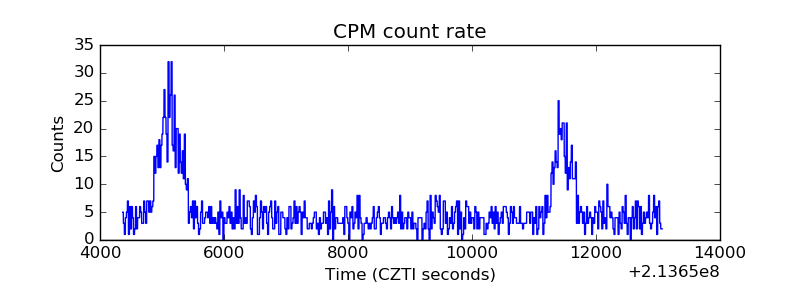 |
| CZT Counter | 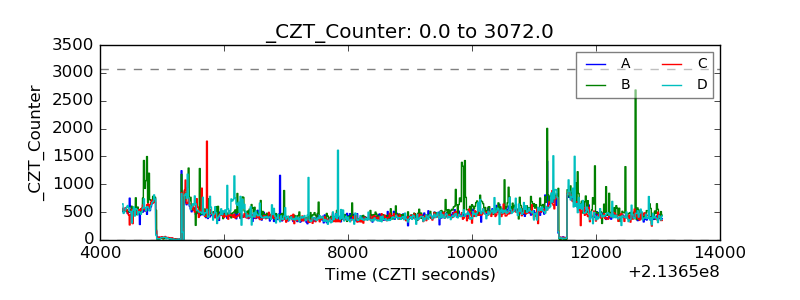 |
| +2.5 Volts monitor | 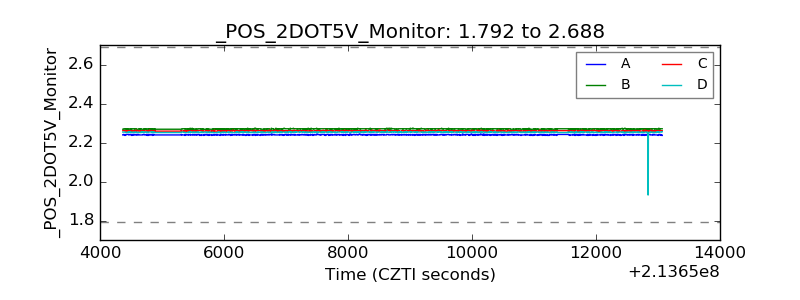 |
| +5 Volts monitor | 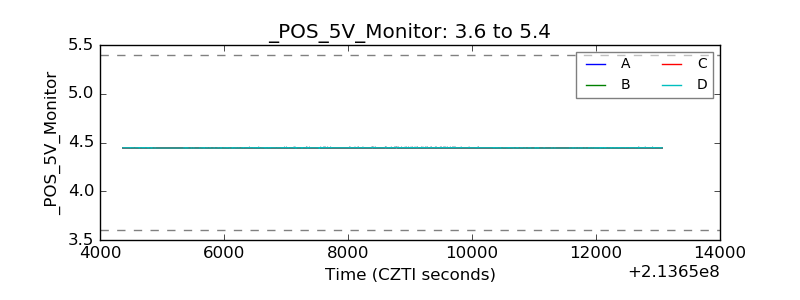 |
| _ROLL_ROT | 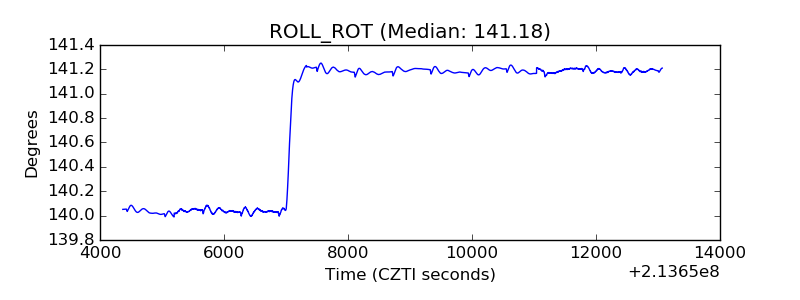 |
| _Roll_DEC | 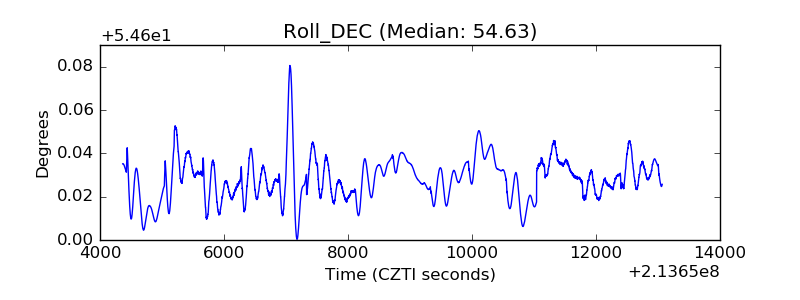 |
| _Roll_RA | 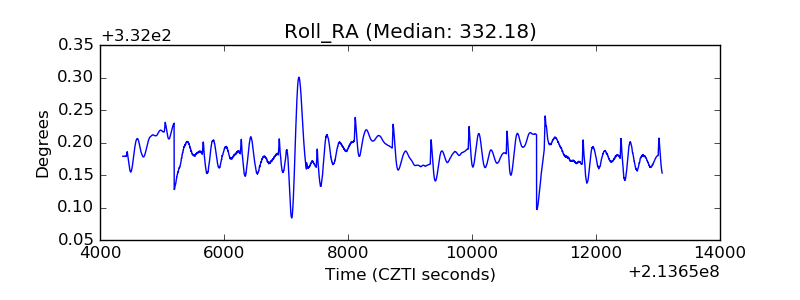 |
| Veto Counter | 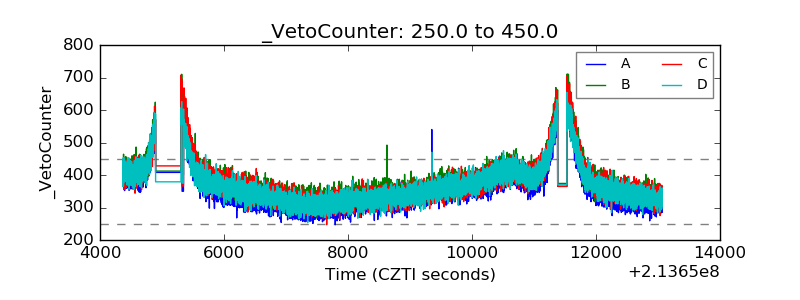 |