| Param | Original file | Final file |
|---|---|---|
| Filename | modeM0/AS1A02_081T01_9000000720_05578cztM0_level2.evt | modeM0/AS1A02_081T01_9000000720_05578cztM0_level2_quad_clean.evt |
| Size (bytes) | 557,141,760 | 105,696,000 |
| Size | 531.3 MB | 100.8 MB |
| Events in quadrant A | 3,844,020 | 670,432 |
| Events in quadrant B | 4,652,277 | 670,392 |
| Events in quadrant C | 3,796,777 | 653,906 |
| Events in quadrant D | 4,011,064 | 624,068 |
| Mode M9 | |||
|---|---|---|---|
| Quadrant | BADHDUFLAG | Total packets | Discarded packets |
| A | 0 | 6 | 0 |
| B | 0 | 6 | 0 |
| C | 0 | 6 | 0 |
| D | 0 | 6 | 0 |
| Mode SS | |||
|---|---|---|---|
| Quadrant | BADHDUFLAG | Total packets | Discarded packets |
| A | 0 | 168 | 0 |
| B | 0 | 168 | 0 |
| C | 0 | 168 | 0 |
| D | 0 | 168 | 0 |
| Mode M0 | |||
|---|---|---|---|
| Quadrant | BADHDUFLAG | Total packets | Discarded packets |
| A | 0 | 17502 | 3 |
| B | 0 | 19585 | 2 |
| C | 0 | 17408 | 2 |
| D | 0 | 17994 | 2 |
| Quadrant | Total seconds | Saturated seconds | Saturation percentage |
|---|---|---|---|
| A | 8391 | 77 | 0.917650% |
| B | 8391 | 189 | 2.252413% |
| C | 8391 | 55 | 0.655464% |
| D | 8391 | 54 | 0.643547% |
Noise dominated data is calculated using 1-second bins in cleaned event files. If a bin has >2000 counts, and if more than 50% of those come from <1% of pixels, then it is considered to be noise-dominated and hence unusable.
| Quadrant | # 1 sec bins | Bins with >0 counts | Bins with >2000 counts | High rate bins dominated by noise | Noise dominated (total time) | Noise dominated (detector-on time) | Marked lightcurve |
|---|---|---|---|---|---|---|---|
| A | 8876 | 8393 | 2 | 2 | 0.02% | 0.02% | 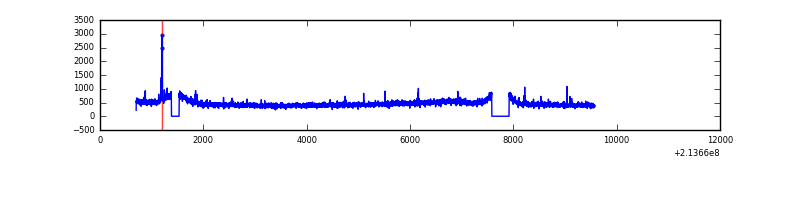 |
| B | 8876 | 8393 | 31 | 31 | 0.35% | 0.37% | 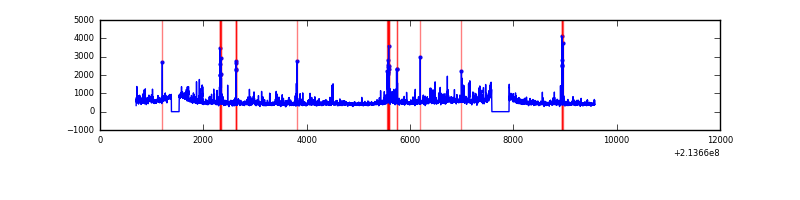 |
| C | 8876 | 8393 | 0 | 0 | 0.00% | 0.00% | 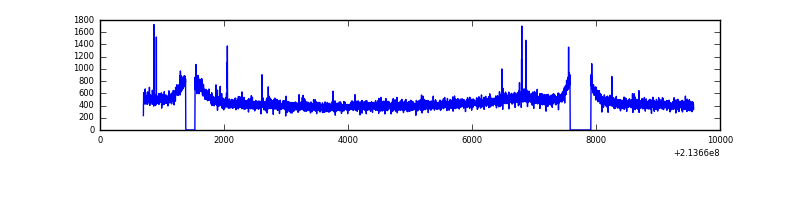 |
| D | 8876 | 8393 | 18 | 18 | 0.20% | 0.21% | 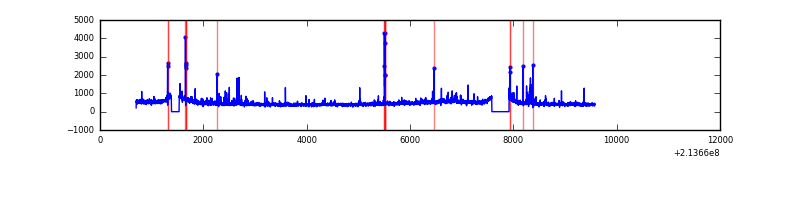 |
Top three noisy pixels from each quadrant. If the there are fewer than three noisy pixels in the level2.evt file, extra rows are filled as -1
| Pixel properties | Quadrant properties | ||||||
|---|---|---|---|---|---|---|---|
| Quadrant | DetID | PixID | Counts | Sigma | Mean | Median | Sigma |
| A | 15 | 174 | 29463 | 142.06 | 980 | 956 | 200.7 |
| A | 13 | 14 | 14564 | 67.81 | 980 | 956 | 200.7 |
| A | 0 | 50 | 12888 | 59.46 | 980 | 956 | 200.7 |
| B | 15 | 204 | 362527 | 1902.39 | 992 | 969 | 190.1 |
| B | 10 | 245 | 129064 | 673.99 | 992 | 969 | 190.1 |
| B | 0 | 214 | 65882 | 341.55 | 992 | 969 | 190.1 |
| C | 9 | 16 | 16349 | 68.59 | 961 | 962 | 224.3 |
| C | 1 | 16 | 13968 | 57.98 | 961 | 962 | 224.3 |
| C | 13 | 61 | 7973 | 31.25 | 961 | 962 | 224.3 |
| D | 8 | 195 | 135316 | 572.03 | 954 | 921 | 234.9 |
| D | 2 | 152 | 84737 | 356.75 | 954 | 921 | 234.9 |
| D | 2 | 14 | 46183 | 192.65 | 954 | 921 | 234.9 |
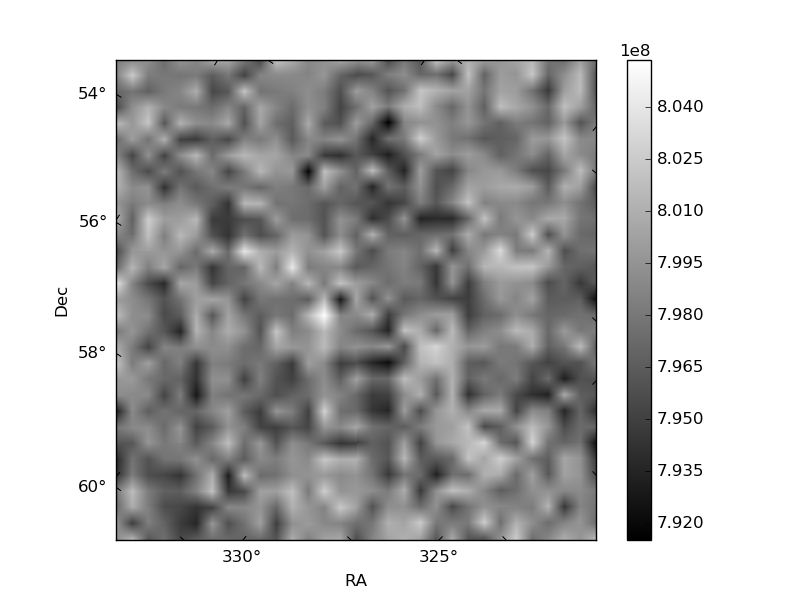
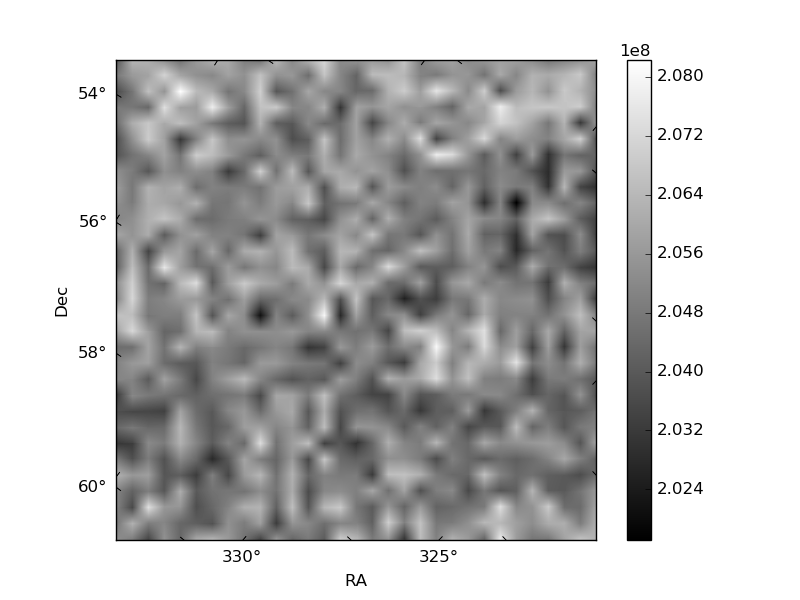
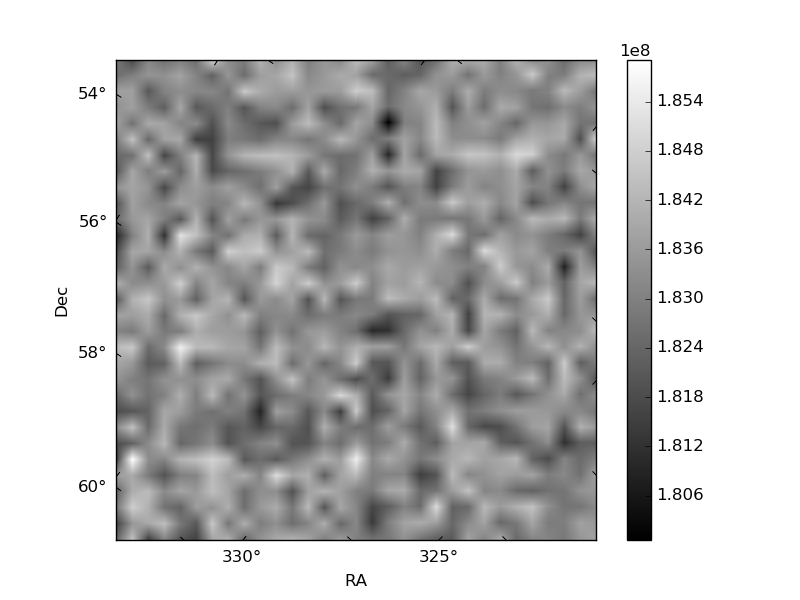
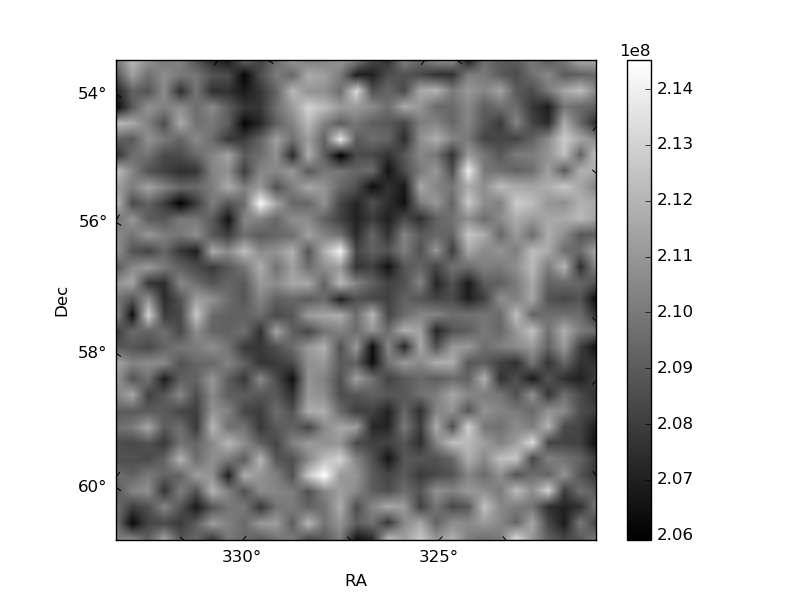
Histogram calculated using DETX and DETY for each event in the final _common_clean file
| Quadrant A | 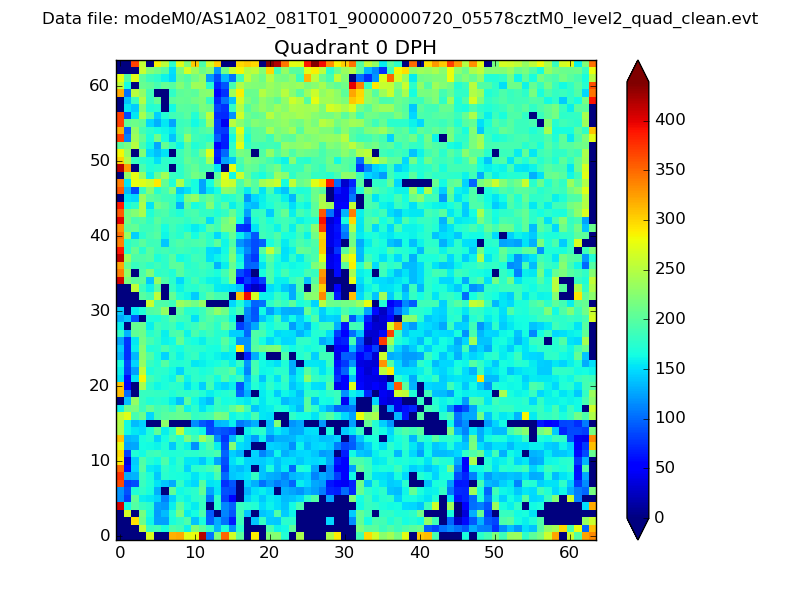 |
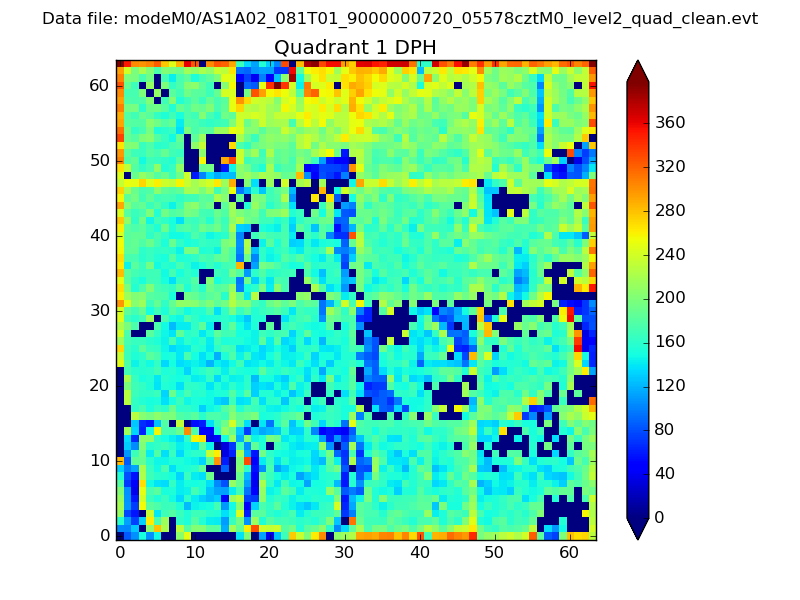 |
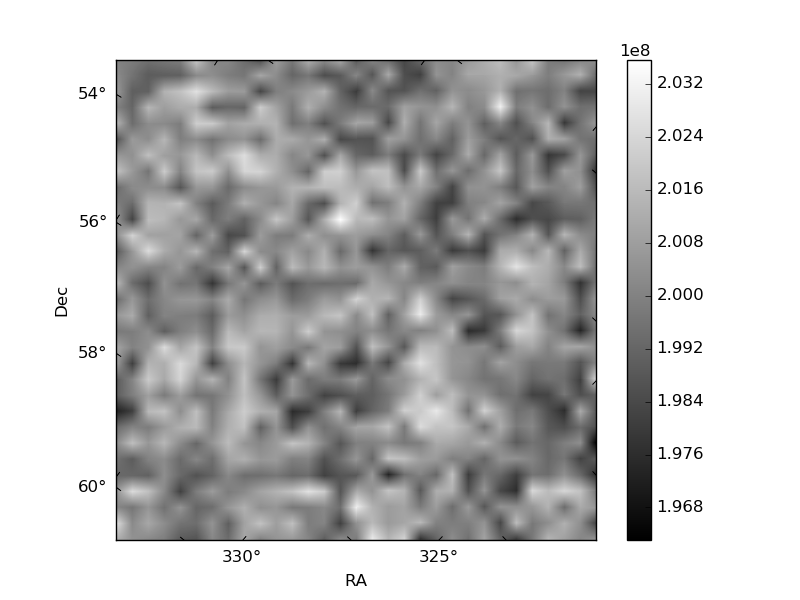
Quadrant B |
|---|---|---|---|
| Quadrant D | 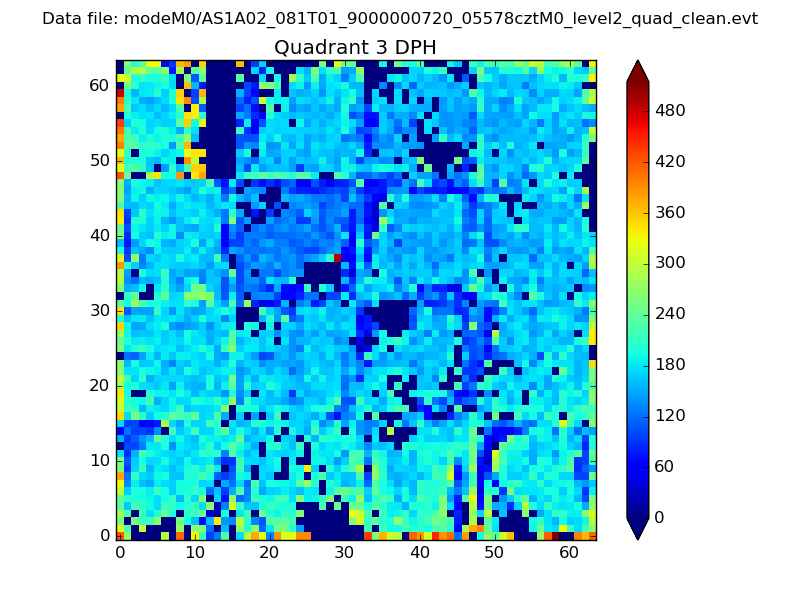 |
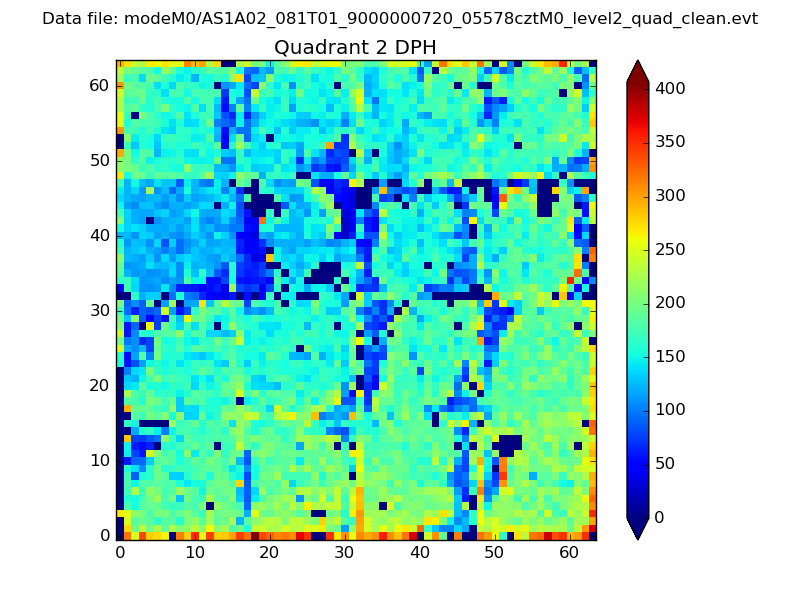 |
Quadrant C |
| Plot type | Count rate plots | Images |
|---|---|---|
| Comparison with Poisson distribution Blue bars denote a histogram of data divided into 1 sec bins. Red curve is a Poisson curve with rate = median count rate of data. |
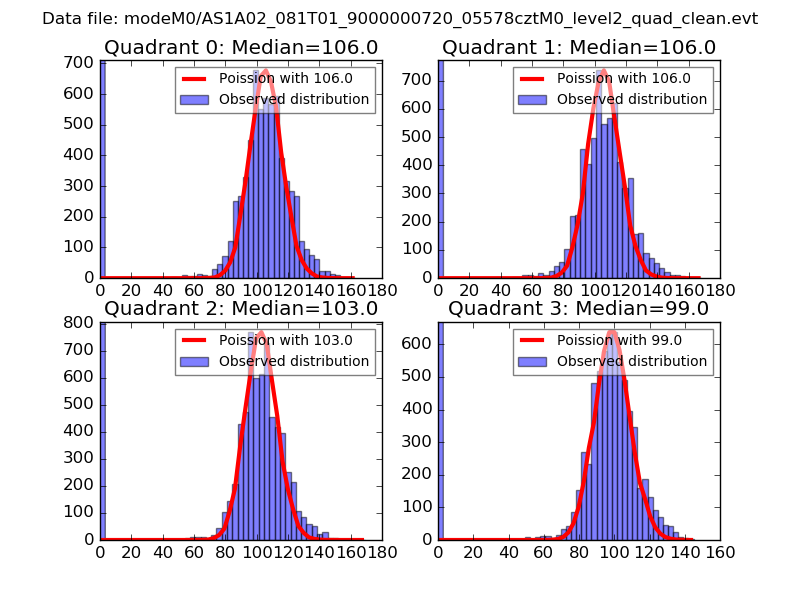 |
 |
| Quadrant-wise count rates Data is divided into 100 sec bins |
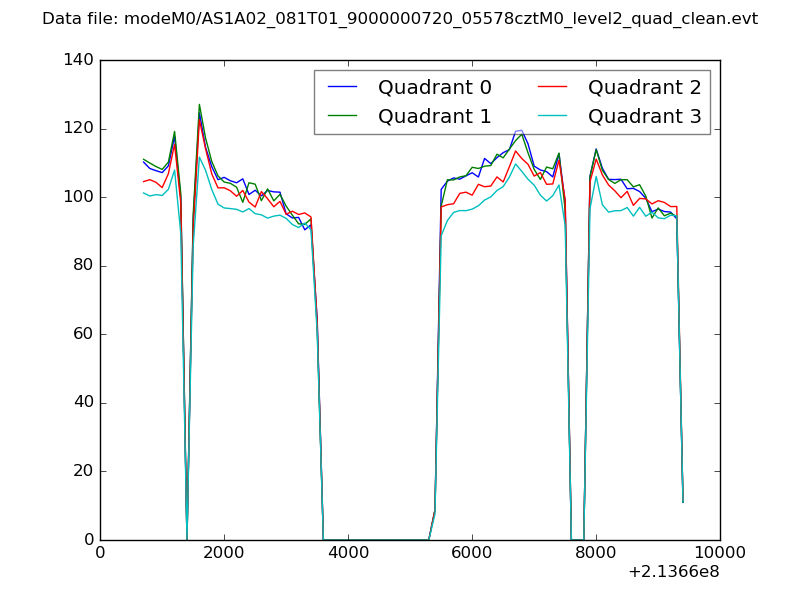 |
|
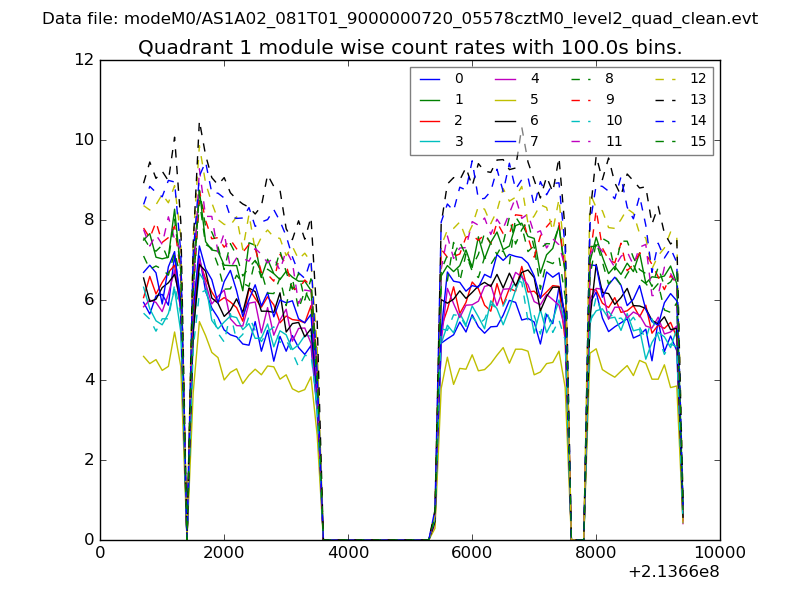
| Module-wise count rates for Quadrant A Data is divided into 100 sec bins |
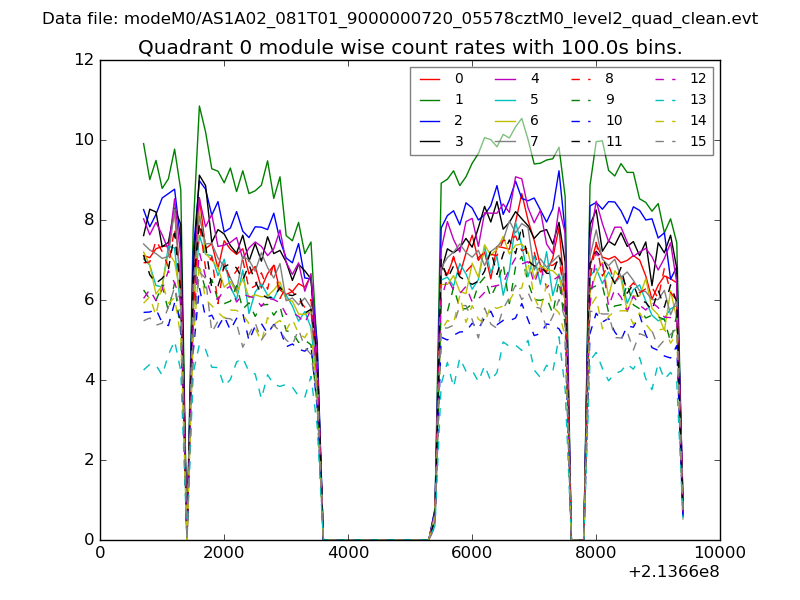 |
 |
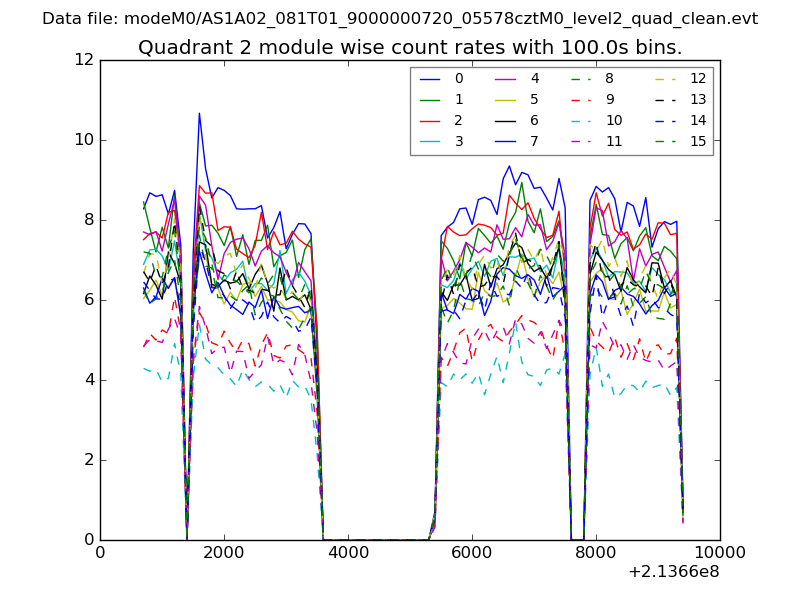
| Module-wise count rates for Quadrant B Data is divided into 100 sec bins |
 |
 |
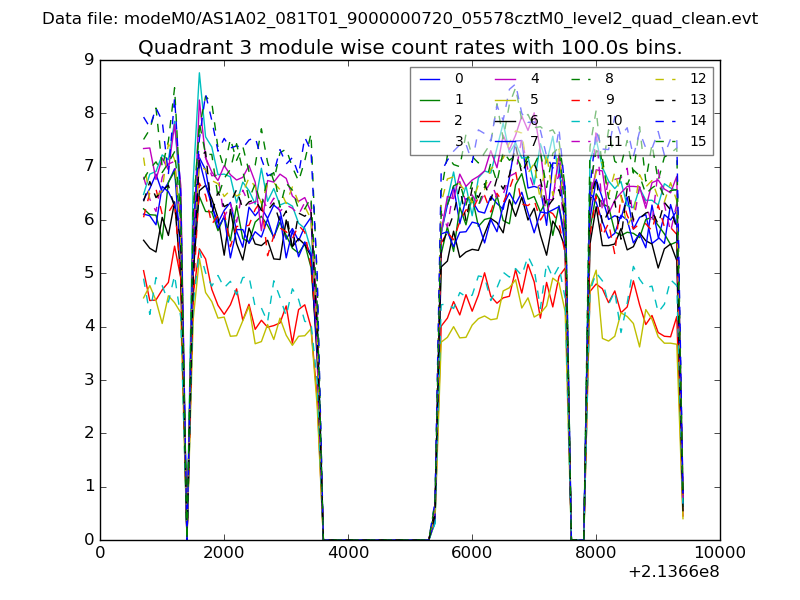
| Module-wise count rates for Quadrant C Data is divided into 100 sec bins |
 |
 |
| Module-wise count rates for Quadrant D Data is divided into 100 sec bins |
 |
 |
| Parameter | Plot |
|---|---|
| CZT HV Monitor | 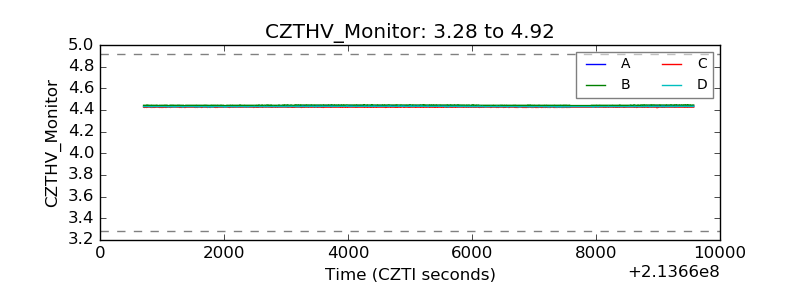 |
| D_VDD | 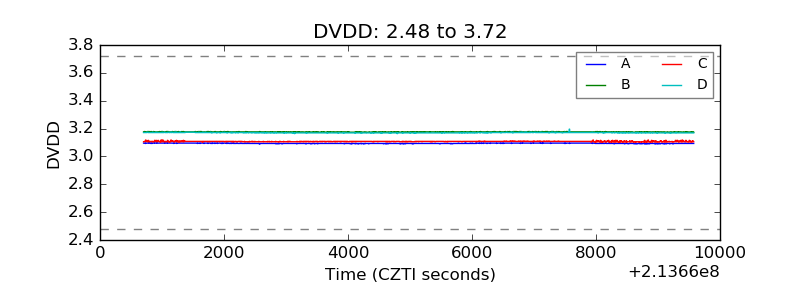 |
| Temperature 1 | 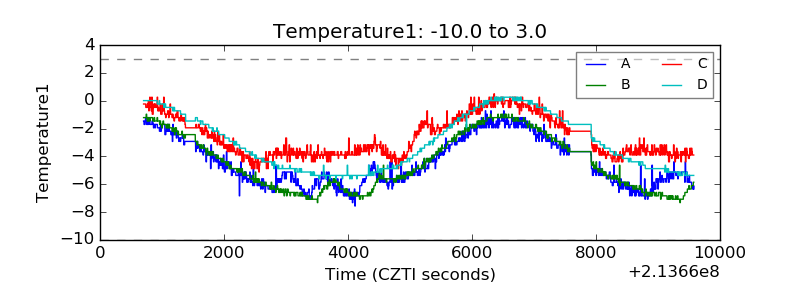 |
| Veto HV Monitor |  |
| Veto LLD | 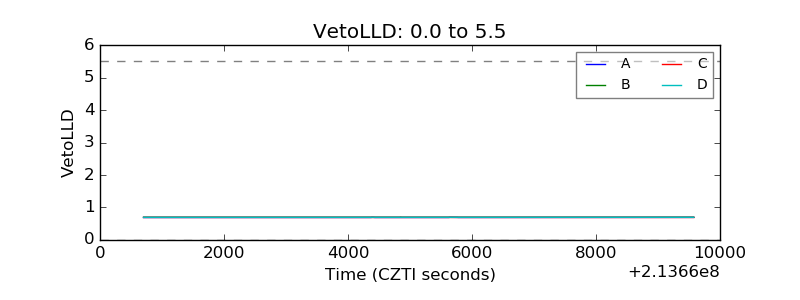 |
| Alpha Counter |  |
| _CPM_Rate | 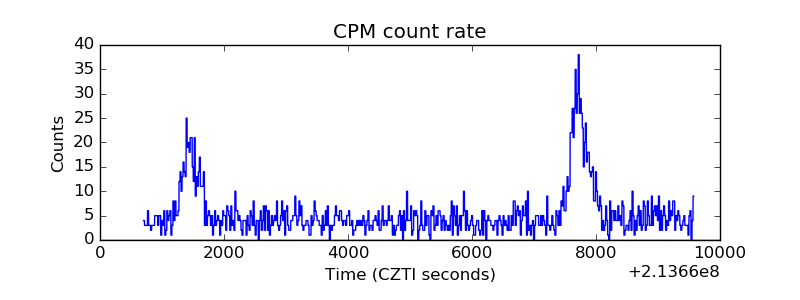 |
| CZT Counter | 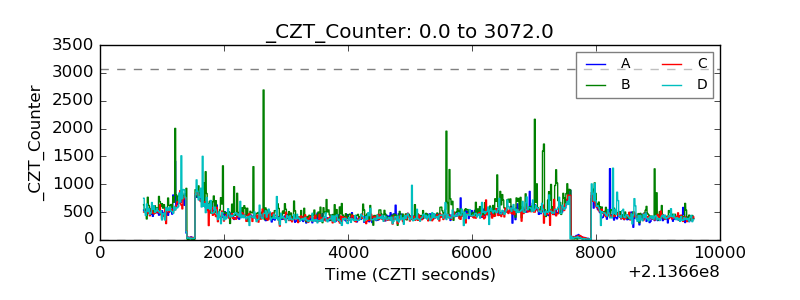 |
| +2.5 Volts monitor | 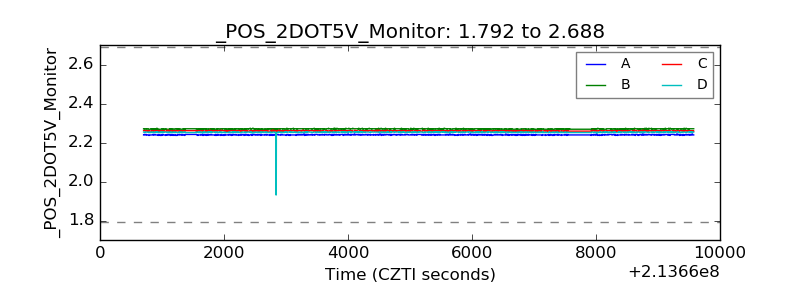 |
| +5 Volts monitor |  |
| _ROLL_ROT | 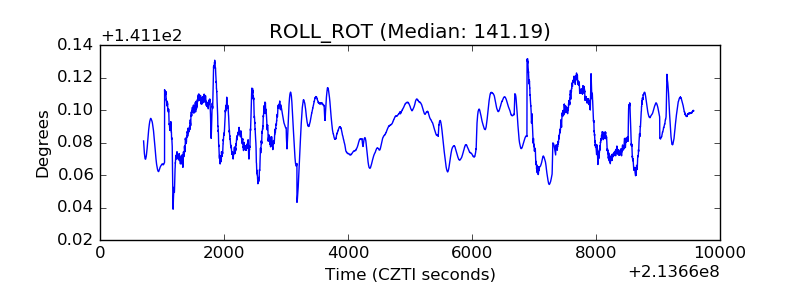 |
| _Roll_DEC | 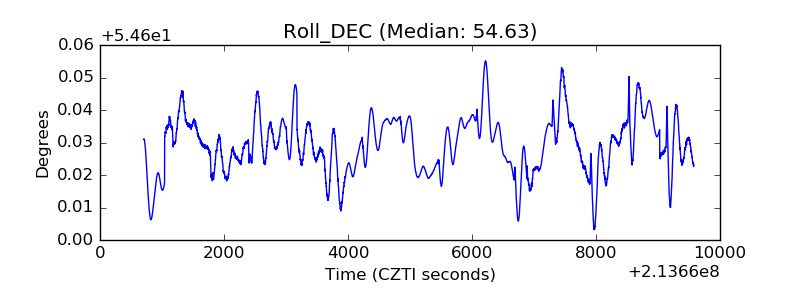 |
| _Roll_RA | 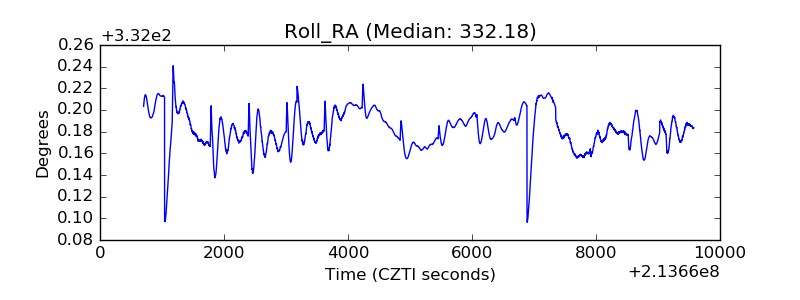 |
| Veto Counter | 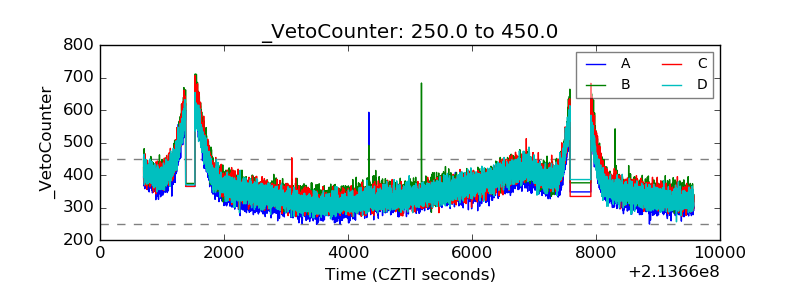 |