| Param | Original file | Final file |
|---|---|---|
| Filename | modeM0/AS1A02_081T01_9000000720_05580cztM0_level2.evt | modeM0/AS1A02_081T01_9000000720_05580cztM0_level2_quad_clean.evt |
| Size (bytes) | 594,345,600 | 95,872,320 |
| Size | 566.8 MB | 91.4 MB |
| Events in quadrant A | 4,079,616 | 577,892 |
| Events in quadrant B | 4,930,310 | 578,684 |
| Events in quadrant C | 4,061,274 | 564,824 |
| Events in quadrant D | 4,297,635 | 536,910 |
| Mode M9 | |||
|---|---|---|---|
| Quadrant | BADHDUFLAG | Total packets | Discarded packets |
| A | 0 | 9 | 0 |
| B | 0 | 9 | 0 |
| C | 0 | 9 | 0 |
| D | 0 | 9 | 0 |
| Mode SS | |||
|---|---|---|---|
| Quadrant | BADHDUFLAG | Total packets | Discarded packets |
| A | 0 | 190 | 0 |
| B | 0 | 190 | 0 |
| C | 0 | 189 | 3 |
| D | 0 | 190 | 0 |
| Mode M0 | |||
|---|---|---|---|
| Quadrant | BADHDUFLAG | Total packets | Discarded packets |
| A | 0 | 18992 | 29 |
| B | 0 | 21139 | 40 |
| C | 0 | 19022 | 35 |
| D | 0 | 19760 | 32 |
| Quadrant | Total seconds | Saturated seconds | Saturation percentage |
|---|---|---|---|
| A | 9300 | 43 | 0.462366% |
| B | 9297 | 132 | 1.419813% |
| C | 9296 | 32 | 0.344234% |
| D | 9298 | 51 | 0.548505% |
Noise dominated data is calculated using 1-second bins in cleaned event files. If a bin has >2000 counts, and if more than 50% of those come from <1% of pixels, then it is considered to be noise-dominated and hence unusable.
| Quadrant | # 1 sec bins | Bins with >0 counts | Bins with >2000 counts | High rate bins dominated by noise | Noise dominated (total time) | Noise dominated (detector-on time) | Marked lightcurve |
|---|---|---|---|---|---|---|---|
| A | 10177 | 9314 | 0 | 0 | 0.00% | 0.00% | 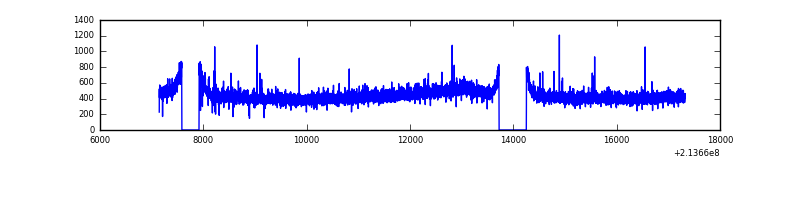 |
| B | 10177 | 9314 | 17 | 17 | 0.17% | 0.18% | 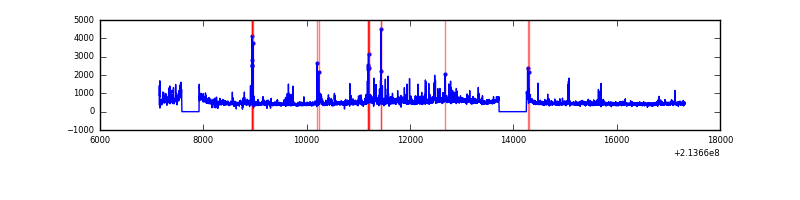 |
| C | 10177 | 9314 | 0 | 0 | 0.00% | 0.00% | 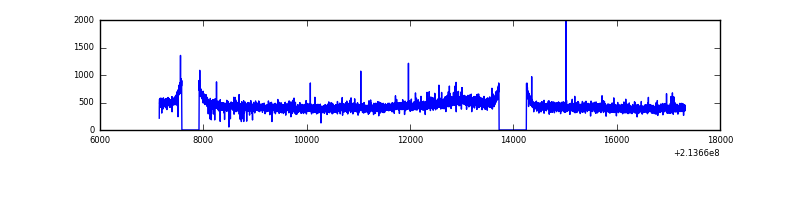 |
| D | 10177 | 9313 | 16 | 16 | 0.16% | 0.17% | 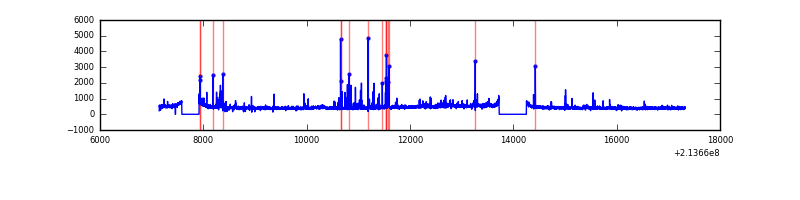 |
Top three noisy pixels from each quadrant. If the there are fewer than three noisy pixels in the level2.evt file, extra rows are filled as -1
| Pixel properties | Quadrant properties | ||||||
|---|---|---|---|---|---|---|---|
| Quadrant | DetID | PixID | Counts | Sigma | Mean | Median | Sigma |
| A | 0 | 226 | 10315 | 43.29 | 1053 | 1025 | 214.6 |
| A | 12 | 194 | 10255 | 43.01 | 1053 | 1025 | 214.6 |
| A | 13 | 251 | 8370 | 34.23 | 1053 | 1025 | 214.6 |
| B | 15 | 204 | 433623 | 2116.27 | 1066 | 1038 | 204.4 |
| B | 11 | 51 | 127037 | 616.4 | 1066 | 1038 | 204.4 |
| B | 10 | 245 | 94820 | 458.79 | 1066 | 1038 | 204.4 |
| C | 1 | 16 | 18714 | 74.04 | 1026 | 1031 | 238.8 |
| C | 8 | 128 | 14932 | 58.2 | 1026 | 1031 | 238.8 |
| C | 12 | 4 | 12221 | 46.85 | 1026 | 1031 | 238.8 |
| D | 2 | 152 | 125630 | 492.69 | 1018 | 985 | 253.0 |
| D | 8 | 195 | 102066 | 399.55 | 1018 | 985 | 253.0 |
| D | 11 | 241 | 87047 | 340.18 | 1018 | 985 | 253.0 |
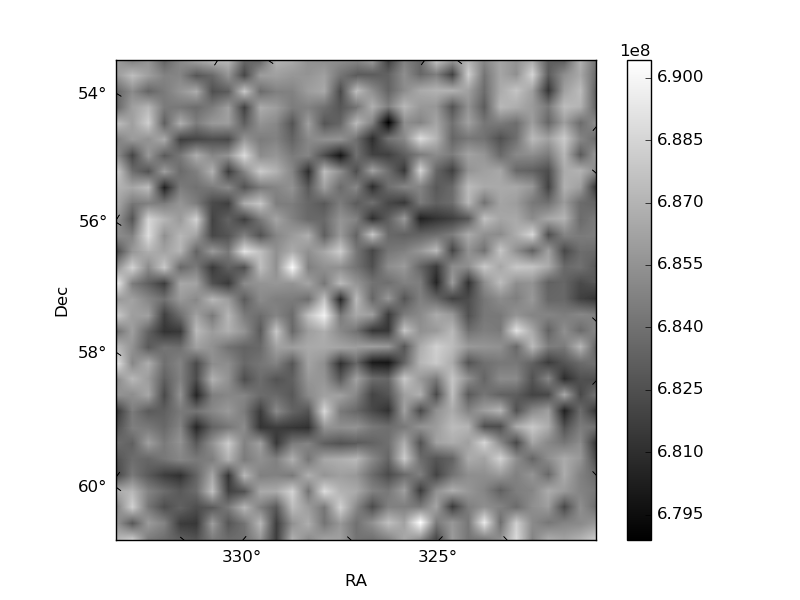
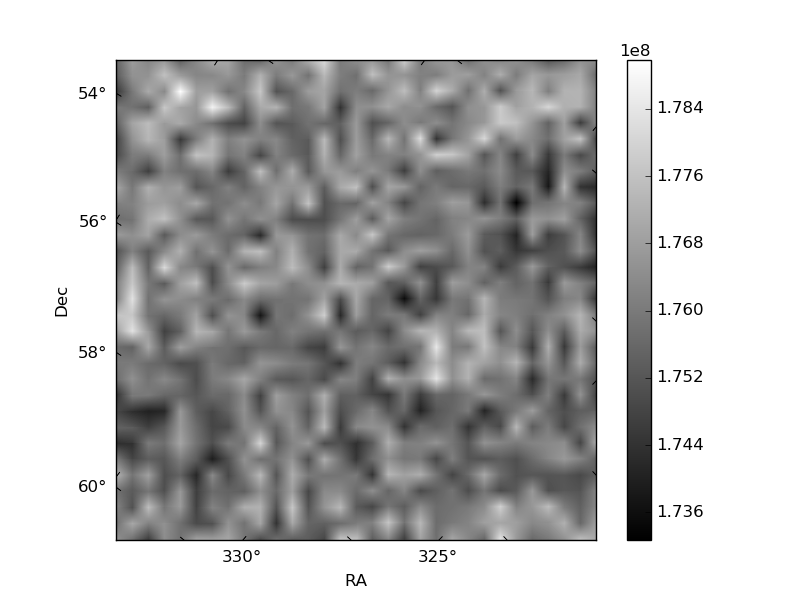
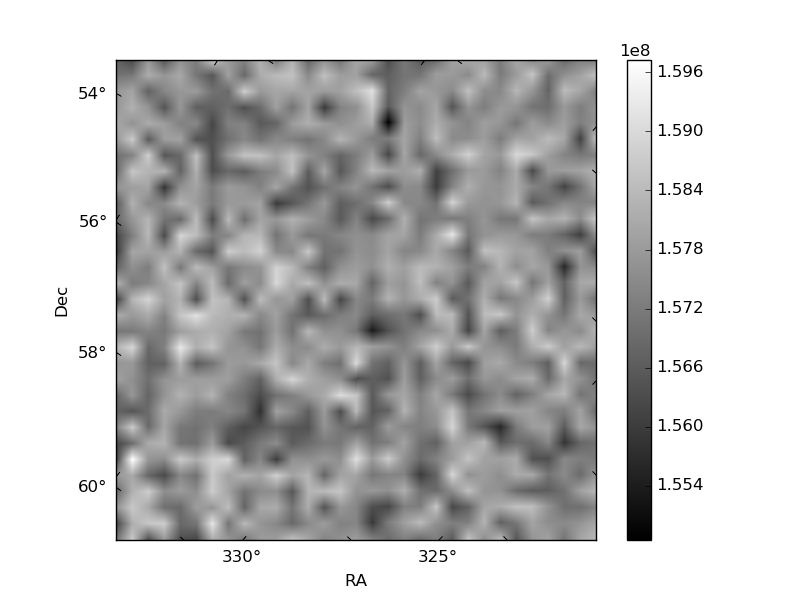
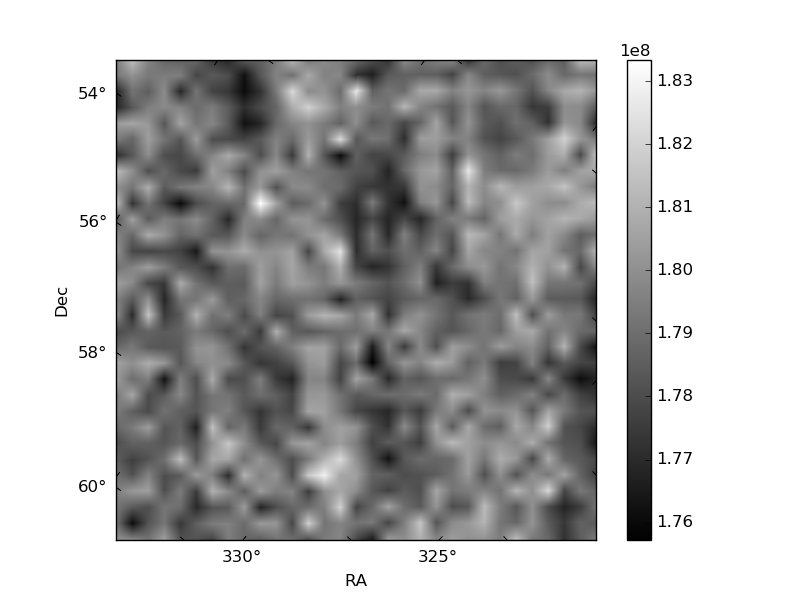
Histogram calculated using DETX and DETY for each event in the final _common_clean file
| Quadrant A | 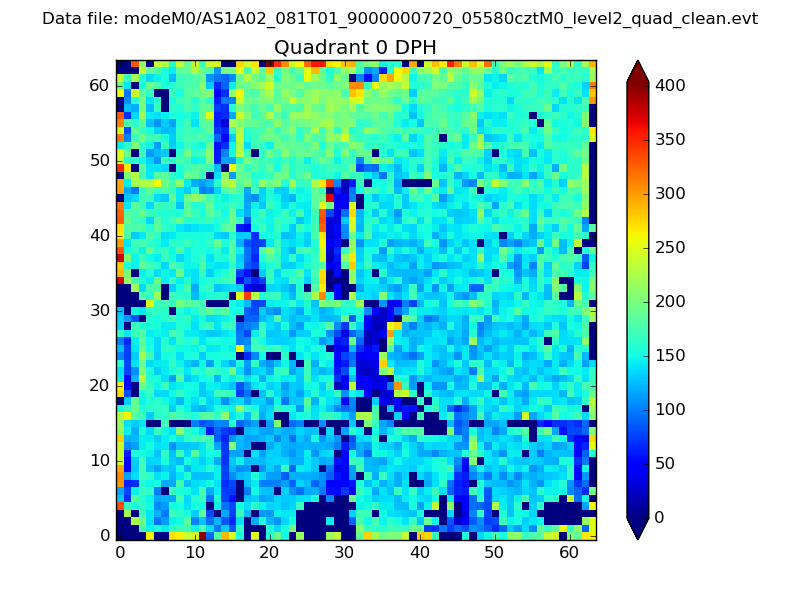 |
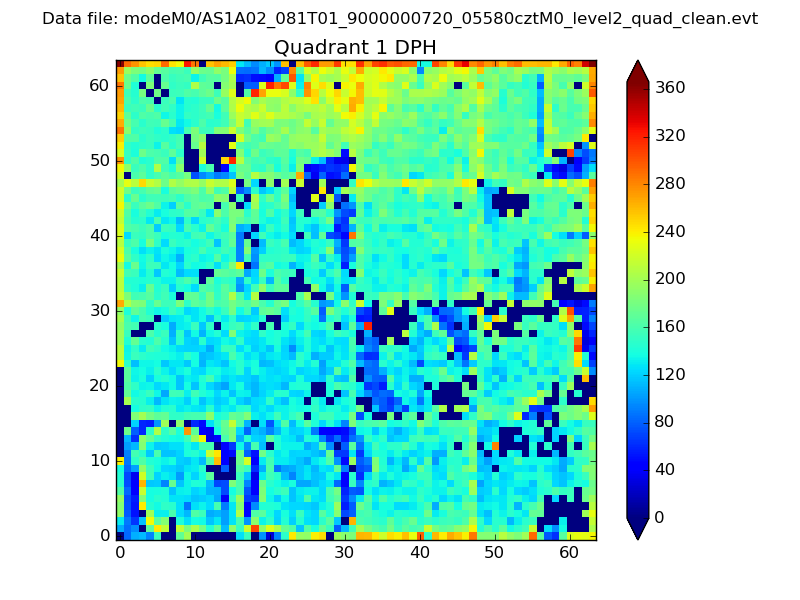 |
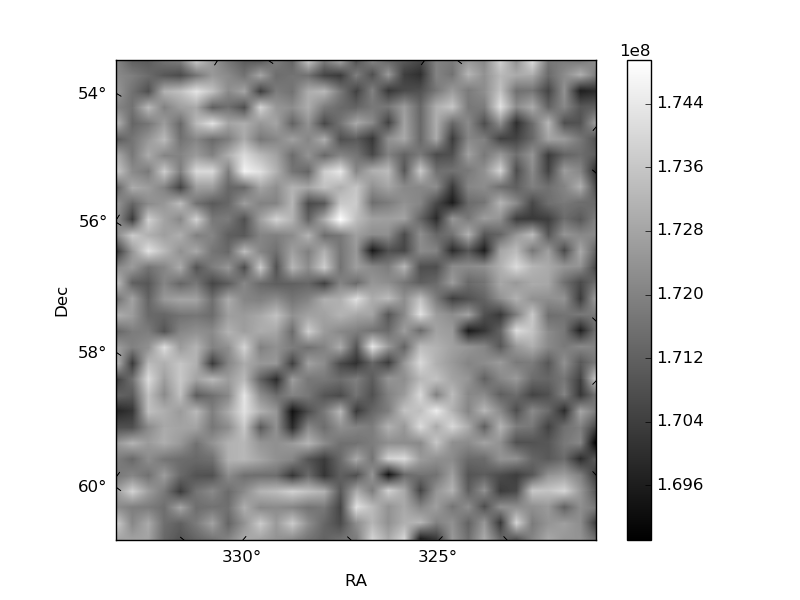
Quadrant B |
|---|---|---|---|
| Quadrant D | 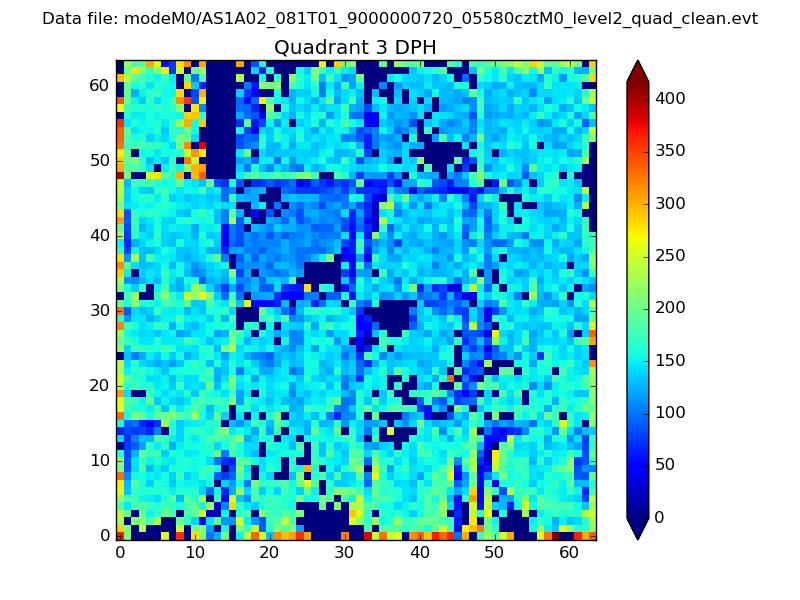 |
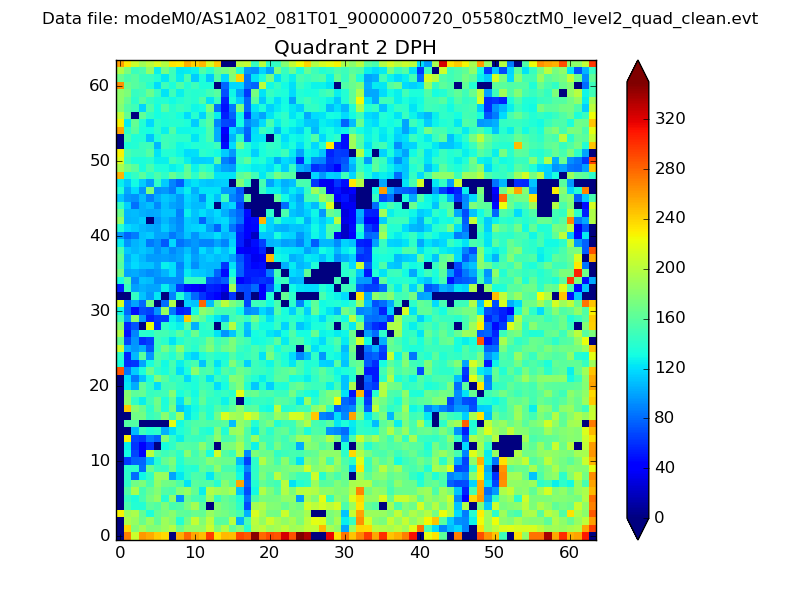 |
Quadrant C |
| Plot type | Count rate plots | Images |
|---|---|---|
| Comparison with Poisson distribution Blue bars denote a histogram of data divided into 1 sec bins. Red curve is a Poisson curve with rate = median count rate of data. |
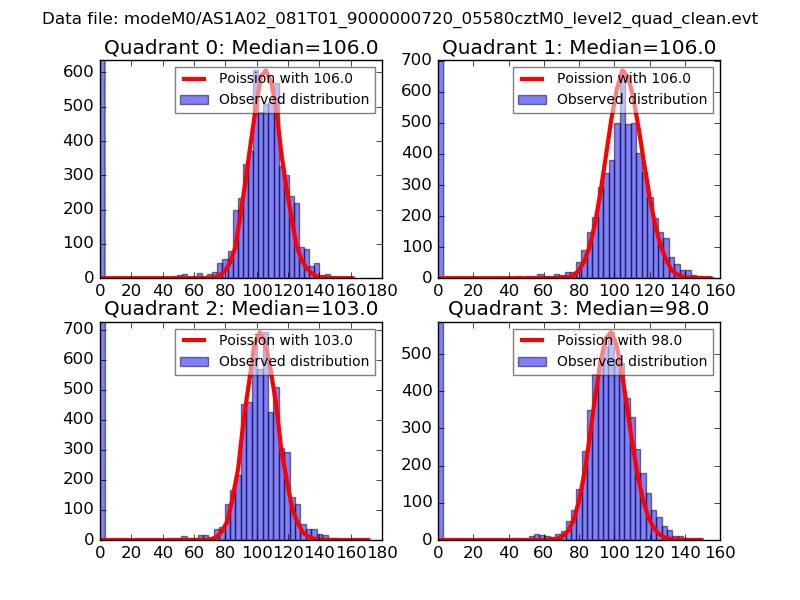 |
 |
| Quadrant-wise count rates Data is divided into 100 sec bins |
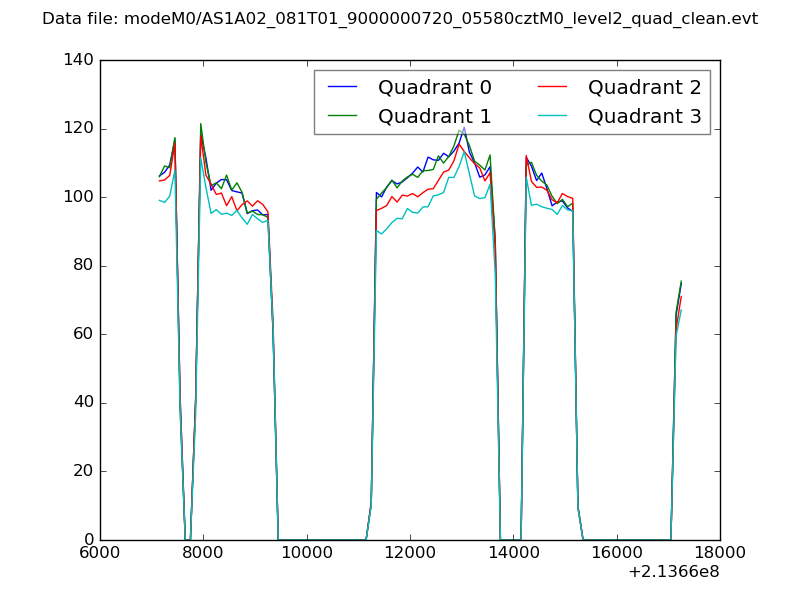 |
|
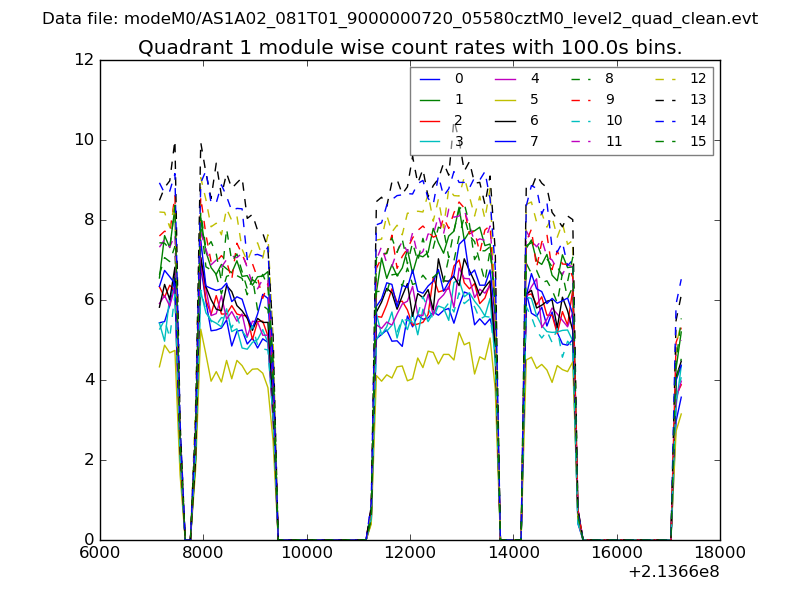
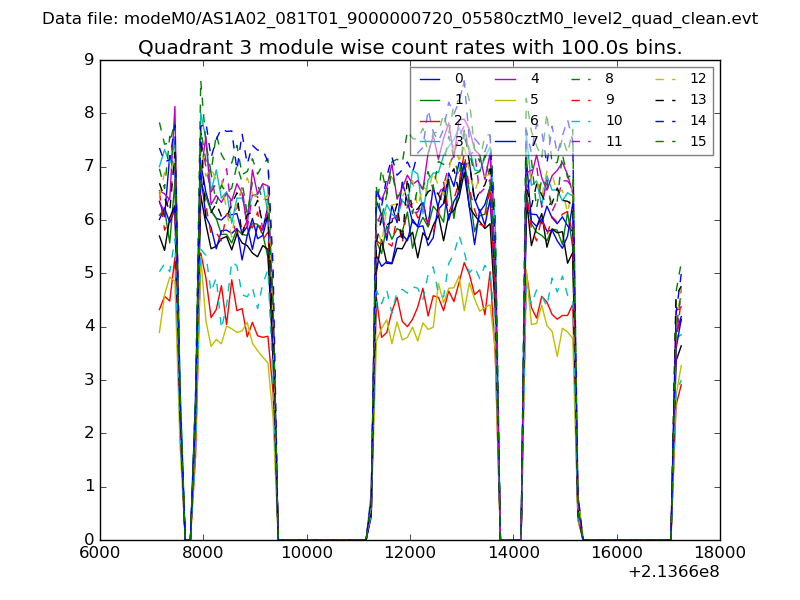
| Module-wise count rates for Quadrant A Data is divided into 100 sec bins |
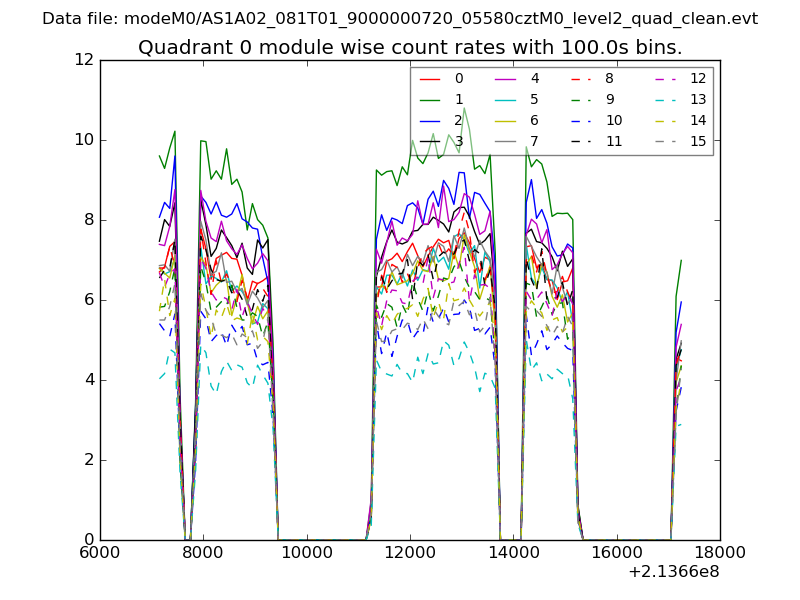 |
 |
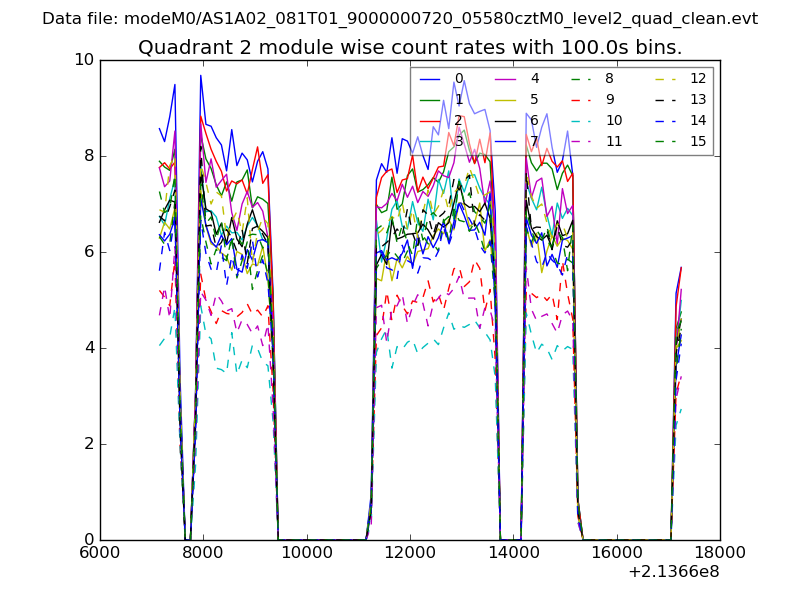
| Module-wise count rates for Quadrant B Data is divided into 100 sec bins |
 |
 |
| Module-wise count rates for Quadrant C Data is divided into 100 sec bins |
 |
 |
| Module-wise count rates for Quadrant D Data is divided into 100 sec bins |
 |
 |
| Parameter | Plot |
|---|---|
| CZT HV Monitor | 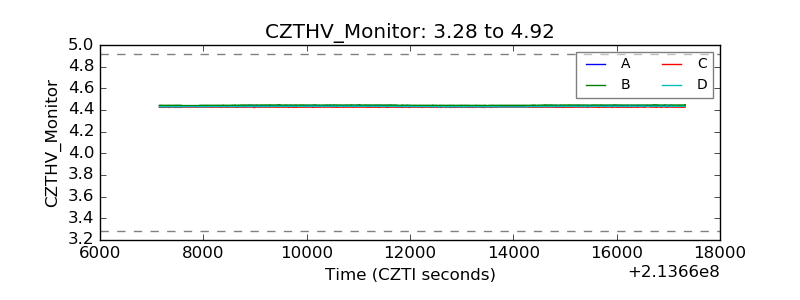 |
| D_VDD | 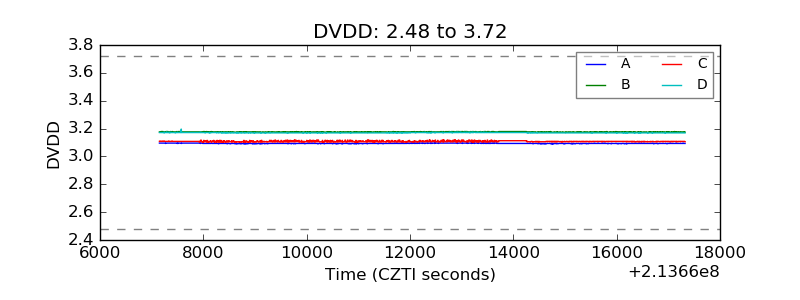 |
| Temperature 1 | 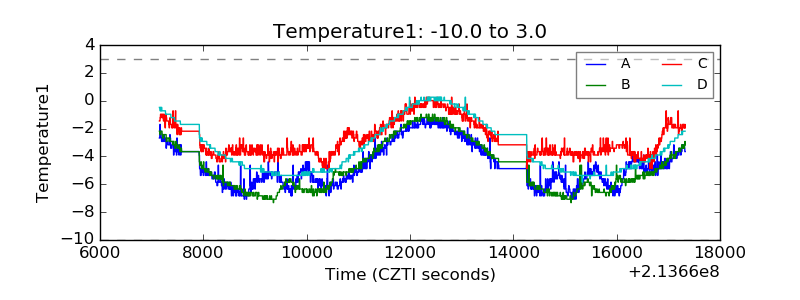 |
| Veto HV Monitor | 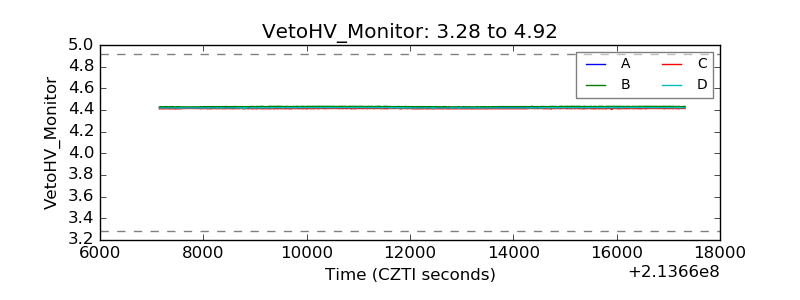 |
| Veto LLD | 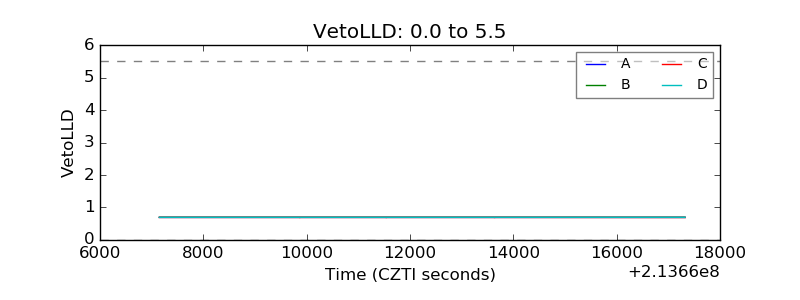 |
| Alpha Counter | 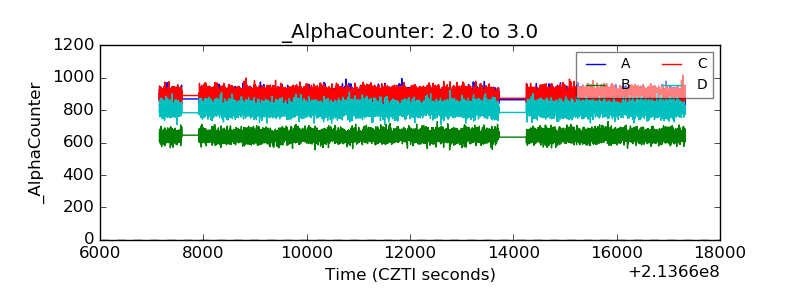 |
| _CPM_Rate | 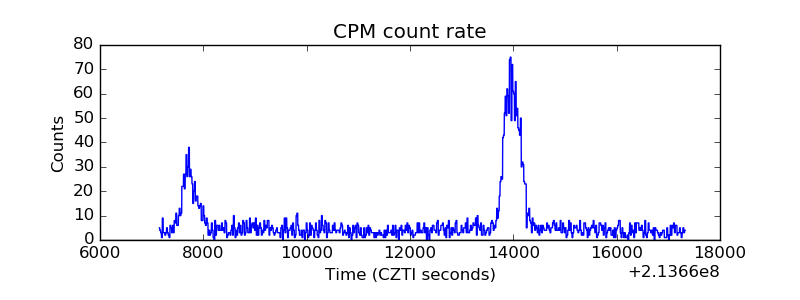 |
| CZT Counter | 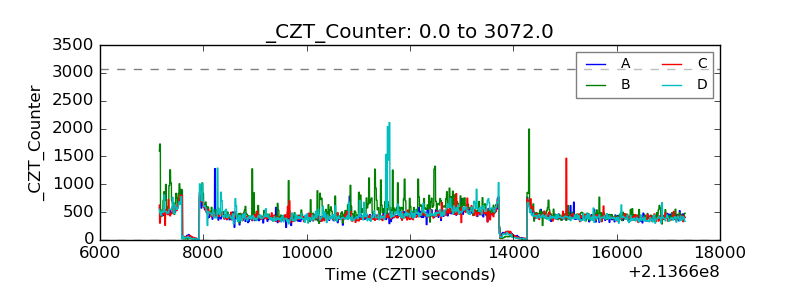 |
| +2.5 Volts monitor |  |
| +5 Volts monitor | 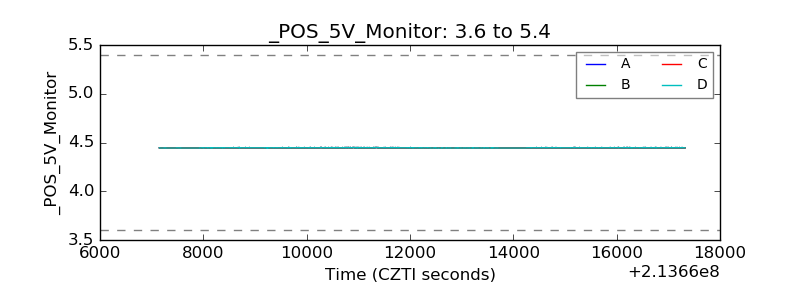 |
| _ROLL_ROT | 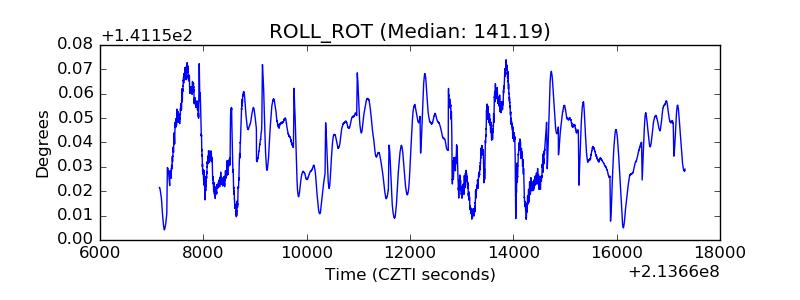 |
| _Roll_DEC | 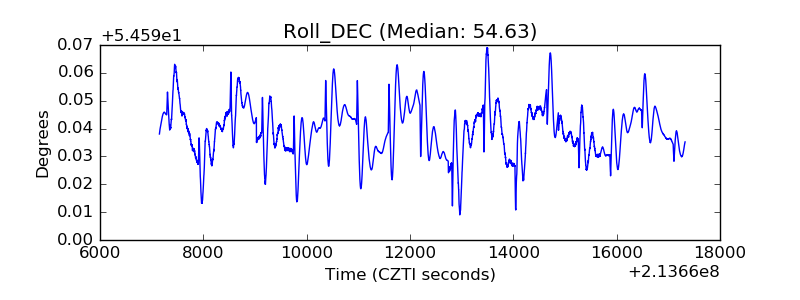 |
| _Roll_RA | 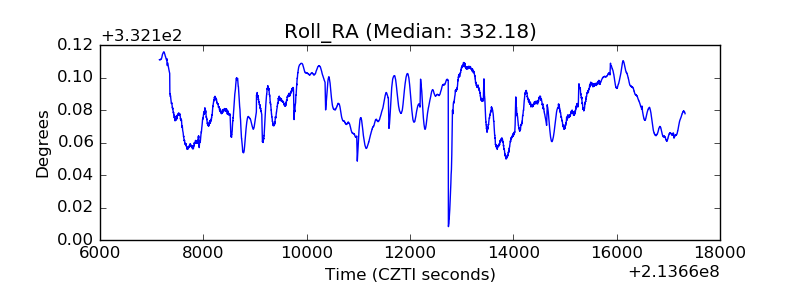 |
| Veto Counter | 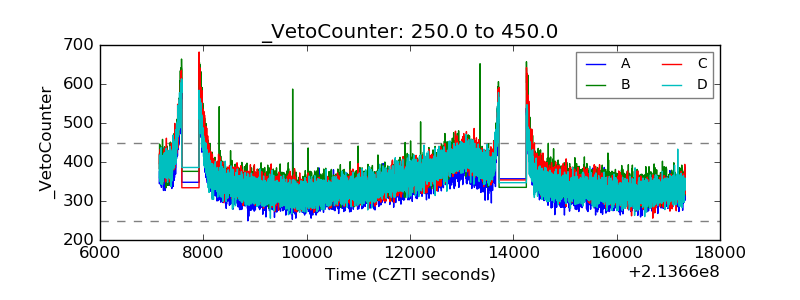 |