| Param | Original file | Final file |
|---|---|---|
| Filename | modeM0/AS1A02_081T01_9000000720_05581cztM0_level2.evt | modeM0/AS1A02_081T01_9000000720_05581cztM0_level2_quad_clean.evt |
| Size (bytes) | 641,920,320 | 107,858,880 |
| Size | 612.2 MB | 102.9 MB |
| Events in quadrant A | 4,385,373 | 669,937 |
| Events in quadrant B | 5,237,103 | 666,266 |
| Events in quadrant C | 4,388,222 | 645,087 |
| Events in quadrant D | 4,775,061 | 615,841 |
| Mode M9 | |||
|---|---|---|---|
| Quadrant | BADHDUFLAG | Total packets | Discarded packets |
| A | 0 | 15 | 0 |
| B | 0 | 15 | 0 |
| C | 0 | 15 | 0 |
| D | 0 | 15 | 0 |
| Mode SS | |||
|---|---|---|---|
| Quadrant | BADHDUFLAG | Total packets | Discarded packets |
| A | 0 | 198 | 0 |
| B | 0 | 198 | 0 |
| C | 0 | 198 | 2 |
| D | 0 | 198 | 2 |
| Mode M0 | |||
|---|---|---|---|
| Quadrant | BADHDUFLAG | Total packets | Discarded packets |
| A | 0 | 19617 | 39 |
| B | 0 | 21901 | 42 |
| C | 0 | 19881 | 53 |
| D | 0 | 21031 | 35 |
| Quadrant | Total seconds | Saturated seconds | Saturation percentage |
|---|---|---|---|
| A | 9652 | 81 | 0.839204% |
| B | 9656 | 142 | 1.470588% |
| C | 9645 | 65 | 0.673924% |
| D | 9657 | 82 | 0.849125% |
Noise dominated data is calculated using 1-second bins in cleaned event files. If a bin has >2000 counts, and if more than 50% of those come from <1% of pixels, then it is considered to be noise-dominated and hence unusable.
| Quadrant | # 1 sec bins | Bins with >0 counts | Bins with >2000 counts | High rate bins dominated by noise | Noise dominated (total time) | Noise dominated (detector-on time) | Marked lightcurve |
|---|---|---|---|---|---|---|---|
| A | 11190 | 9671 | 0 | 0 | 0.00% | 0.00% | 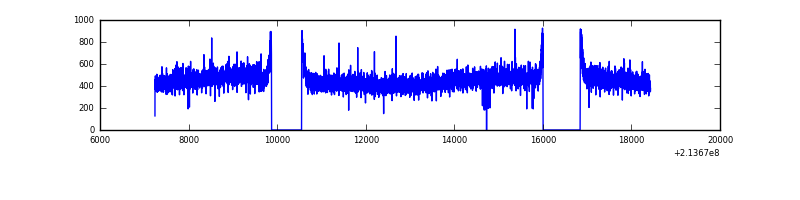 |
| B | 11190 | 9672 | 21 | 21 | 0.19% | 0.22% | 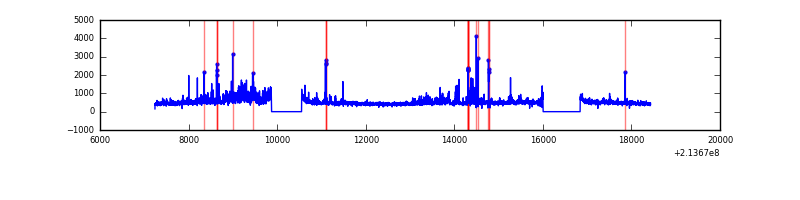 |
| C | 11190 | 9669 | 3 | 3 | 0.03% | 0.03% | 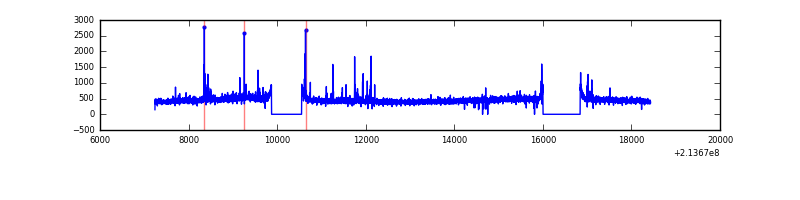 |
| D | 11190 | 9672 | 22 | 22 | 0.20% | 0.23% | 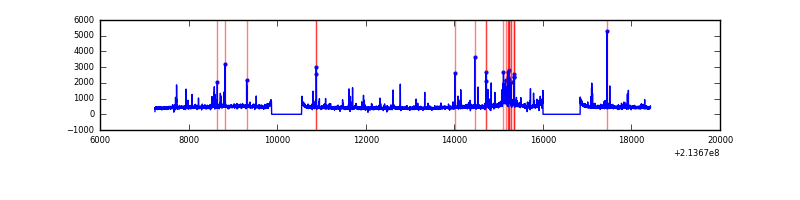 |
Top three noisy pixels from each quadrant. If the there are fewer than three noisy pixels in the level2.evt file, extra rows are filled as -1
| Pixel properties | Quadrant properties | ||||||
|---|---|---|---|---|---|---|---|
| Quadrant | DetID | PixID | Counts | Sigma | Mean | Median | Sigma |
| A | 13 | 14 | 21771 | 88.13 | 1130 | 1104 | 234.5 |
| A | 0 | 226 | 10898 | 41.76 | 1130 | 1104 | 234.5 |
| A | 12 | 194 | 10791 | 41.31 | 1130 | 1104 | 234.5 |
| B | 15 | 204 | 506123 | 2294.82 | 1139 | 1111 | 220.1 |
| B | 11 | 51 | 96598 | 433.9 | 1139 | 1111 | 220.1 |
| B | 5 | 172 | 64767 | 289.26 | 1139 | 1111 | 220.1 |
| C | 1 | 16 | 108409 | 423.4 | 1094 | 1095 | 253.5 |
| C | 12 | 4 | 8977 | 31.1 | 1094 | 1095 | 253.5 |
| C | 13 | 61 | 8664 | 29.86 | 1094 | 1095 | 253.5 |
| D | 2 | 152 | 265818 | 986.72 | 1094 | 1059 | 268.3 |
| D | 11 | 241 | 112123 | 413.92 | 1094 | 1059 | 268.3 |
| D | 2 | 14 | 59090 | 216.27 | 1094 | 1059 | 268.3 |
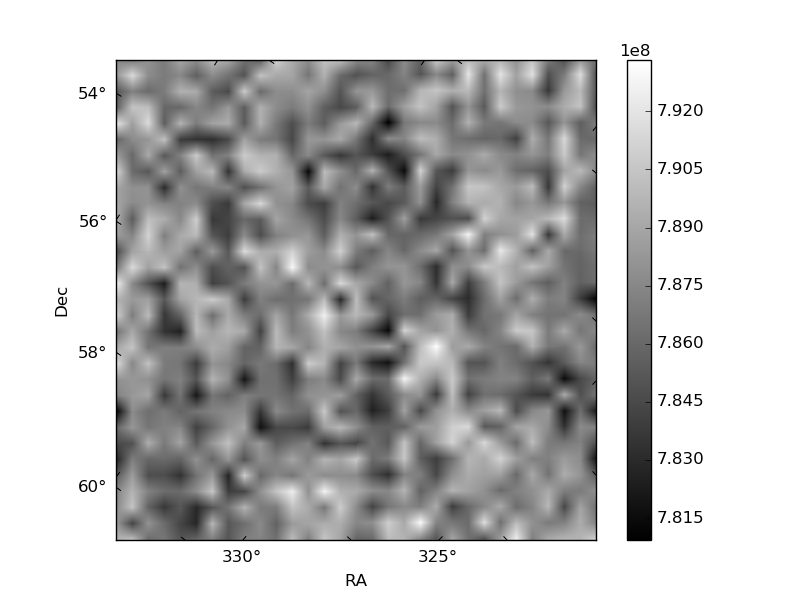
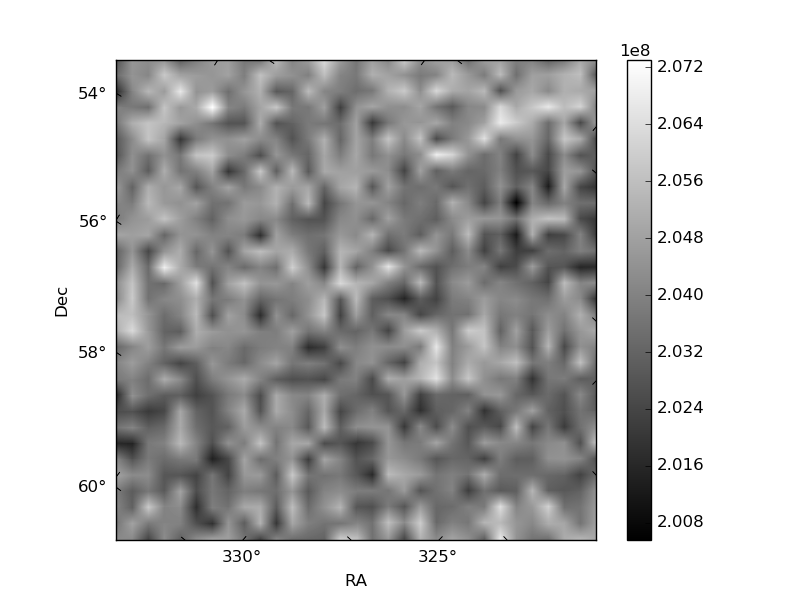
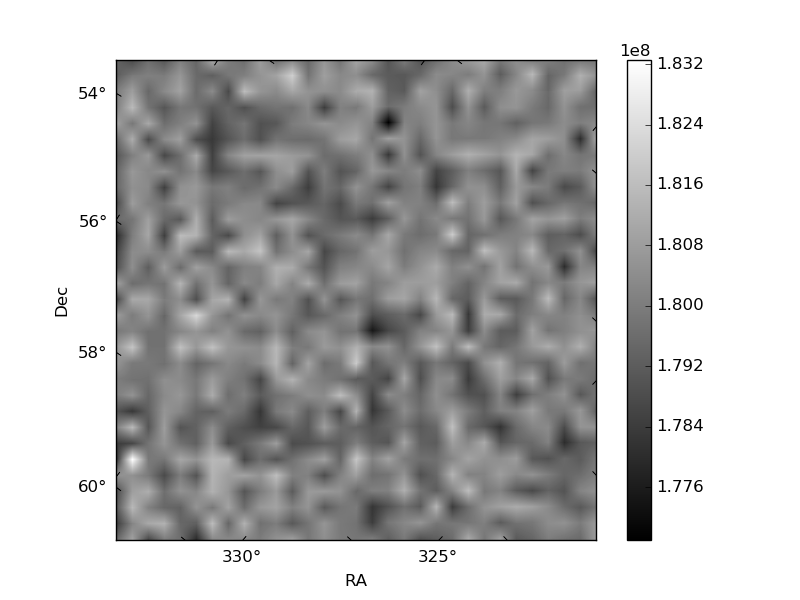
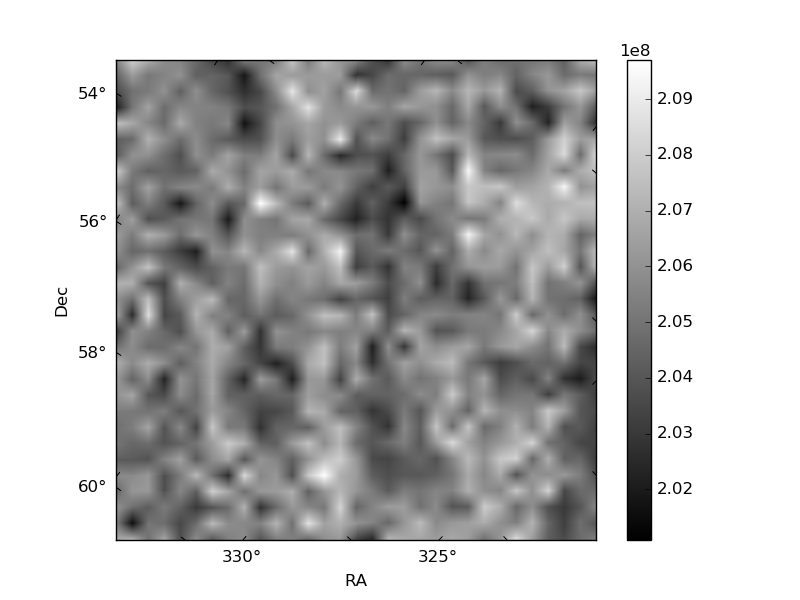
Histogram calculated using DETX and DETY for each event in the final _common_clean file
| Quadrant A | 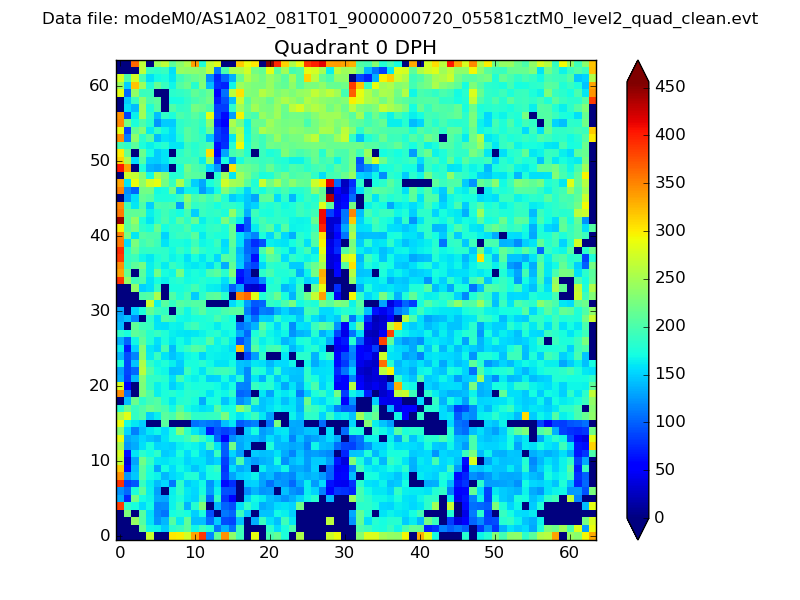 |
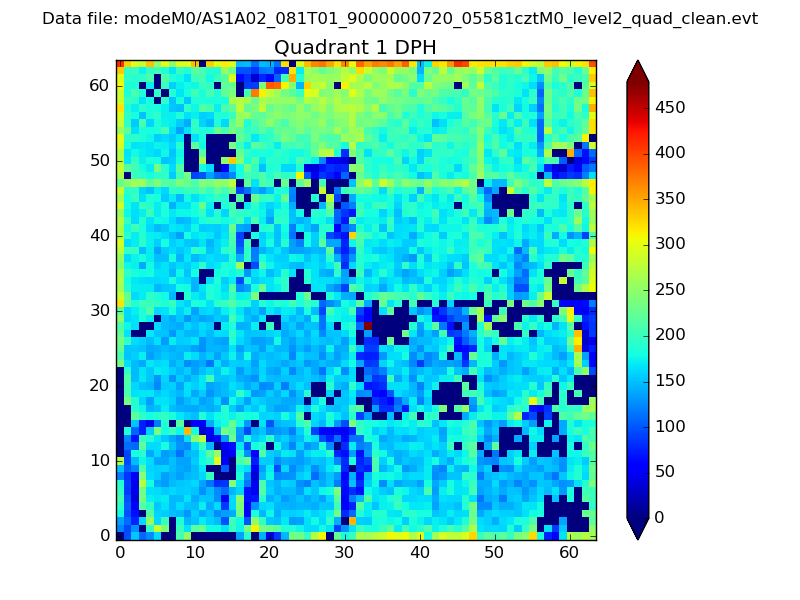 |
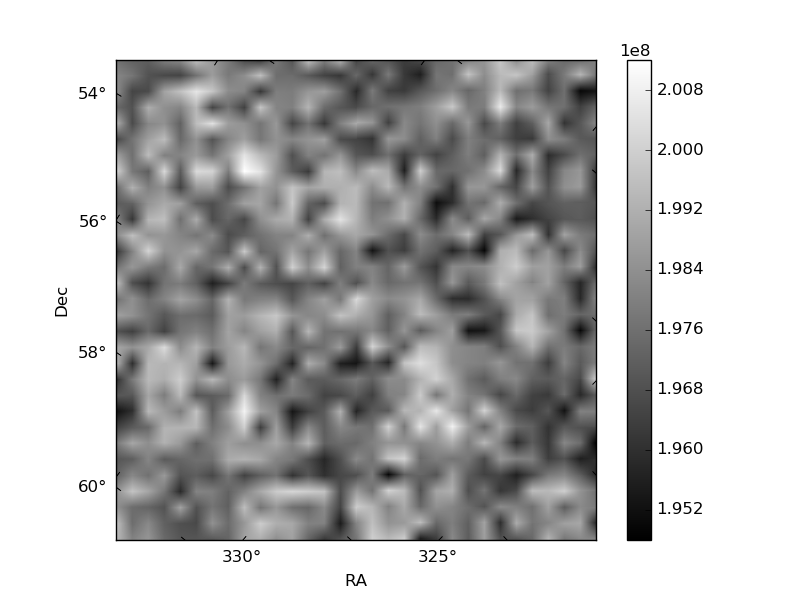
Quadrant B |
|---|---|---|---|
| Quadrant D | 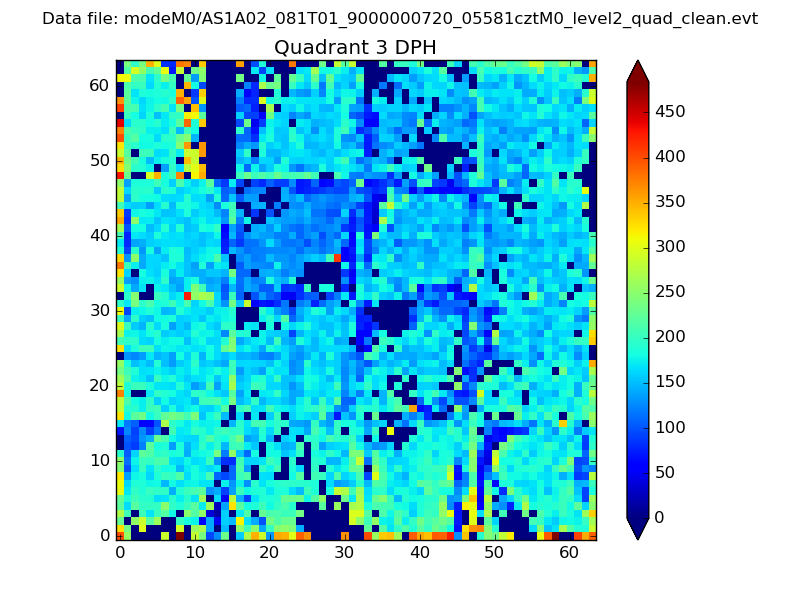 |
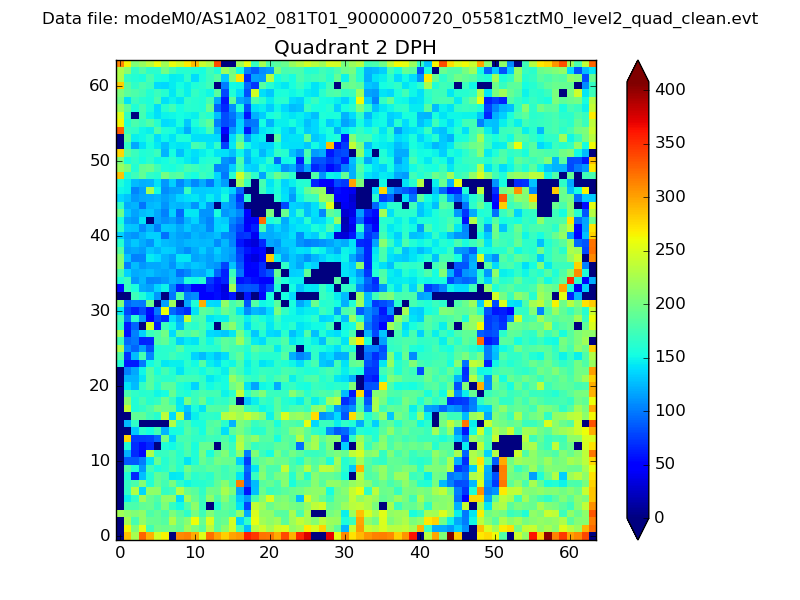 |
Quadrant C |
| Plot type | Count rate plots | Images |
|---|---|---|
| Comparison with Poisson distribution Blue bars denote a histogram of data divided into 1 sec bins. Red curve is a Poisson curve with rate = median count rate of data. |
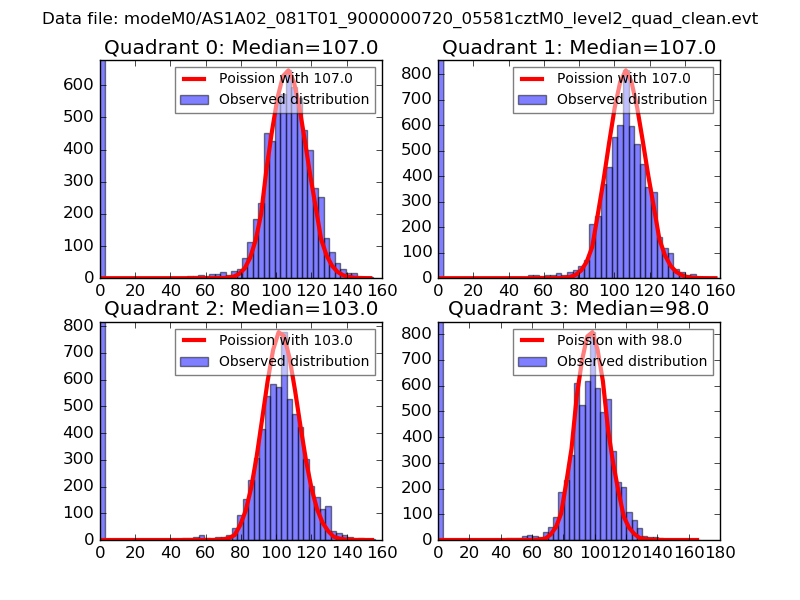 |
 |
| Quadrant-wise count rates Data is divided into 100 sec bins |
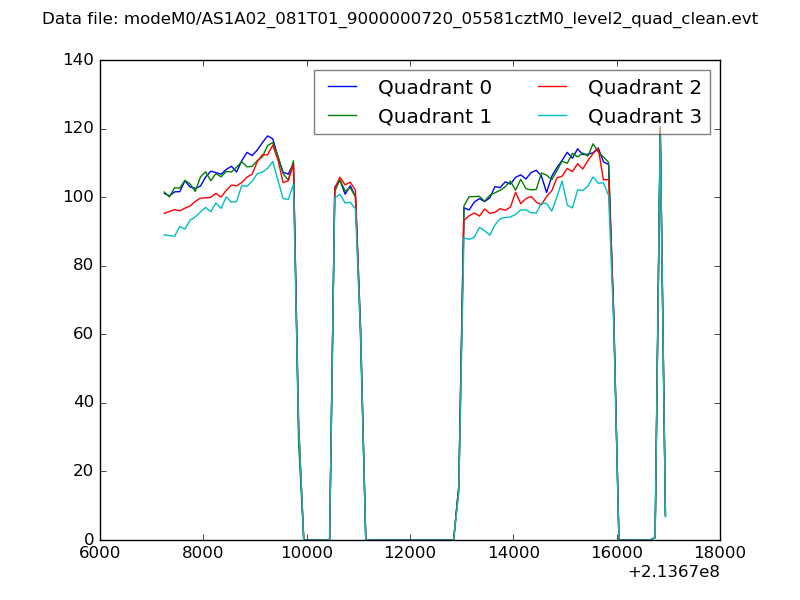 |
|
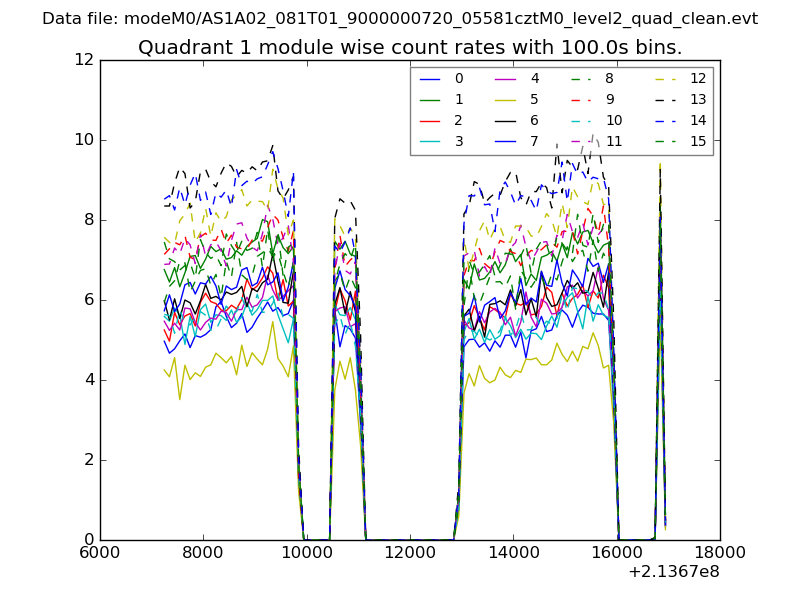
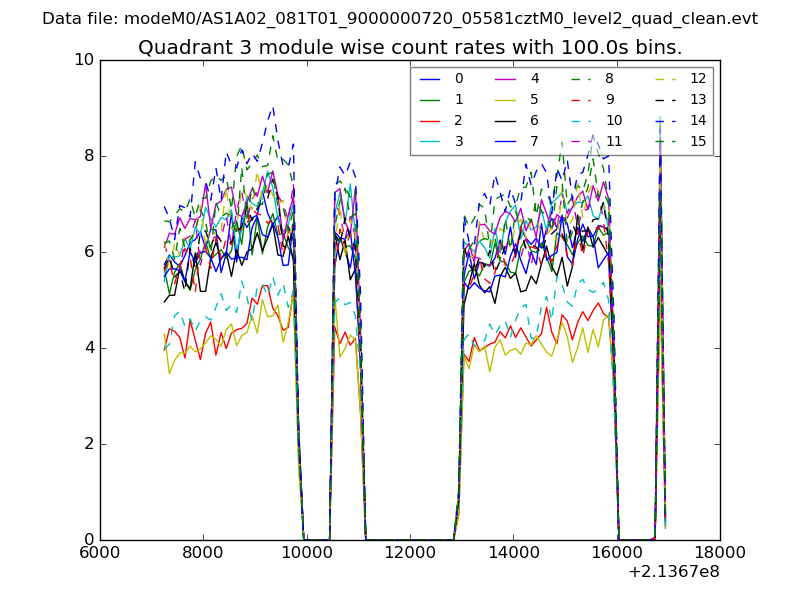
| Module-wise count rates for Quadrant A Data is divided into 100 sec bins |
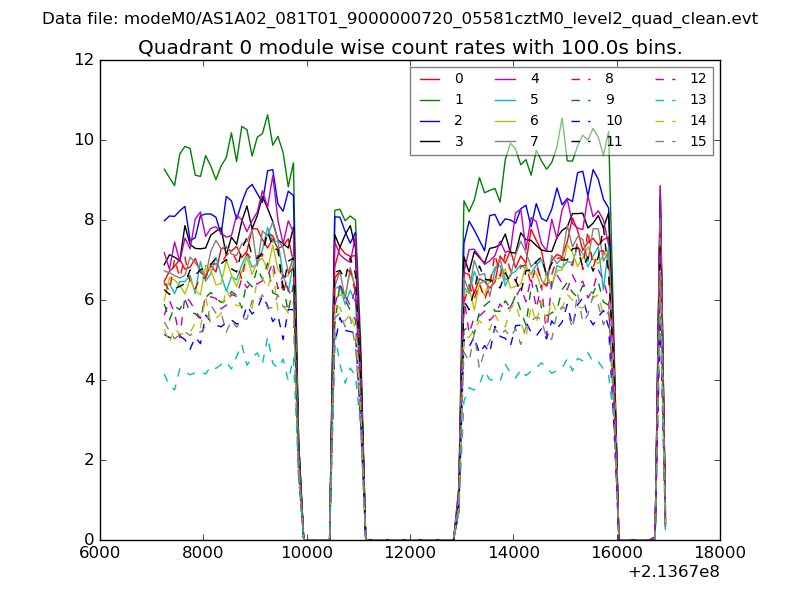 |
 |
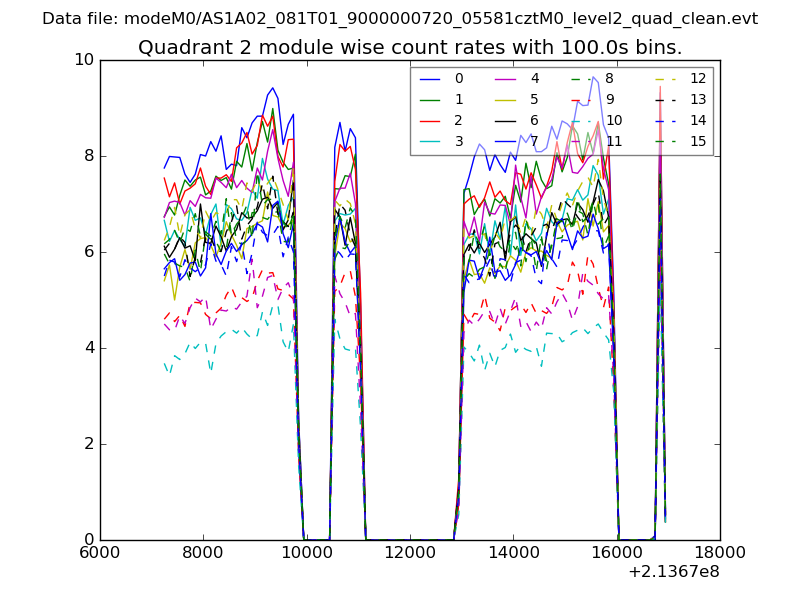
| Module-wise count rates for Quadrant B Data is divided into 100 sec bins |
 |
 |
| Module-wise count rates for Quadrant C Data is divided into 100 sec bins |
 |
 |
| Module-wise count rates for Quadrant D Data is divided into 100 sec bins |
 |
 |
| Parameter | Plot |
|---|---|
| CZT HV Monitor | 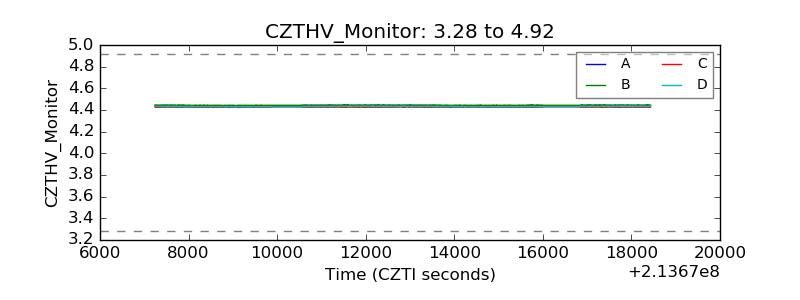 |
| D_VDD | 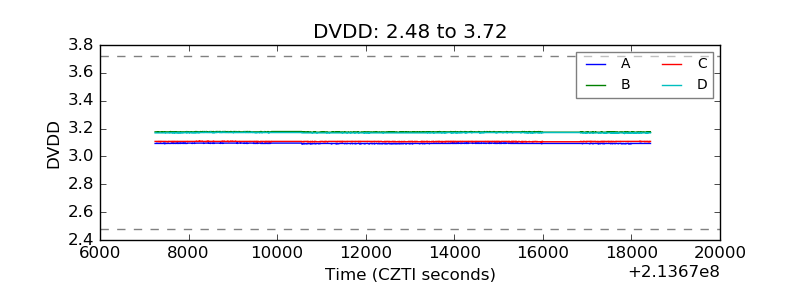 |
| Temperature 1 | 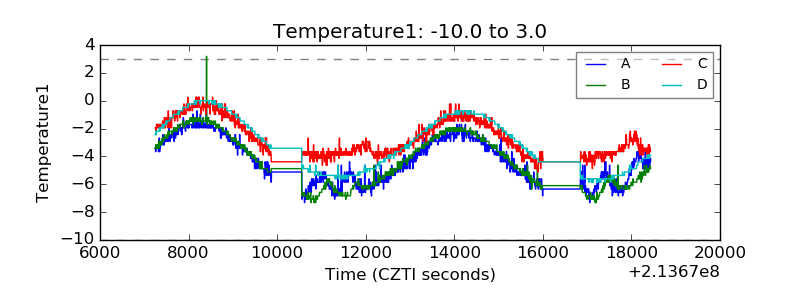 |
| Veto HV Monitor | 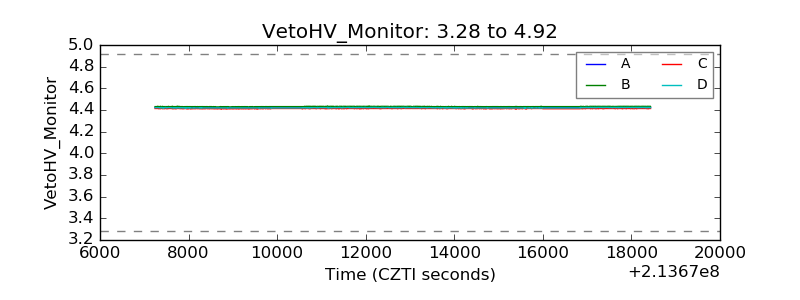 |
| Veto LLD | 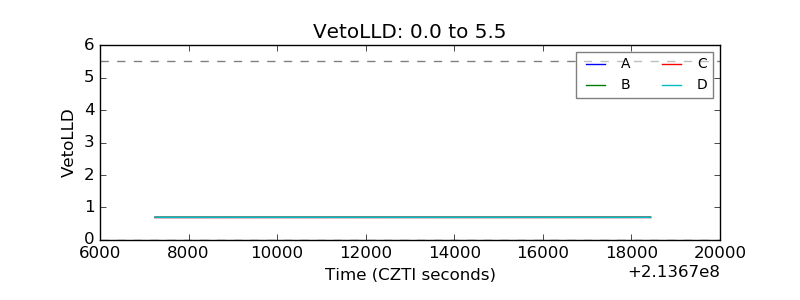 |
| Alpha Counter | 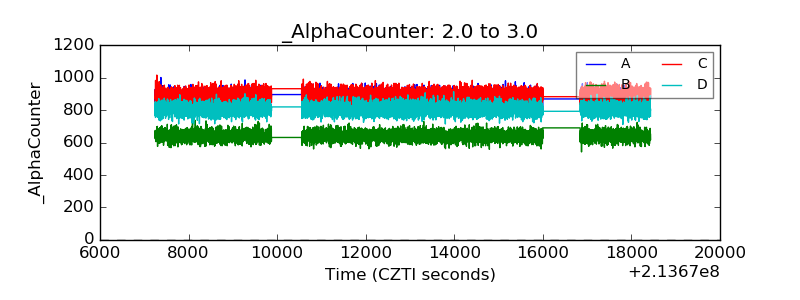 |
| _CPM_Rate | 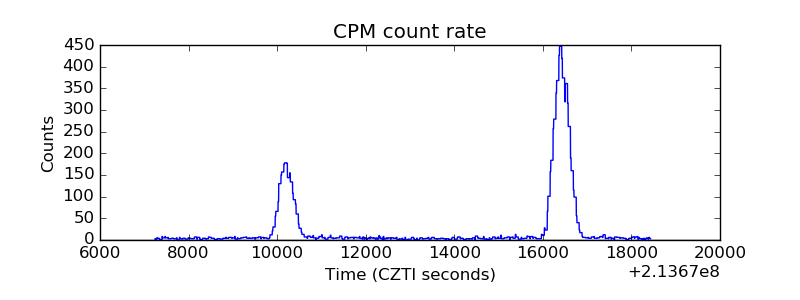 |
| CZT Counter | 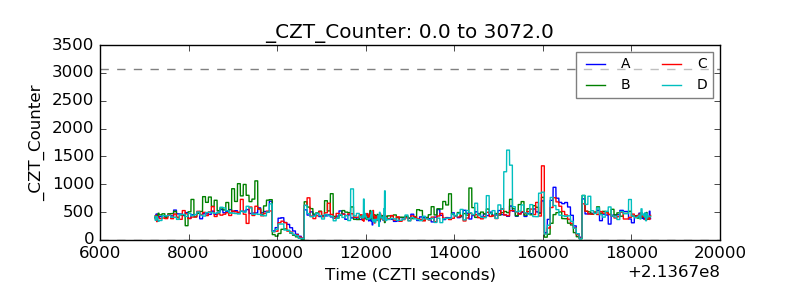 |
| +2.5 Volts monitor |  |
| +5 Volts monitor |  |
| _ROLL_ROT | 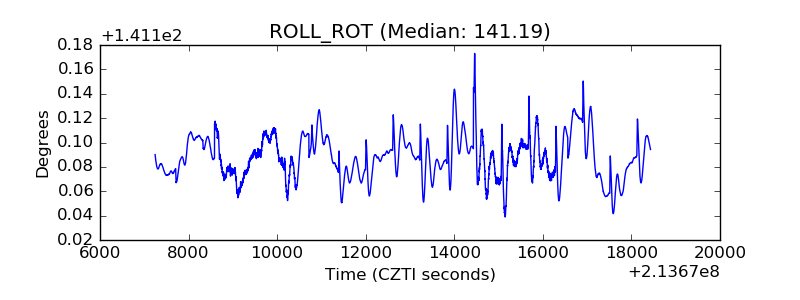 |
| _Roll_DEC | 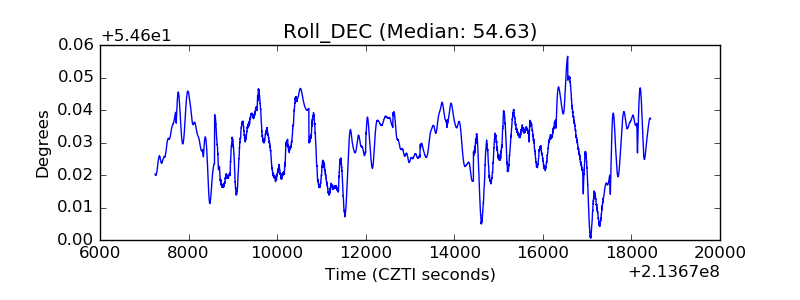 |
| _Roll_RA | 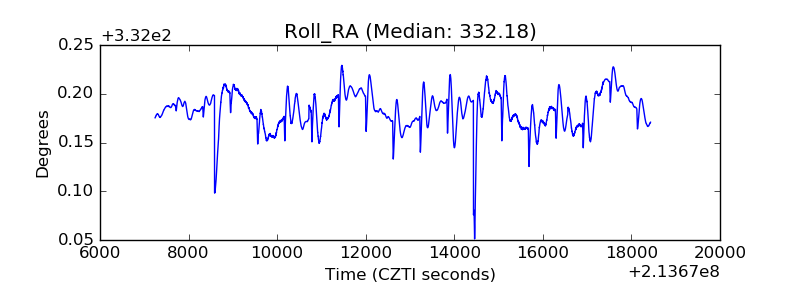 |
| Veto Counter | 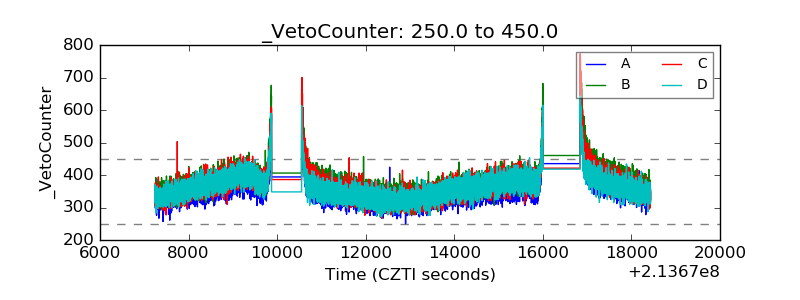 |