| Param | Original file | Final file |
|---|---|---|
| Filename | modeM0/AS1A02_081T01_9000000720_05582cztM0_level2.evt | modeM0/AS1A02_081T01_9000000720_05582cztM0_level2_quad_clean.evt |
| Size (bytes) | 443,295,360 | 62,285,760 |
| Size | 422.8 MB | 59.4 MB |
| Events in quadrant A | 3,105,716 | 367,226 |
| Events in quadrant B | 3,442,990 | 365,755 |
| Events in quadrant C | 3,024,975 | 350,612 |
| Events in quadrant D | 3,393,757 | 332,776 |
| Mode M9 | |||
|---|---|---|---|
| Quadrant | BADHDUFLAG | Total packets | Discarded packets |
| A | 0 | 16 | 0 |
| B | 0 | 16 | 0 |
| C | 0 | 16 | 0 |
| D | 0 | 17 | 0 |
| Mode SS | |||
|---|---|---|---|
| Quadrant | BADHDUFLAG | Total packets | Discarded packets |
| A | 0 | 136 | 0 |
| B | 0 | 136 | 0 |
| C | 0 | 136 | 0 |
| D | 0 | 136 | 0 |
| Mode M0 | |||
|---|---|---|---|
| Quadrant | BADHDUFLAG | Total packets | Discarded packets |
| A | 0 | 13717 | 3 |
| B | 0 | 14488 | 2 |
| C | 0 | 13713 | 7 |
| D | 0 | 14507 | 4 |
| Quadrant | Total seconds | Saturated seconds | Saturation percentage |
|---|---|---|---|
| A | 6736 | 85 | 1.261876% |
| B | 6736 | 103 | 1.529097% |
| C | 6733 | 67 | 0.995099% |
| D | 6735 | 81 | 1.202673% |
Noise dominated data is calculated using 1-second bins in cleaned event files. If a bin has >2000 counts, and if more than 50% of those come from <1% of pixels, then it is considered to be noise-dominated and hence unusable.
| Quadrant | # 1 sec bins | Bins with >0 counts | Bins with >2000 counts | High rate bins dominated by noise | Noise dominated (total time) | Noise dominated (detector-on time) | Marked lightcurve |
|---|---|---|---|---|---|---|---|
| A | 7716 | 6736 | 1 | 1 | 0.01% | 0.01% | 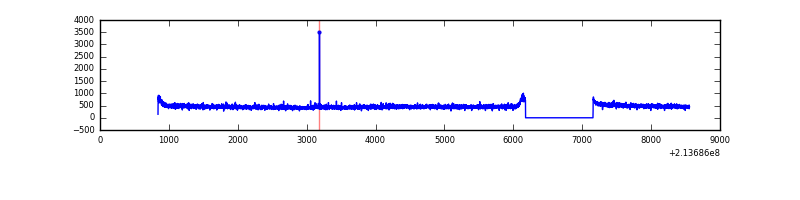 |
| B | 7716 | 6737 | 8 | 8 | 0.10% | 0.12% | 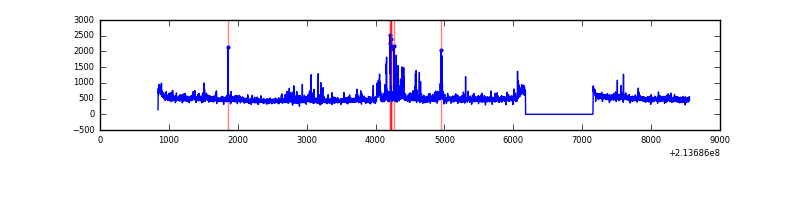 |
| C | 7716 | 6736 | 0 | 0 | 0.00% | 0.00% | 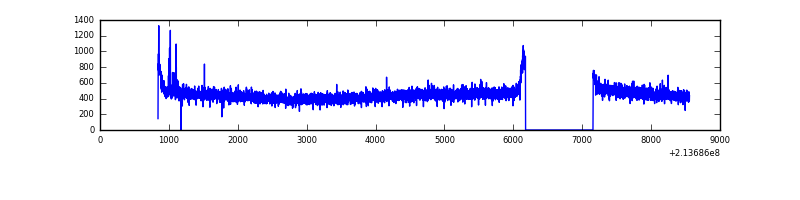 |
| D | 7716 | 6736 | 10 | 10 | 0.13% | 0.15% | 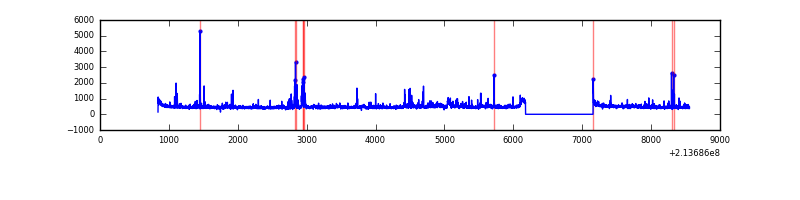 |
Top three noisy pixels from each quadrant. If the there are fewer than three noisy pixels in the level2.evt file, extra rows are filled as -1
| Pixel properties | Quadrant properties | ||||||
|---|---|---|---|---|---|---|---|
| Quadrant | DetID | PixID | Counts | Sigma | Mean | Median | Sigma |
| A | 13 | 251 | 14892 | 85.88 | 799 | 781 | 164.3 |
| A | 13 | 14 | 10252 | 57.64 | 799 | 781 | 164.3 |
| A | 13 | 6 | 9415 | 52.55 | 799 | 781 | 164.3 |
| B | 15 | 204 | 177077 | 1132.44 | 806 | 788 | 155.7 |
| B | 11 | 51 | 47344 | 299.07 | 806 | 788 | 155.7 |
| B | 0 | 214 | 41142 | 259.23 | 806 | 788 | 155.7 |
| C | 1 | 16 | 13887 | 73.39 | 769 | 772 | 178.7 |
| C | 13 | 61 | 6180 | 30.26 | 769 | 772 | 178.7 |
| C | 8 | 128 | 5230 | 24.95 | 769 | 772 | 178.7 |
| D | 11 | 241 | 192617 | 1025.16 | 766 | 744 | 187.2 |
| D | 12 | 233 | 79298 | 419.71 | 766 | 744 | 187.2 |
| D | 2 | 152 | 65617 | 346.61 | 766 | 744 | 187.2 |
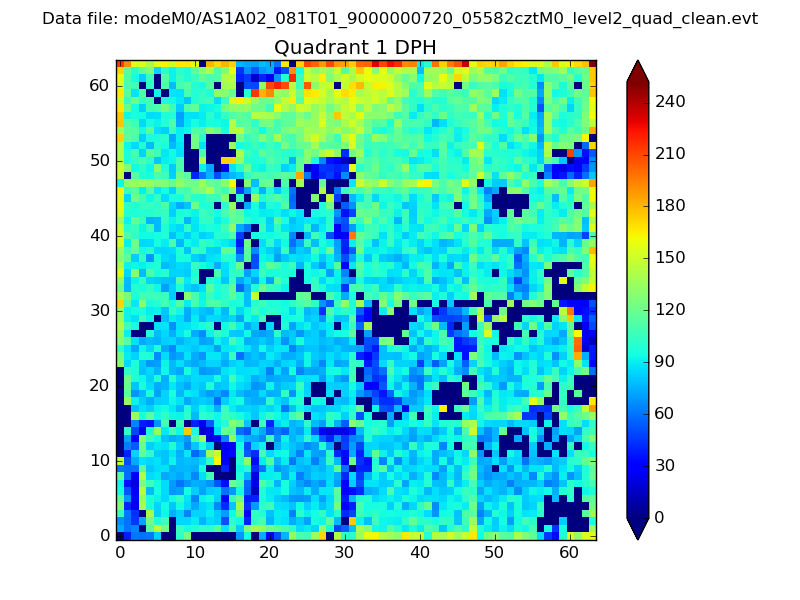
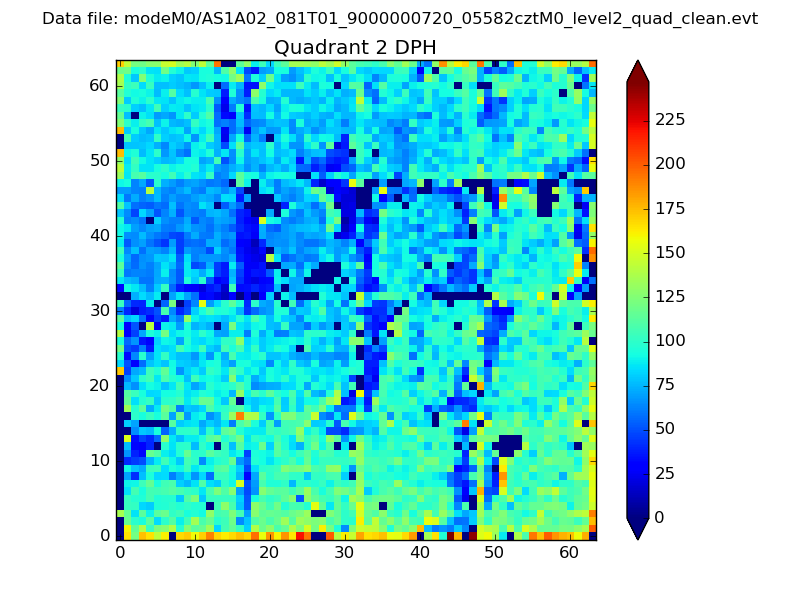
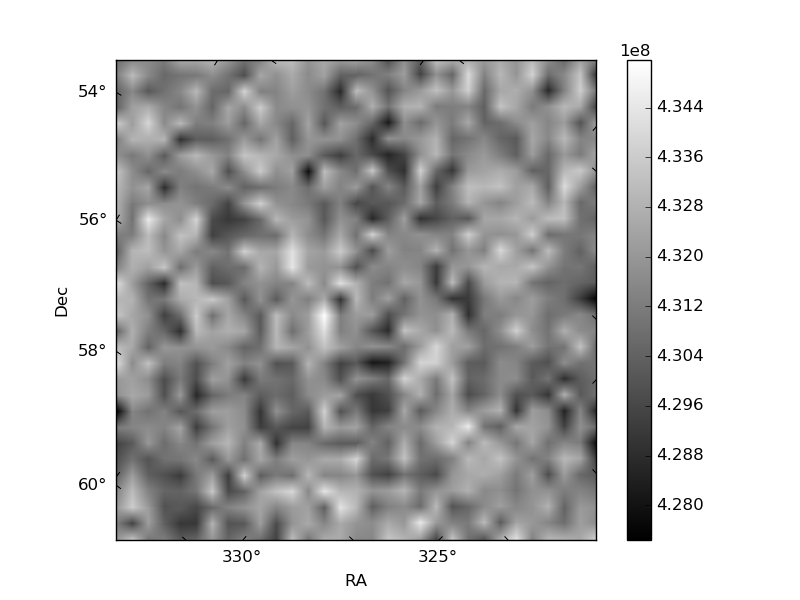
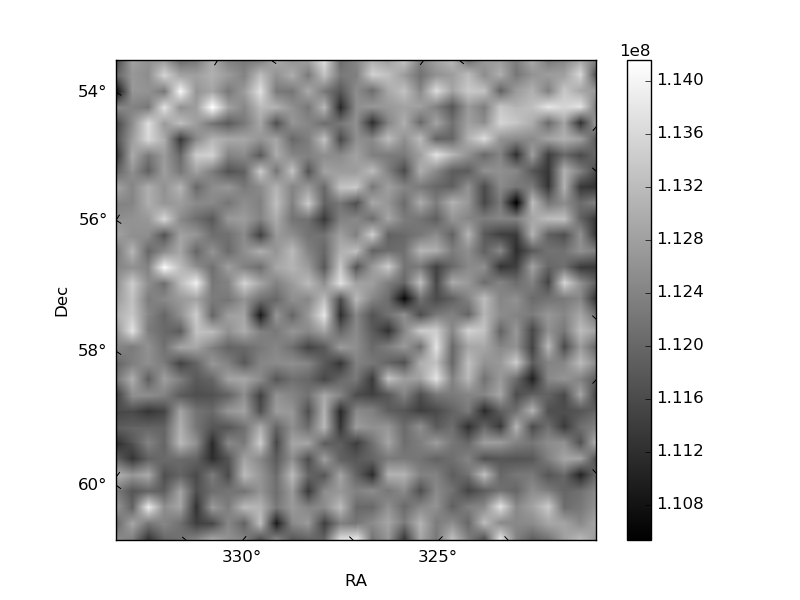
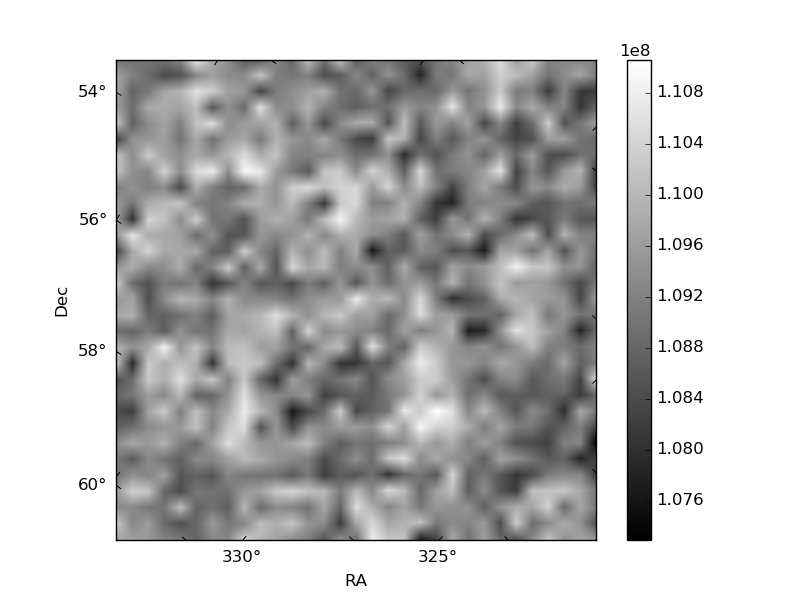
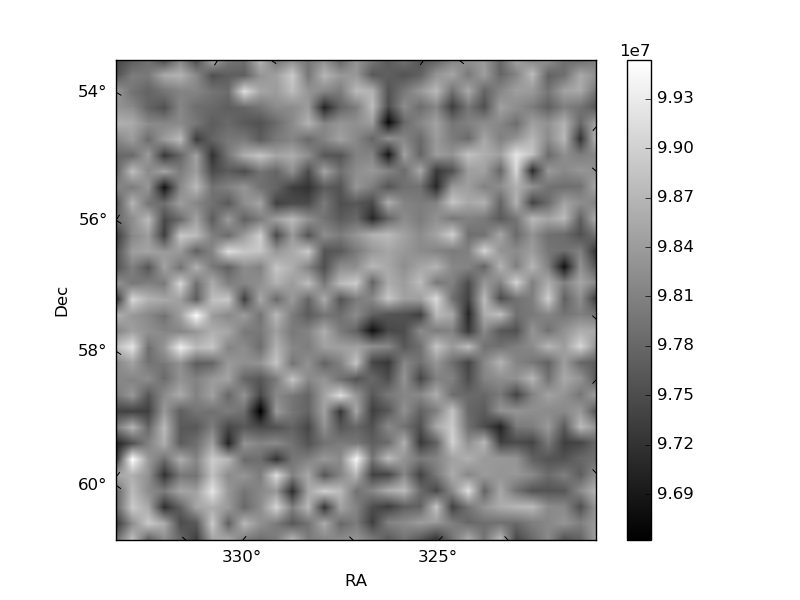
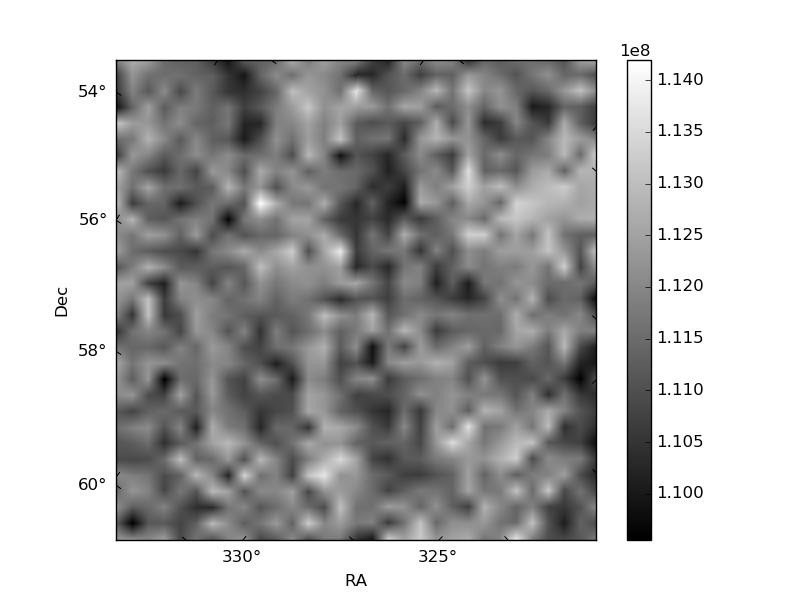
Histogram calculated using DETX and DETY for each event in the final _common_clean file
| Quadrant A |  |
 |
Quadrant B |
|---|---|---|---|
| Quadrant D | 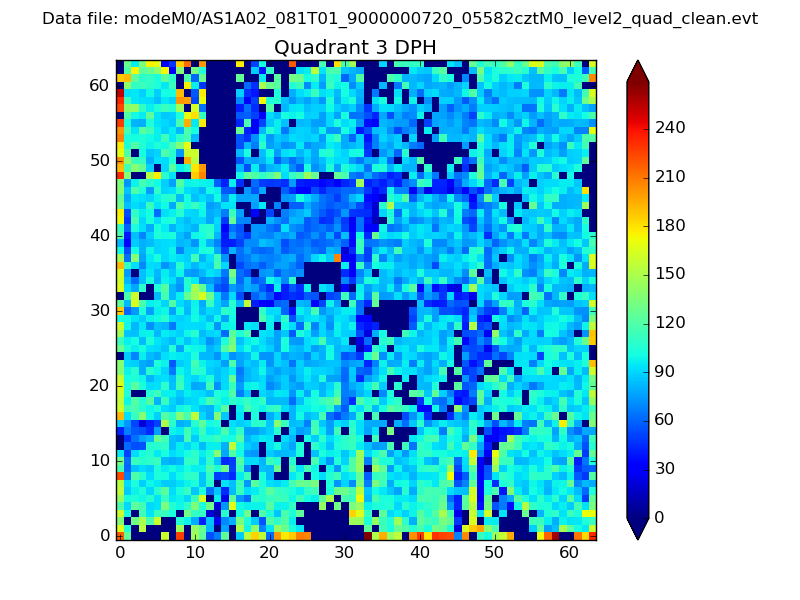 |
 |
Quadrant C |
| Plot type | Count rate plots | Images |
|---|---|---|
| Comparison with Poisson distribution Blue bars denote a histogram of data divided into 1 sec bins. Red curve is a Poisson curve with rate = median count rate of data. |
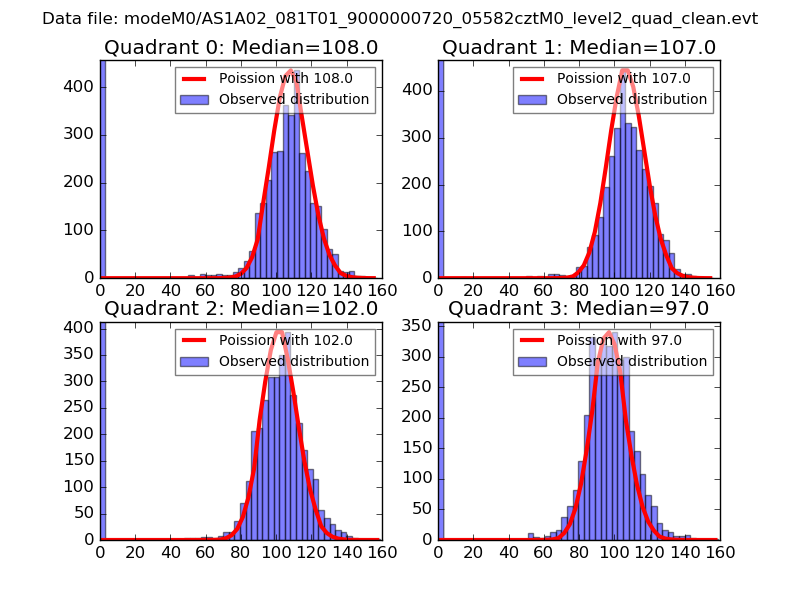 |
 |
| Quadrant-wise count rates Data is divided into 100 sec bins |
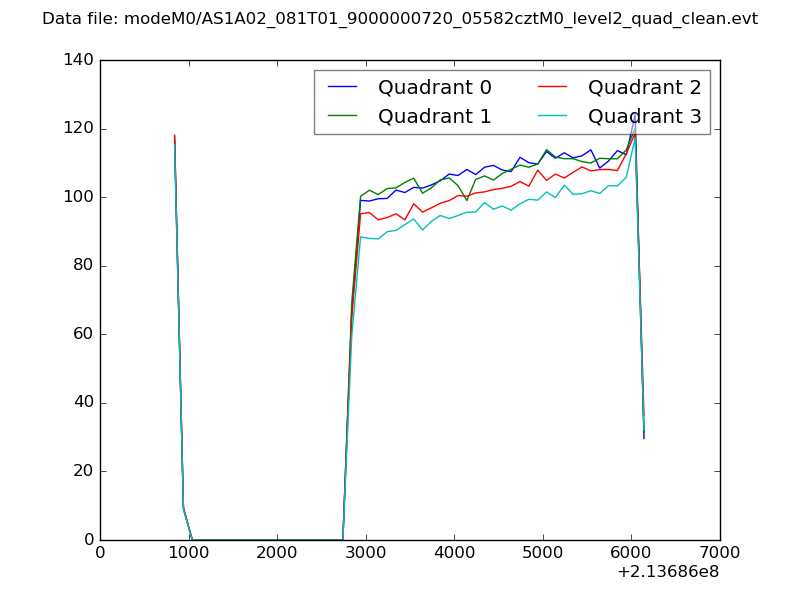 |
|
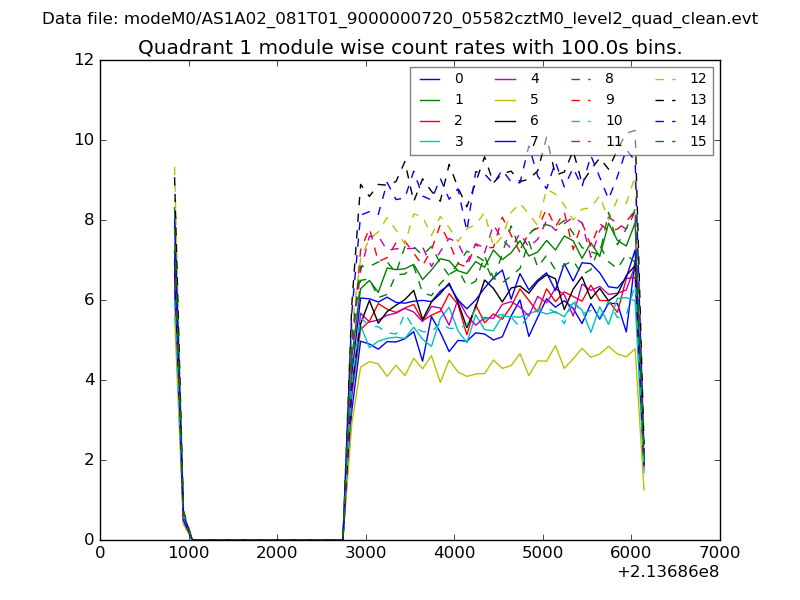
| Module-wise count rates for Quadrant A Data is divided into 100 sec bins |
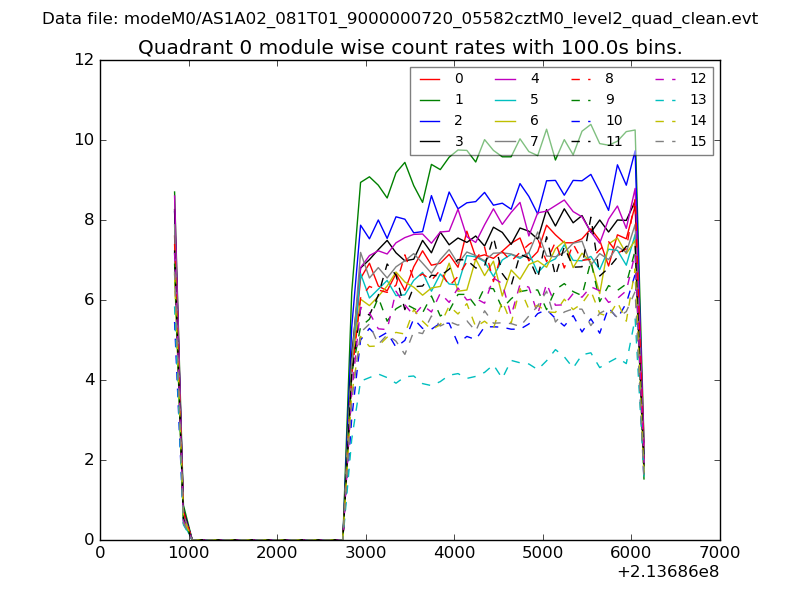 |
 |
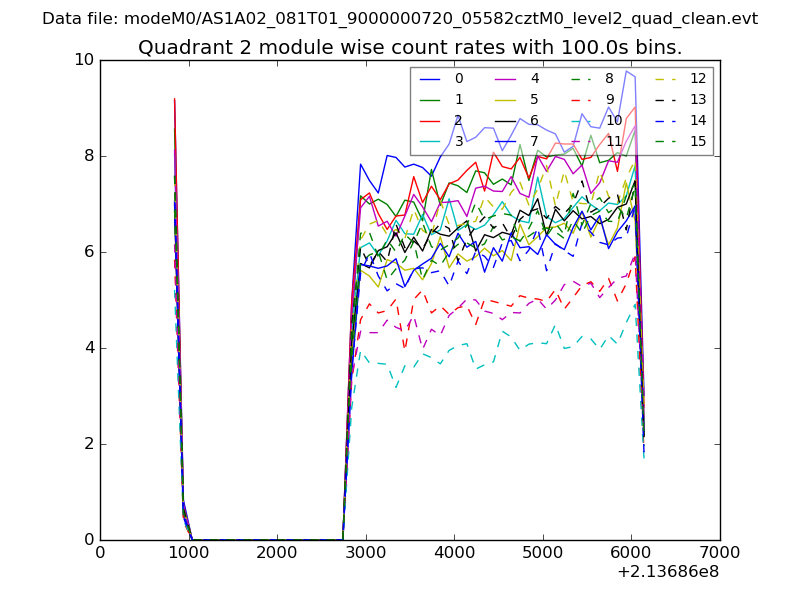
| Module-wise count rates for Quadrant B Data is divided into 100 sec bins |
 |
 |
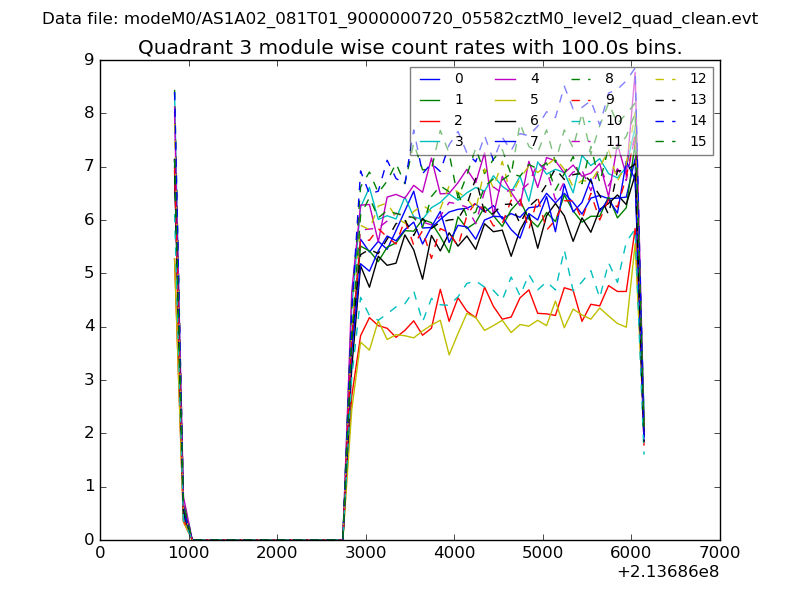
| Module-wise count rates for Quadrant C Data is divided into 100 sec bins |
 |
 |
| Module-wise count rates for Quadrant D Data is divided into 100 sec bins |
 |
 |
| Parameter | Plot |
|---|---|
| CZT HV Monitor | 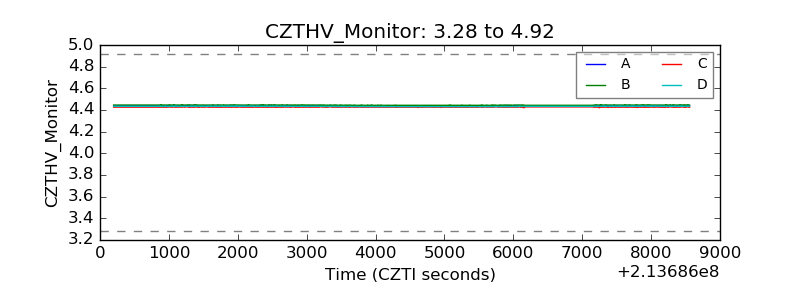 |
| D_VDD | 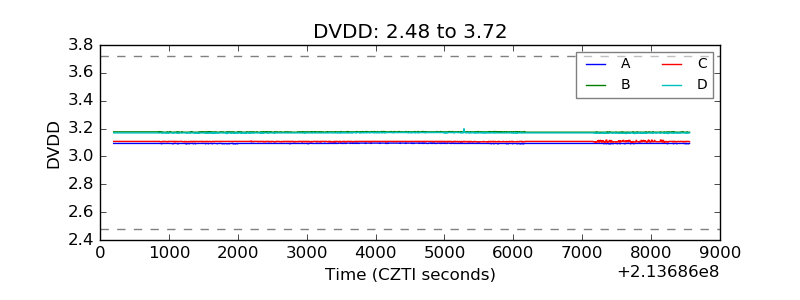 |
| Temperature 1 | 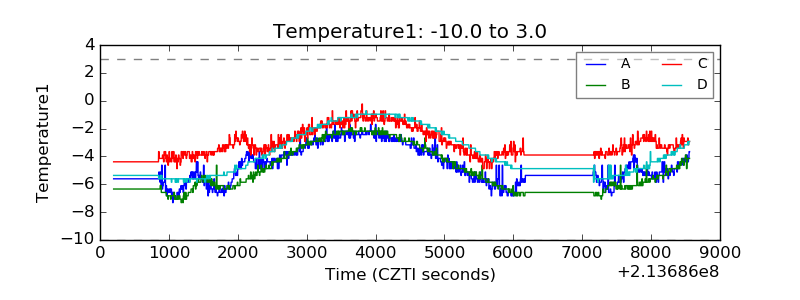 |
| Veto HV Monitor | 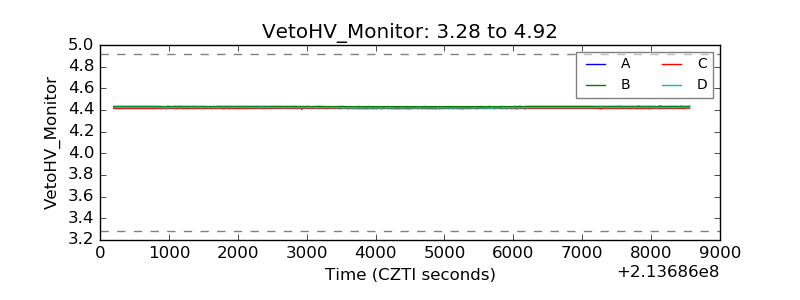 |
| Veto LLD | 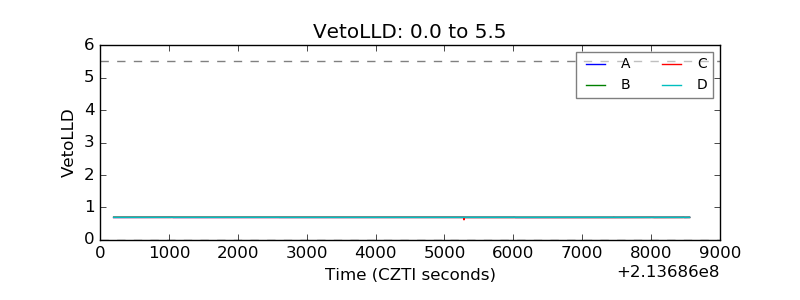 |
| Alpha Counter | 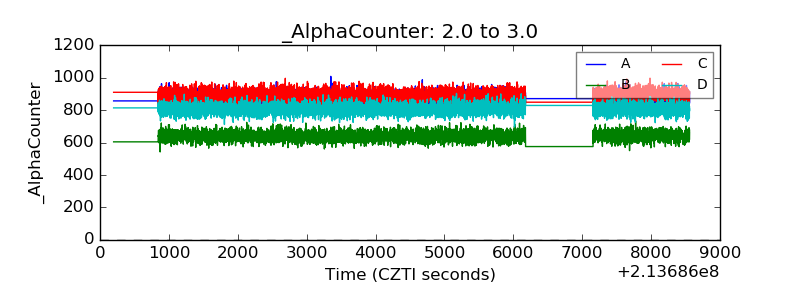 |
| _CPM_Rate |  |
| CZT Counter | 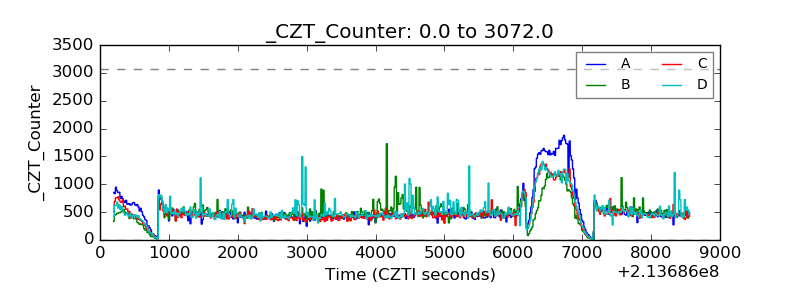 |
| +2.5 Volts monitor |  |
| +5 Volts monitor |  |
| _ROLL_ROT | 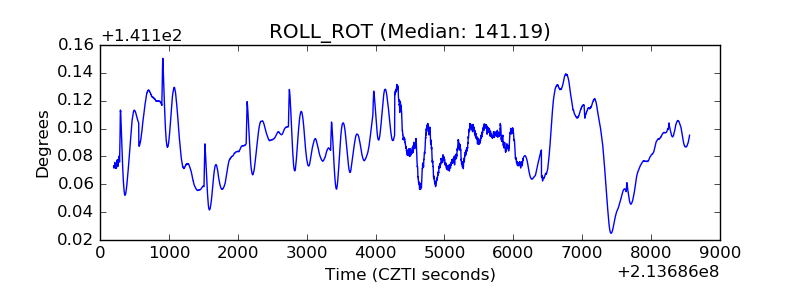 |
| _Roll_DEC | 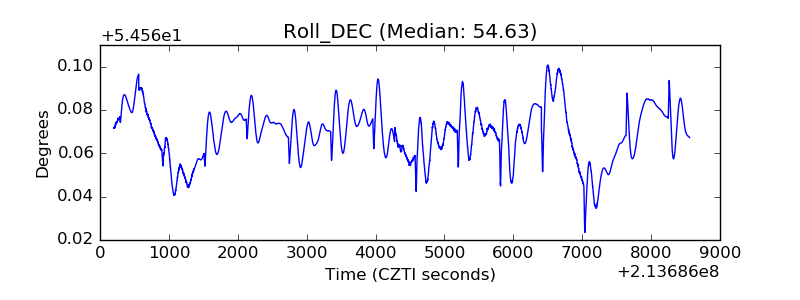 |
| _Roll_RA | 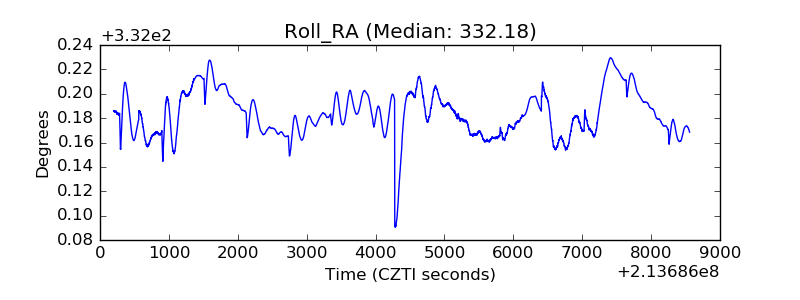 |
| Veto Counter | 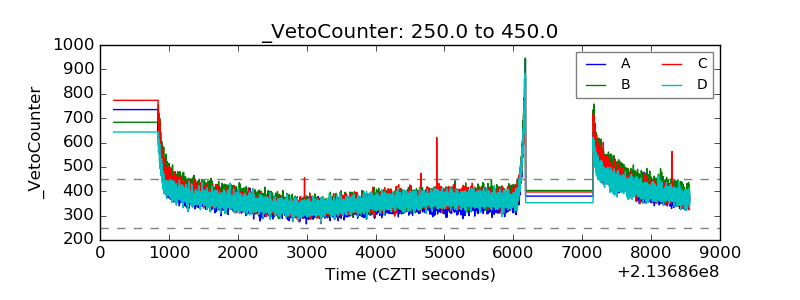 |