| Param | Original file | Final file |
|---|---|---|
| Filename | modeM0/AS1A02_081T01_9000000720_05584cztM0_level2.evt | modeM0/AS1A02_081T01_9000000720_05584cztM0_level2_quad_clean.evt |
| Size (bytes) | 431,277,120 | 67,268,160 |
| Size | 411.3 MB | 64.2 MB |
| Events in quadrant A | 3,093,703 | 408,888 |
| Events in quadrant B | 3,286,637 | 410,603 |
| Events in quadrant C | 2,974,087 | 391,568 |
| Events in quadrant D | 3,265,207 | 372,703 |
| Mode M9 | |||
|---|---|---|---|
| Quadrant | BADHDUFLAG | Total packets | Discarded packets |
| A | 0 | 12 | 0 |
| B | 0 | 12 | 0 |
| C | 0 | 12 | 0 |
| D | 0 | 13 | 0 |
| Mode SS | |||
|---|---|---|---|
| Quadrant | BADHDUFLAG | Total packets | Discarded packets |
| A | 0 | 132 | 0 |
| B | 0 | 132 | 0 |
| C | 0 | 132 | 0 |
| D | 0 | 132 | 0 |
| Mode M0 | |||
|---|---|---|---|
| Quadrant | BADHDUFLAG | Total packets | Discarded packets |
| A | 0 | 13447 | 3 |
| B | 0 | 13713 | 2 |
| C | 0 | 13258 | 2 |
| D | 0 | 13930 | 2 |
| Quadrant | Total seconds | Saturated seconds | Saturation percentage |
|---|---|---|---|
| A | 6493 | 61 | 0.939473% |
| B | 6493 | 60 | 0.924072% |
| C | 6493 | 32 | 0.492838% |
| D | 6493 | 68 | 1.047282% |
Noise dominated data is calculated using 1-second bins in cleaned event files. If a bin has >2000 counts, and if more than 50% of those come from <1% of pixels, then it is considered to be noise-dominated and hence unusable.
| Quadrant | # 1 sec bins | Bins with >0 counts | Bins with >2000 counts | High rate bins dominated by noise | Noise dominated (total time) | Noise dominated (detector-on time) | Marked lightcurve |
|---|---|---|---|---|---|---|---|
| A | 7613 | 6494 | 3 | 3 | 0.04% | 0.05% | 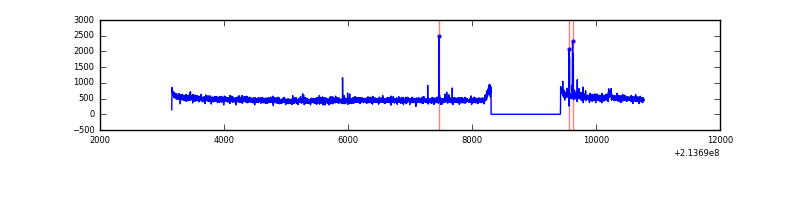 |
| B | 7613 | 6494 | 1 | 1 | 0.01% | 0.02% | 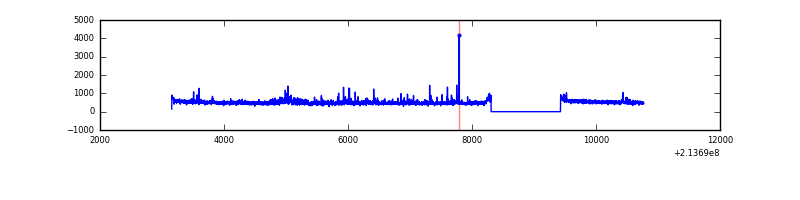 |
| C | 7613 | 6494 | 0 | 0 | 0.00% | 0.00% | 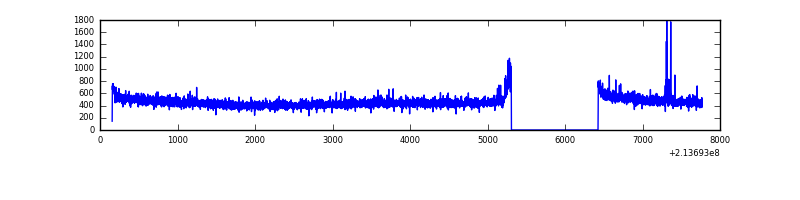 |
| D | 7613 | 6494 | 22 | 22 | 0.29% | 0.34% | 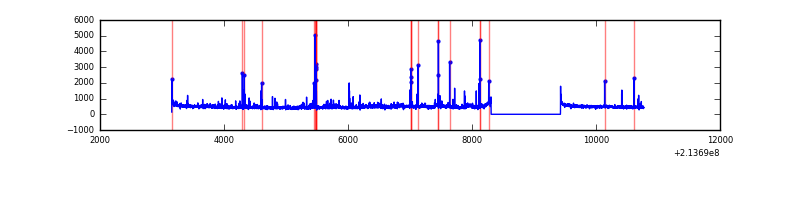 |
Top three noisy pixels from each quadrant. If the there are fewer than three noisy pixels in the level2.evt file, extra rows are filled as -1
| Pixel properties | Quadrant properties | ||||||
|---|---|---|---|---|---|---|---|
| Quadrant | DetID | PixID | Counts | Sigma | Mean | Median | Sigma |
| A | 14 | 111 | 33010 | 200.01 | 789 | 772 | 161.2 |
| A | 13 | 6 | 12333 | 71.73 | 789 | 772 | 161.2 |
| A | 12 | 194 | 7567 | 42.16 | 789 | 772 | 161.2 |
| B | 11 | 51 | 71119 | 465.23 | 794 | 777 | 151.2 |
| B | 15 | 204 | 62816 | 410.32 | 794 | 777 | 151.2 |
| B | 10 | 246 | 21409 | 136.46 | 794 | 777 | 151.2 |
| C | 1 | 16 | 24885 | 139.06 | 752 | 757 | 173.5 |
| C | 13 | 61 | 6154 | 31.11 | 752 | 757 | 173.5 |
| C | 8 | 128 | 5191 | 25.56 | 752 | 757 | 173.5 |
| D | 11 | 241 | 141250 | 766.12 | 753 | 731 | 183.4 |
| D | 2 | 152 | 63238 | 340.79 | 753 | 731 | 183.4 |
| D | 8 | 195 | 47703 | 256.1 | 753 | 731 | 183.4 |
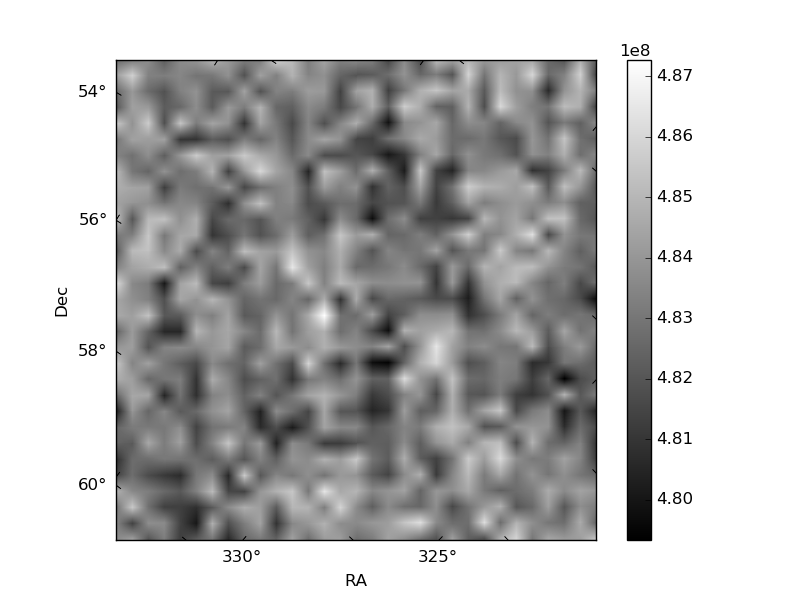
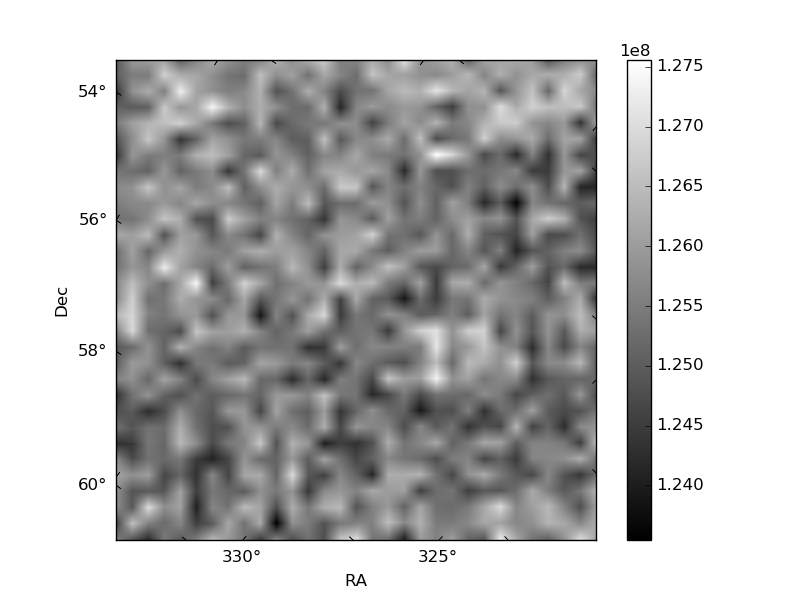
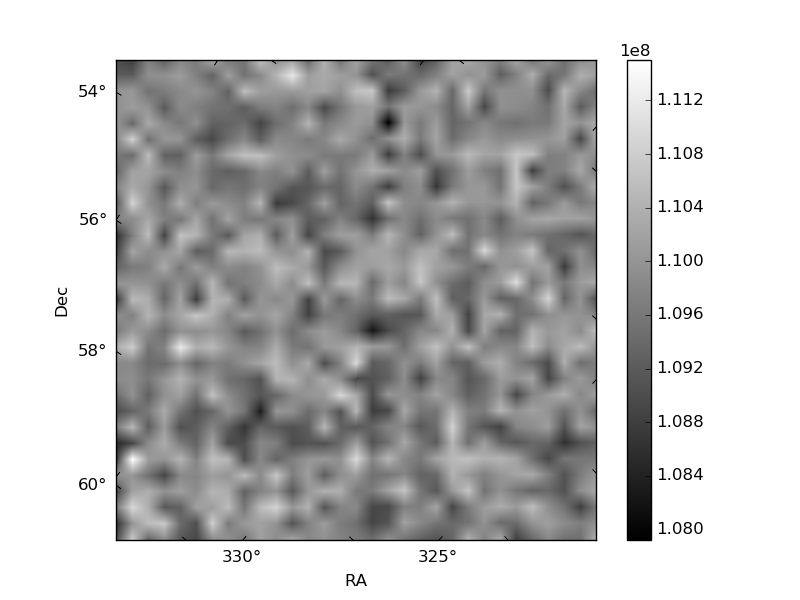
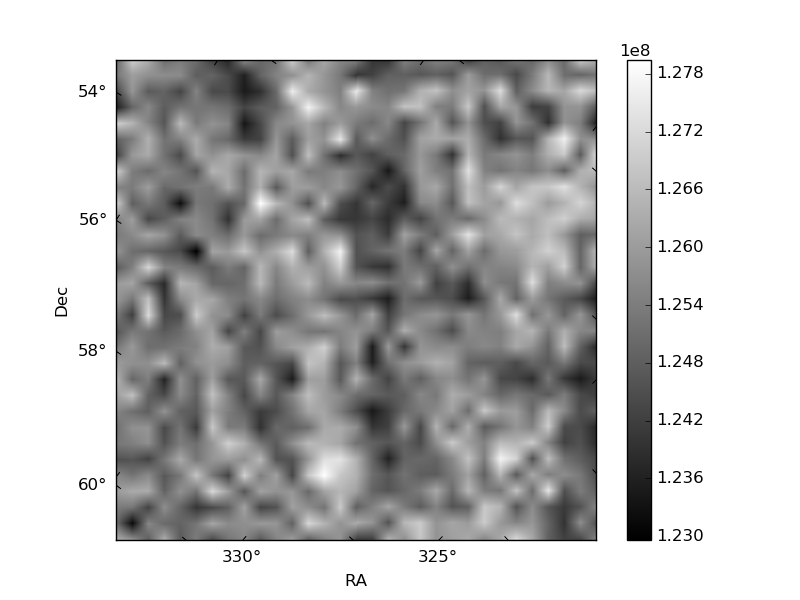
Histogram calculated using DETX and DETY for each event in the final _common_clean file
| Quadrant A | 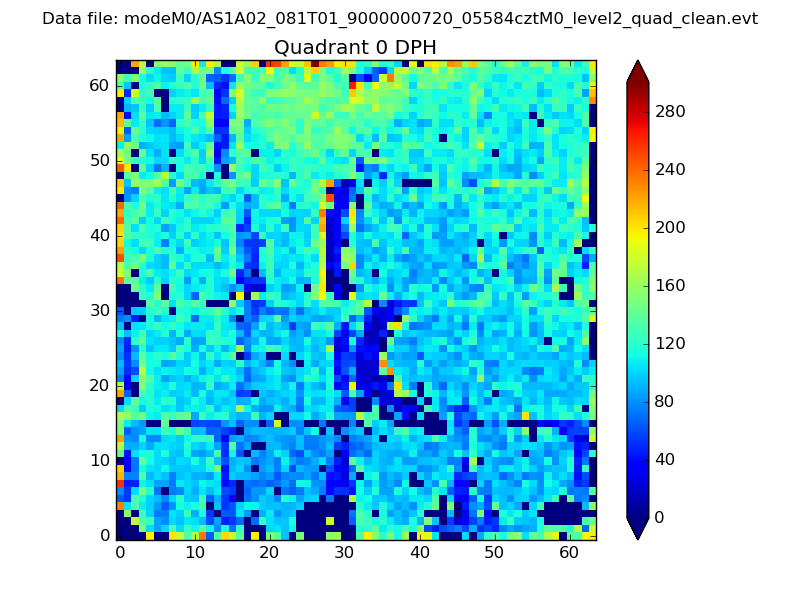 |
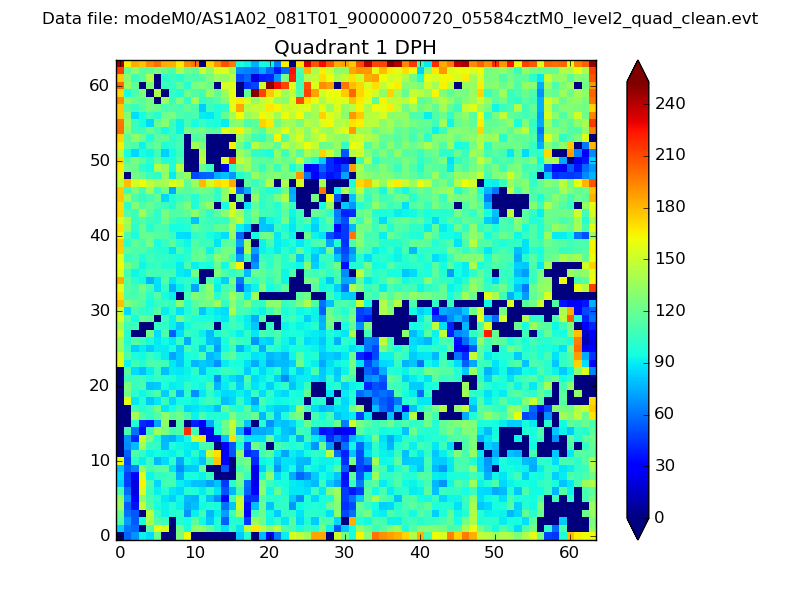 |
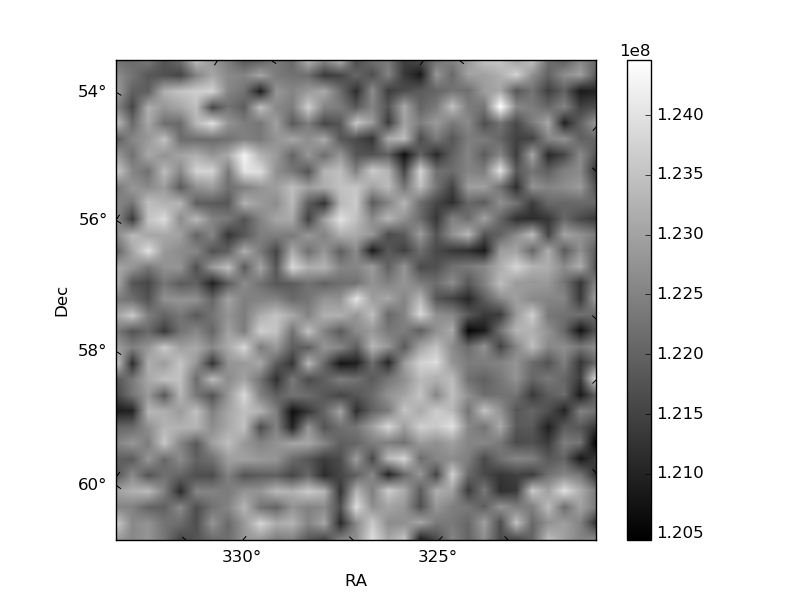
Quadrant B |
|---|---|---|---|
| Quadrant D | 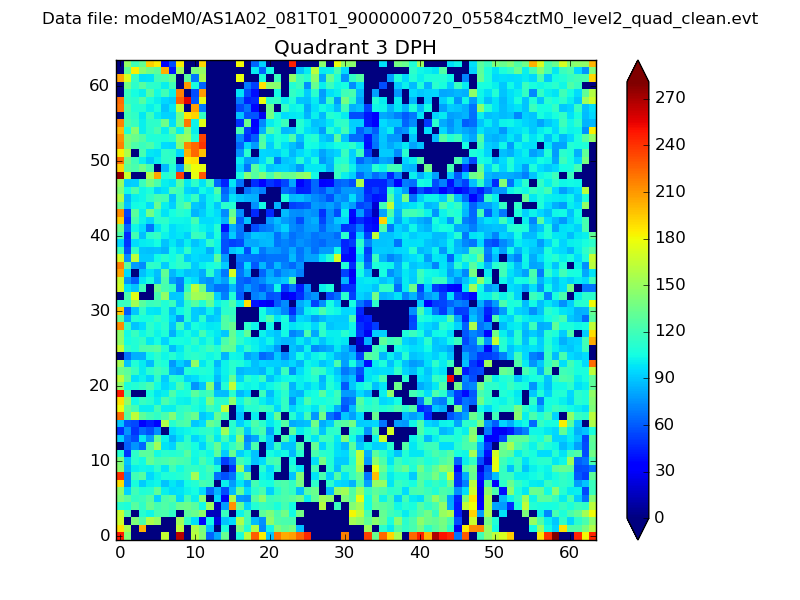 |
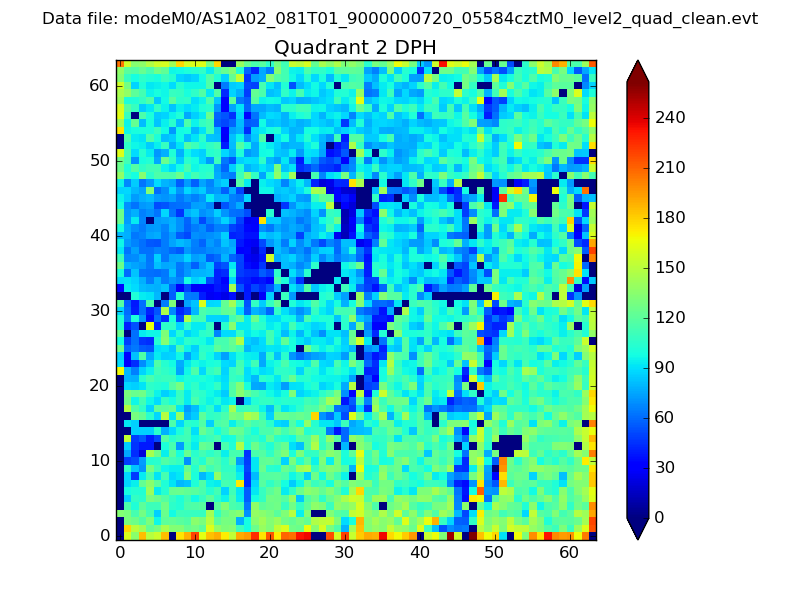 |
Quadrant C |
| Plot type | Count rate plots | Images |
|---|---|---|
| Comparison with Poisson distribution Blue bars denote a histogram of data divided into 1 sec bins. Red curve is a Poisson curve with rate = median count rate of data. |
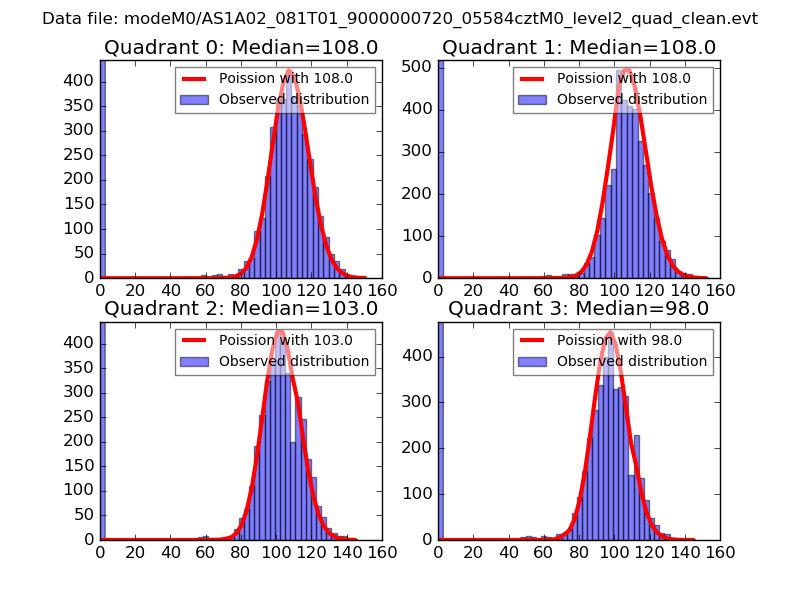 |
 |
| Quadrant-wise count rates Data is divided into 100 sec bins |
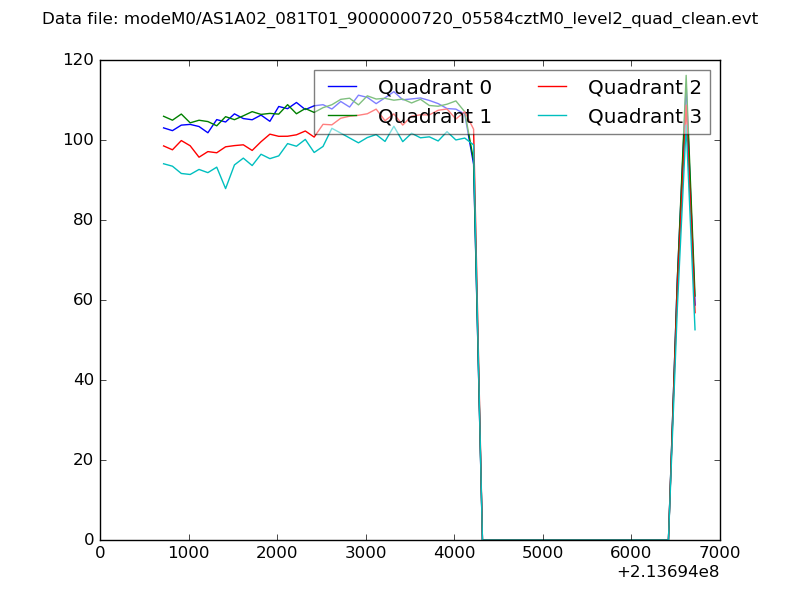 |
|
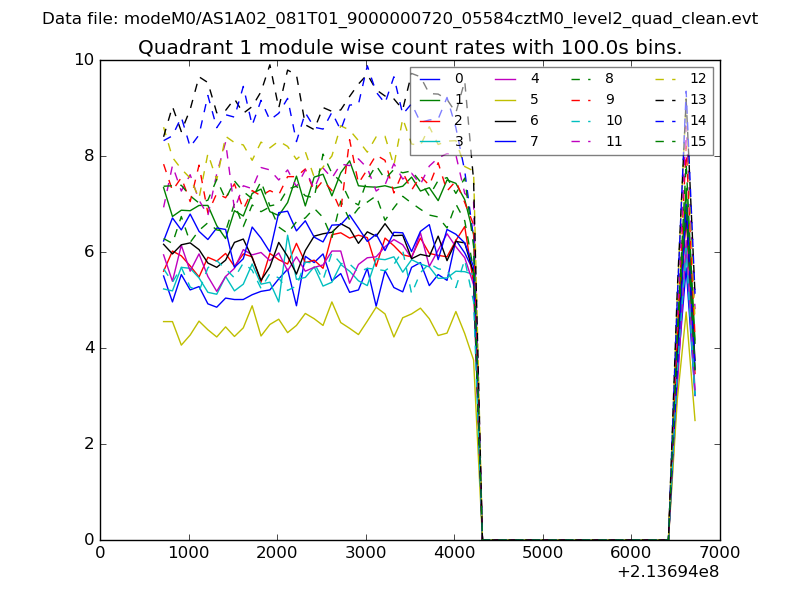
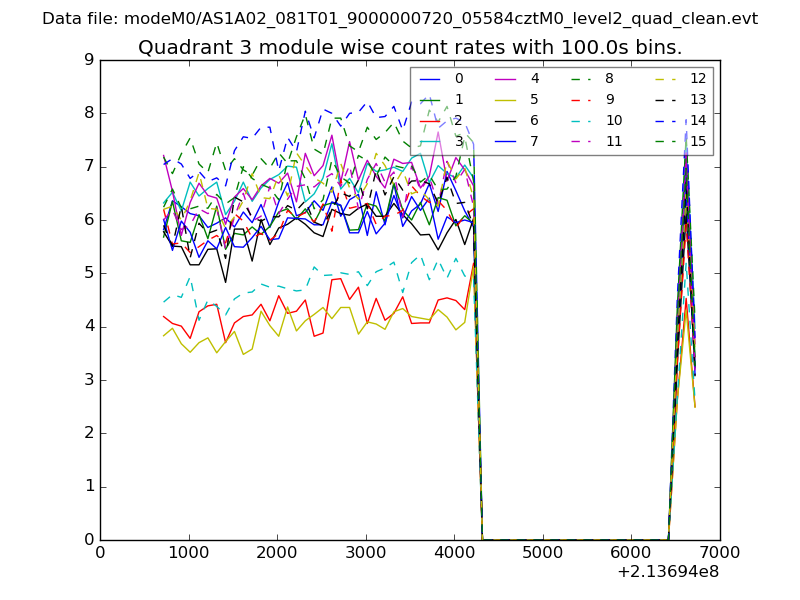
| Module-wise count rates for Quadrant A Data is divided into 100 sec bins |
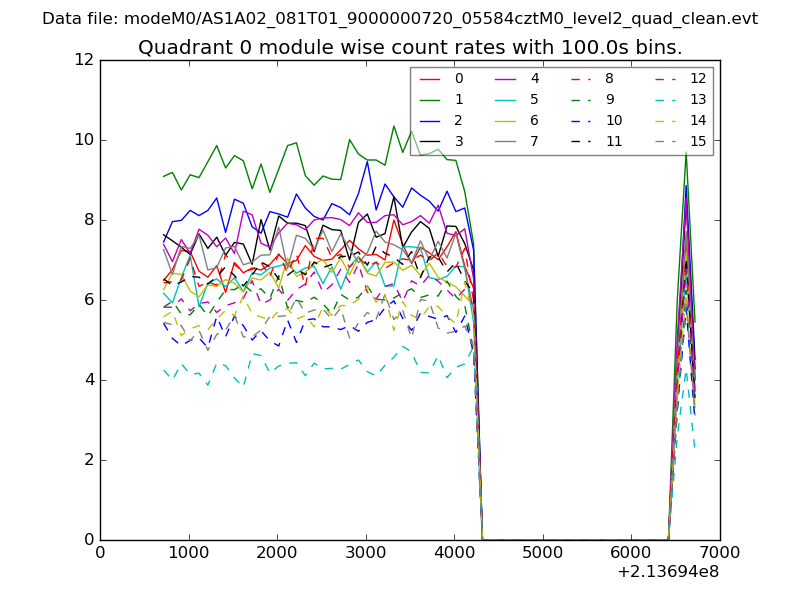 |
 |
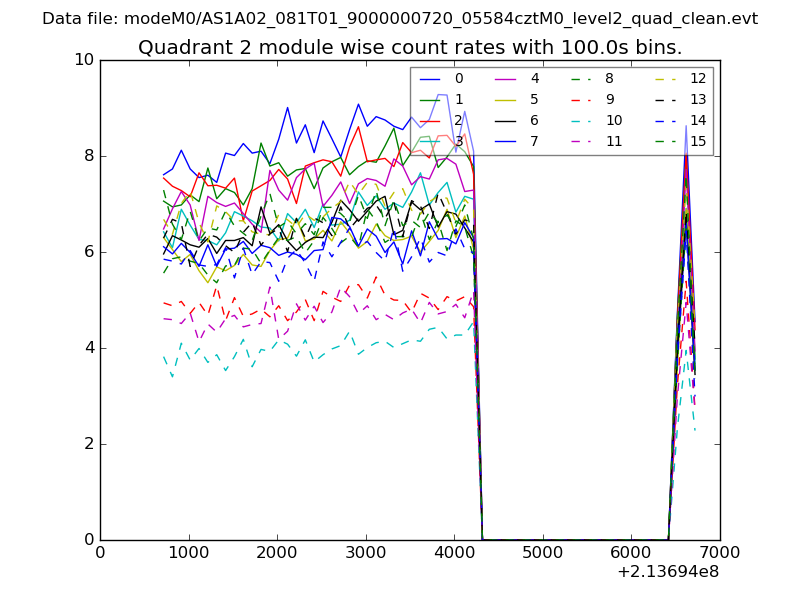
| Module-wise count rates for Quadrant B Data is divided into 100 sec bins |
 |
 |
| Module-wise count rates for Quadrant C Data is divided into 100 sec bins |
 |
 |
| Module-wise count rates for Quadrant D Data is divided into 100 sec bins |
 |
 |
| Parameter | Plot |
|---|---|
| CZT HV Monitor | 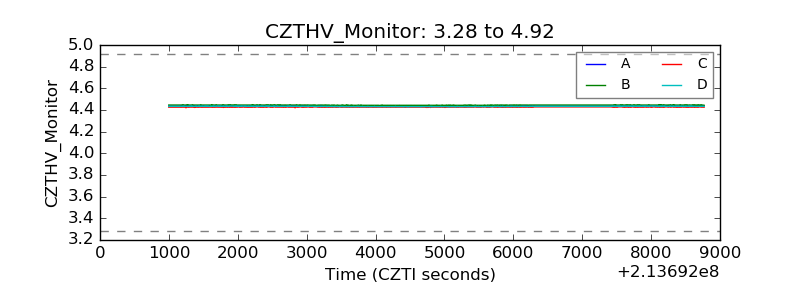 |
| D_VDD | 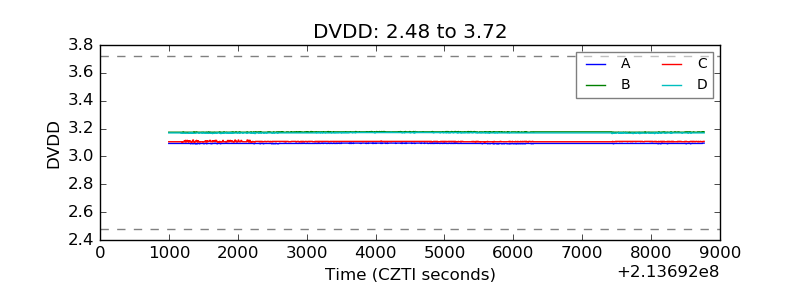 |
| Temperature 1 | 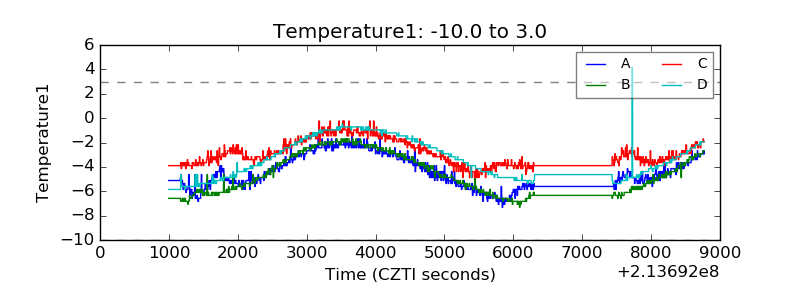 |
| Veto HV Monitor | 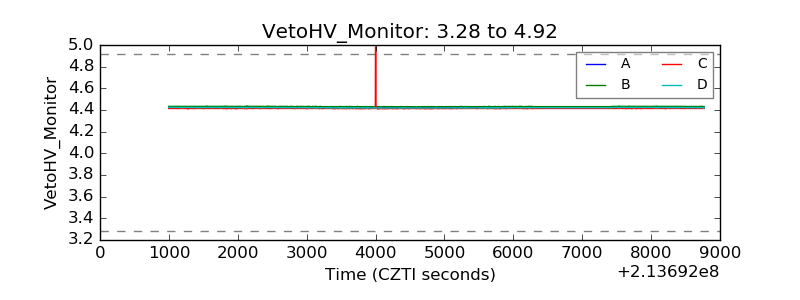 |
| Veto LLD | 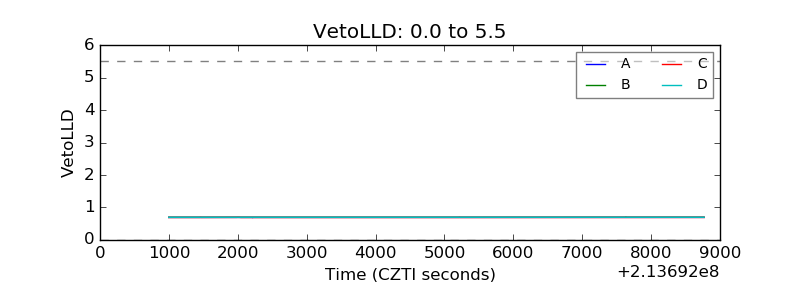 |
| Alpha Counter |  |
| _CPM_Rate | 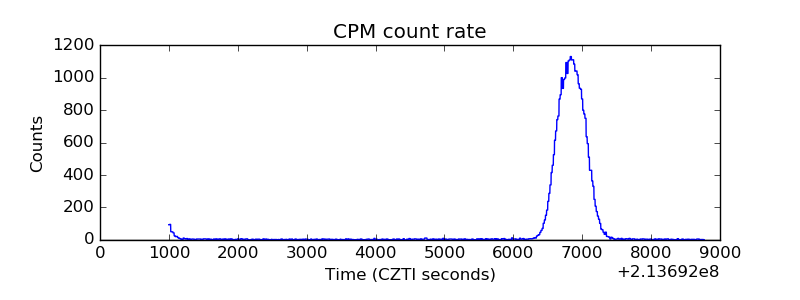 |
| CZT Counter | 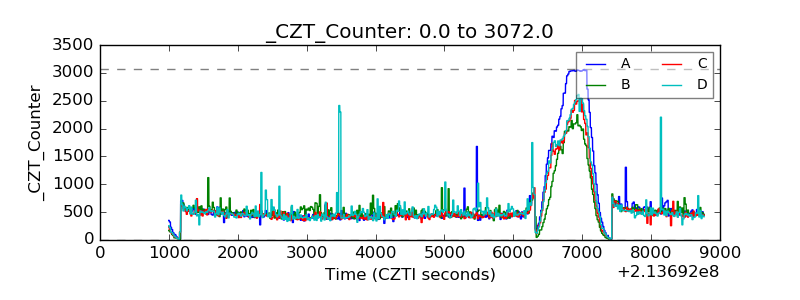 |
| +2.5 Volts monitor | 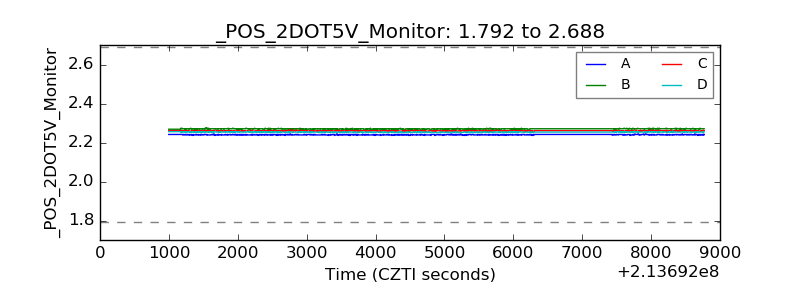 |
| +5 Volts monitor |  |
| _ROLL_ROT | 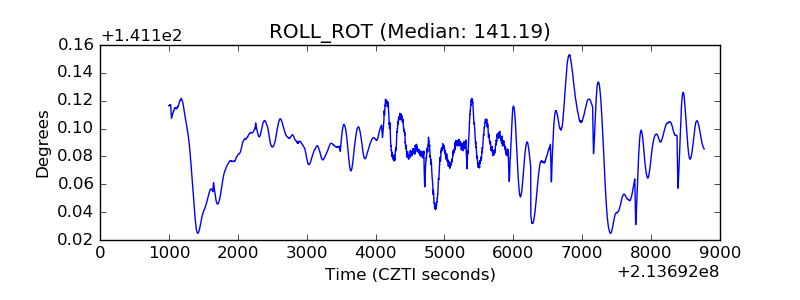 |
| _Roll_DEC | 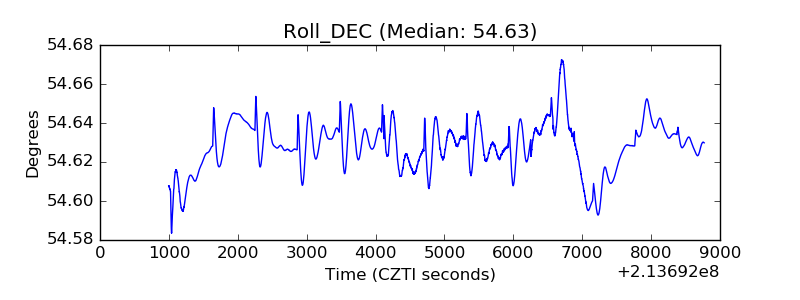 |
| _Roll_RA | 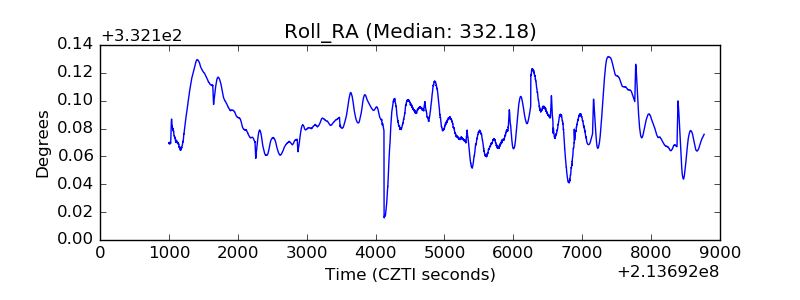 |
| Veto Counter | 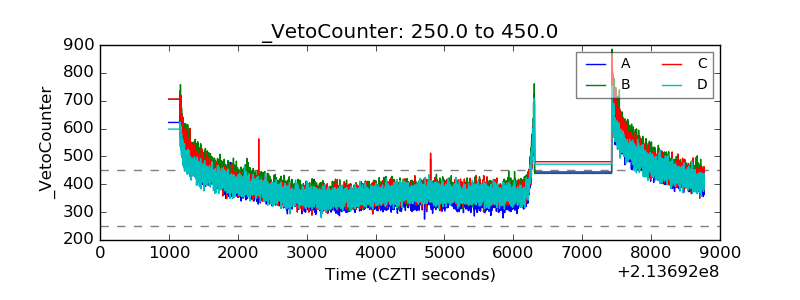 |