| Param | Original file | Final file |
|---|---|---|
| Filename | modeM0/AS1A02_081T01_9000000720_05585cztM0_level2.evt | modeM0/AS1A02_081T01_9000000720_05585cztM0_level2_quad_clean.evt |
| Size (bytes) | 467,559,360 | 84,363,840 |
| Size | 445.9 MB | 80.5 MB |
| Events in quadrant A | 3,486,287 | 535,655 |
| Events in quadrant B | 3,469,285 | 541,586 |
| Events in quadrant C | 3,189,765 | 521,246 |
| Events in quadrant D | 3,560,449 | 490,283 |
| Mode M9 | |||
|---|---|---|---|
| Quadrant | BADHDUFLAG | Total packets | Discarded packets |
| A | 0 | 23 | 0 |
| B | 0 | 23 | 0 |
| C | 0 | 23 | 0 |
| D | 0 | 23 | 0 |
| Mode SS | |||
|---|---|---|---|
| Quadrant | BADHDUFLAG | Total packets | Discarded packets |
| A | 0 | 138 | 0 |
| B | 0 | 138 | 0 |
| C | 0 | 138 | 0 |
| D | 0 | 138 | 0 |
| Mode M0 | |||
|---|---|---|---|
| Quadrant | BADHDUFLAG | Total packets | Discarded packets |
| A | 0 | 14630 | 3 |
| B | 0 | 14474 | 2 |
| C | 0 | 13863 | 2 |
| D | 0 | 14881 | 2 |
| Quadrant | Total seconds | Saturated seconds | Saturation percentage |
|---|---|---|---|
| A | 6683 | 153 | 2.289391% |
| B | 6683 | 106 | 1.586114% |
| C | 6683 | 60 | 0.897800% |
| D | 6683 | 143 | 2.139758% |
Noise dominated data is calculated using 1-second bins in cleaned event files. If a bin has >2000 counts, and if more than 50% of those come from <1% of pixels, then it is considered to be noise-dominated and hence unusable.
| Quadrant | # 1 sec bins | Bins with >0 counts | Bins with >2000 counts | High rate bins dominated by noise | Noise dominated (total time) | Noise dominated (detector-on time) | Marked lightcurve |
|---|---|---|---|---|---|---|---|
| A | 8998 | 6685 | 34 | 34 | 0.38% | 0.51% | 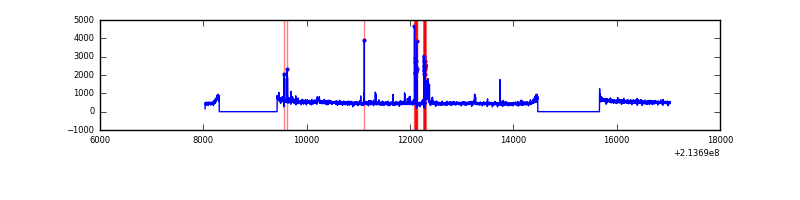 |
| B | 8998 | 6685 | 6 | 6 | 0.07% | 0.09% | 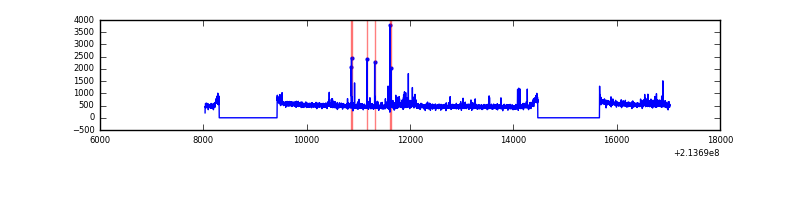 |
| C | 8998 | 6685 | 0 | 0 | 0.00% | 0.00% | 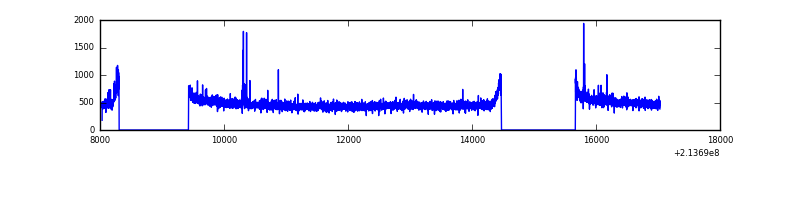 |
| D | 8998 | 6685 | 66 | 66 | 0.73% | 0.99% | 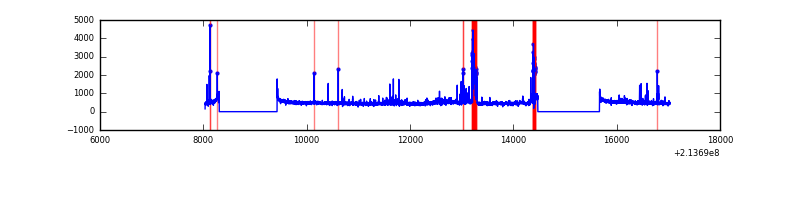 |
Top three noisy pixels from each quadrant. If the there are fewer than three noisy pixels in the level2.evt file, extra rows are filled as -1
| Pixel properties | Quadrant properties | ||||||
|---|---|---|---|---|---|---|---|
| Quadrant | DetID | PixID | Counts | Sigma | Mean | Median | Sigma |
| A | 14 | 111 | 203363 | 1197.87 | 840 | 823 | 169.1 |
| A | 0 | 149 | 27833 | 159.74 | 840 | 823 | 169.1 |
| A | 0 | 226 | 10400 | 56.64 | 840 | 823 | 169.1 |
| B | 15 | 204 | 67307 | 413.86 | 843 | 825 | 160.6 |
| B | 10 | 245 | 40121 | 244.62 | 843 | 825 | 160.6 |
| B | 0 | 214 | 28081 | 169.67 | 843 | 825 | 160.6 |
| C | 1 | 16 | 27198 | 143.47 | 802 | 808 | 183.9 |
| C | 9 | 16 | 24940 | 131.19 | 802 | 808 | 183.9 |
| C | 13 | 61 | 6554 | 31.24 | 802 | 808 | 183.9 |
| D | 2 | 33 | 229397 | 1173.13 | 802 | 778 | 194.9 |
| D | 2 | 14 | 86698 | 440.89 | 802 | 778 | 194.9 |
| D | 2 | 152 | 77855 | 395.51 | 802 | 778 | 194.9 |
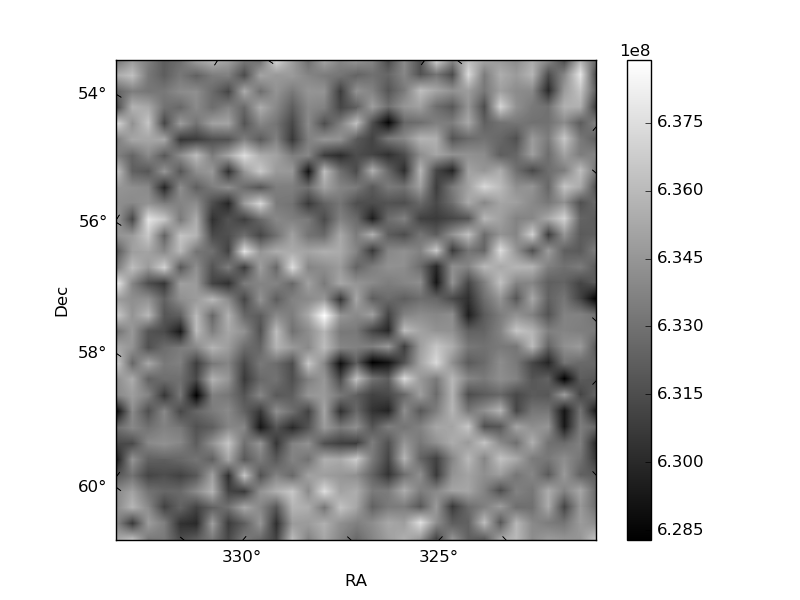
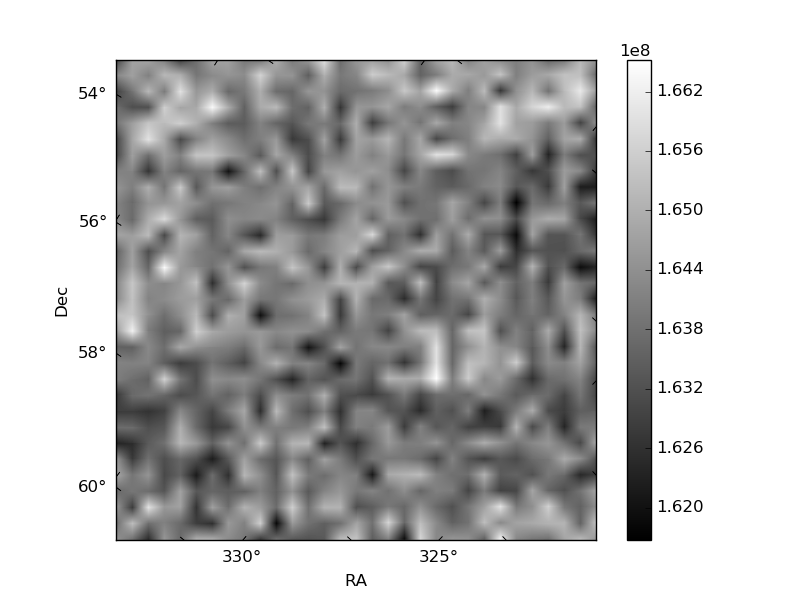
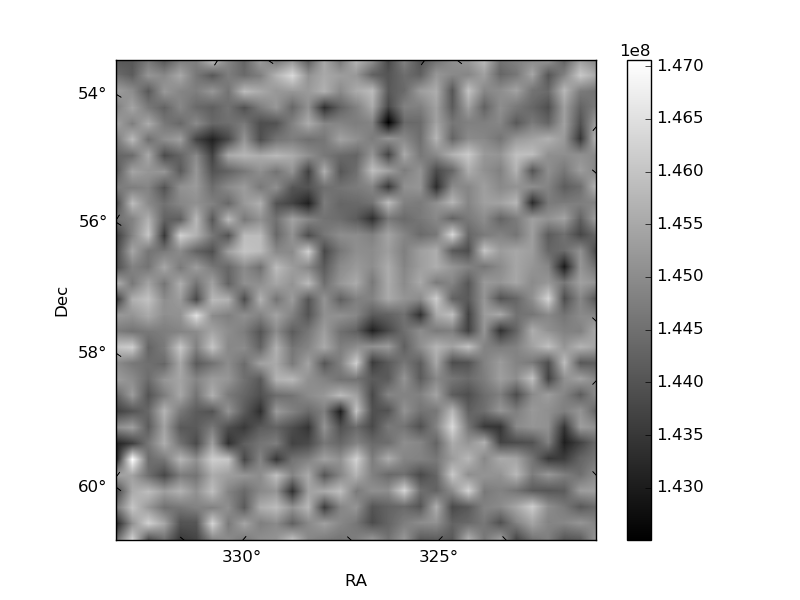
Histogram calculated using DETX and DETY for each event in the final _common_clean file
| Quadrant A | 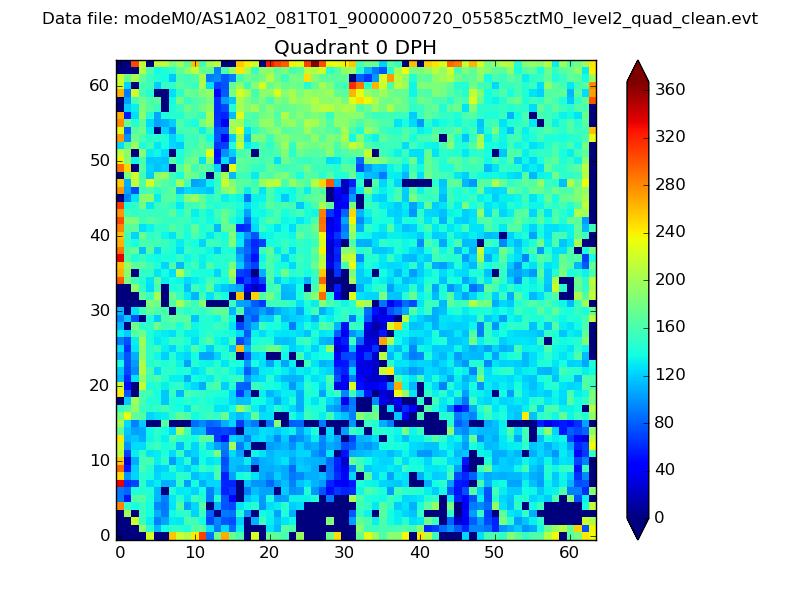 |
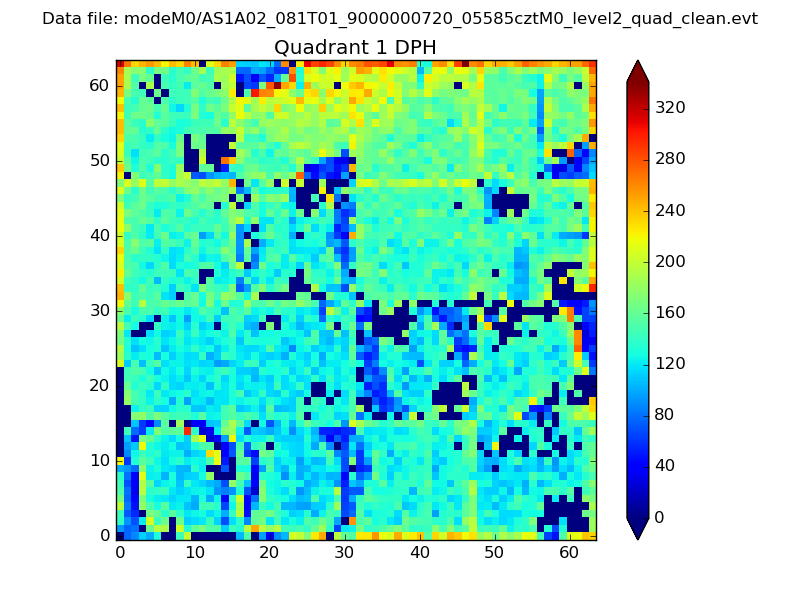 |
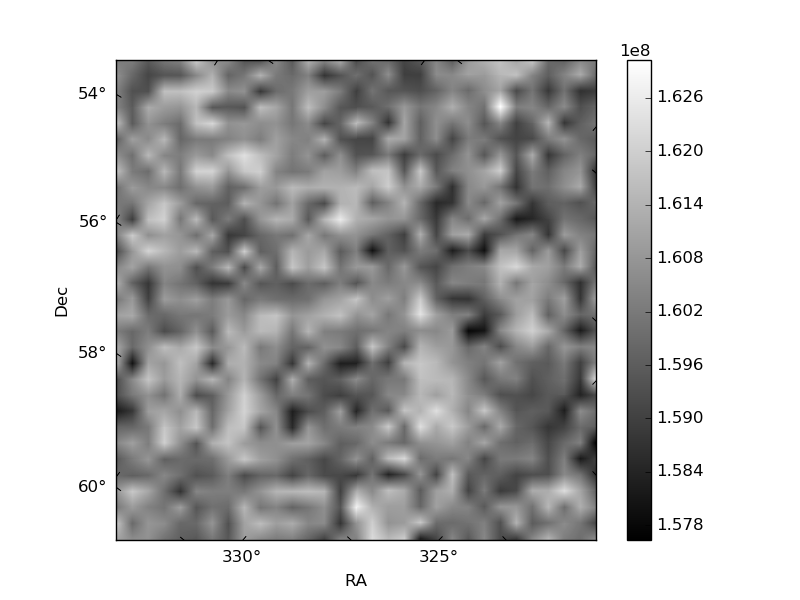
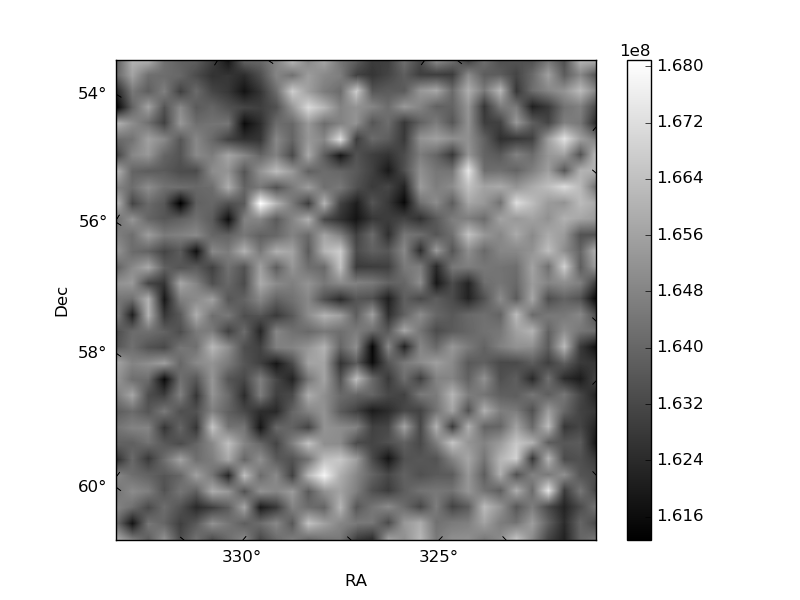
Quadrant B |
|---|---|---|---|
| Quadrant D | 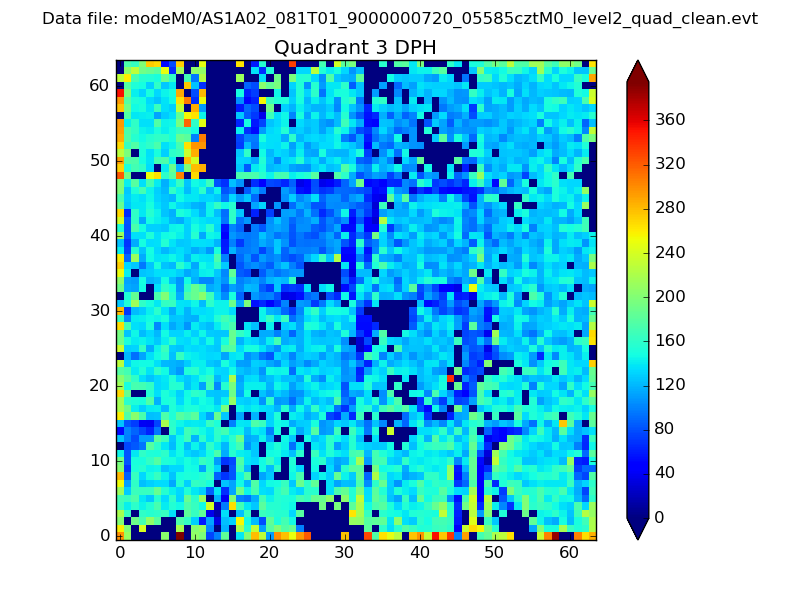 |
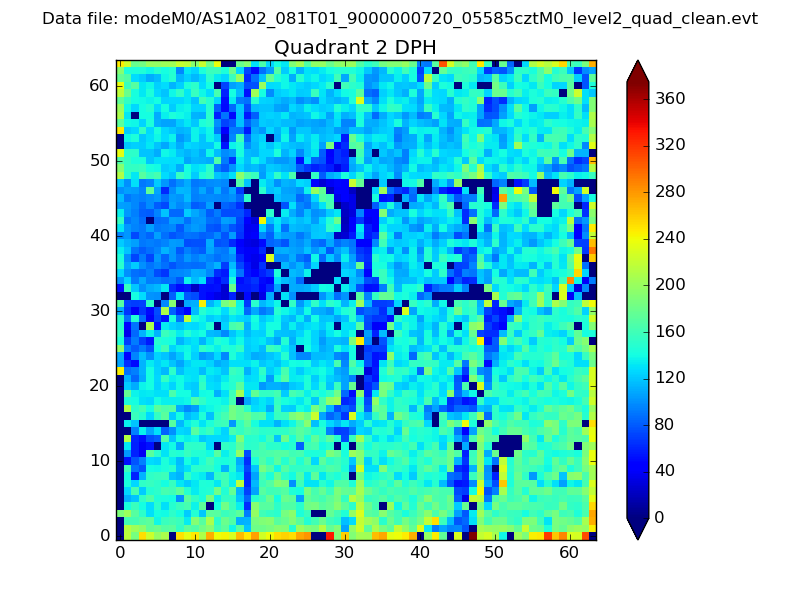 |
Quadrant C |
| Plot type | Count rate plots | Images |
|---|---|---|
| Comparison with Poisson distribution Blue bars denote a histogram of data divided into 1 sec bins. Red curve is a Poisson curve with rate = median count rate of data. |
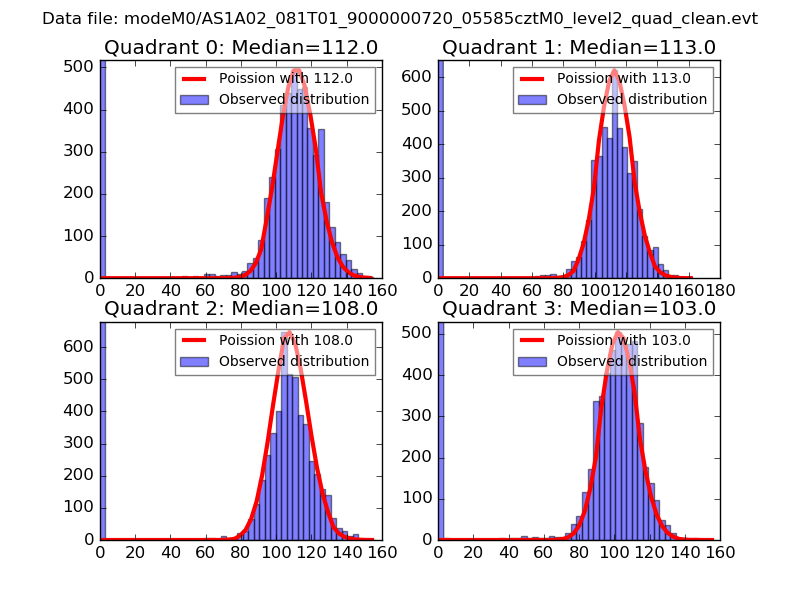 |
 |
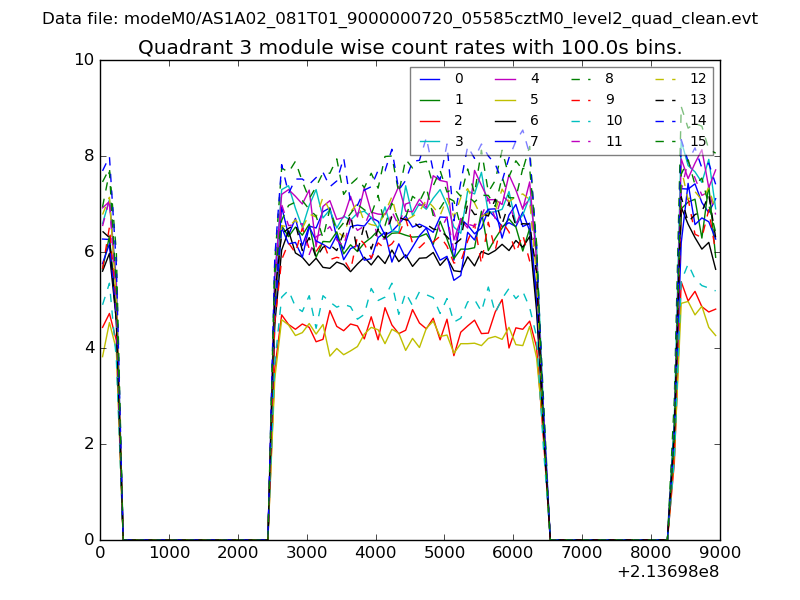
| Quadrant-wise count rates Data is divided into 100 sec bins |
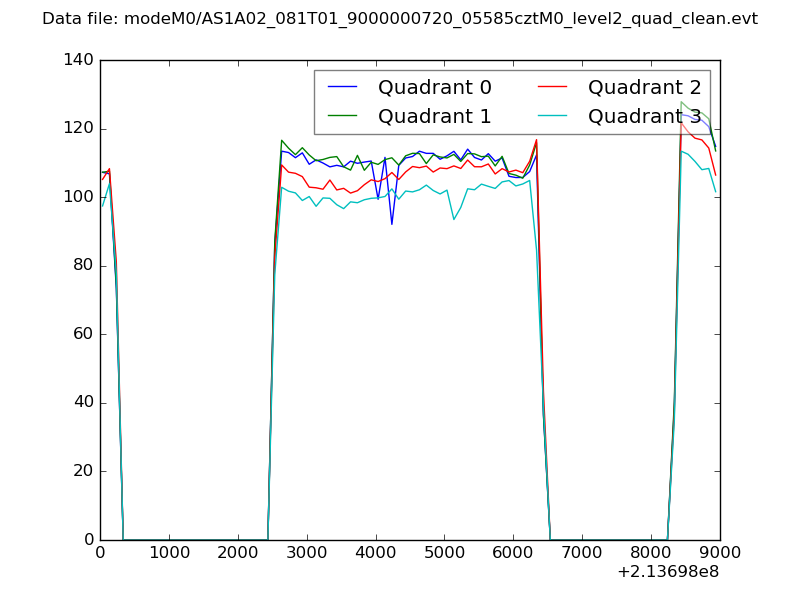 |
|
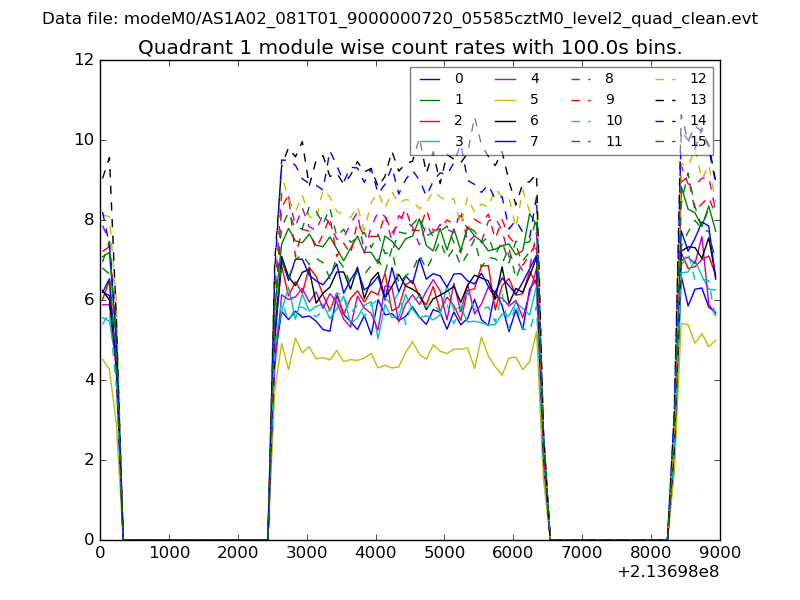
| Module-wise count rates for Quadrant A Data is divided into 100 sec bins |
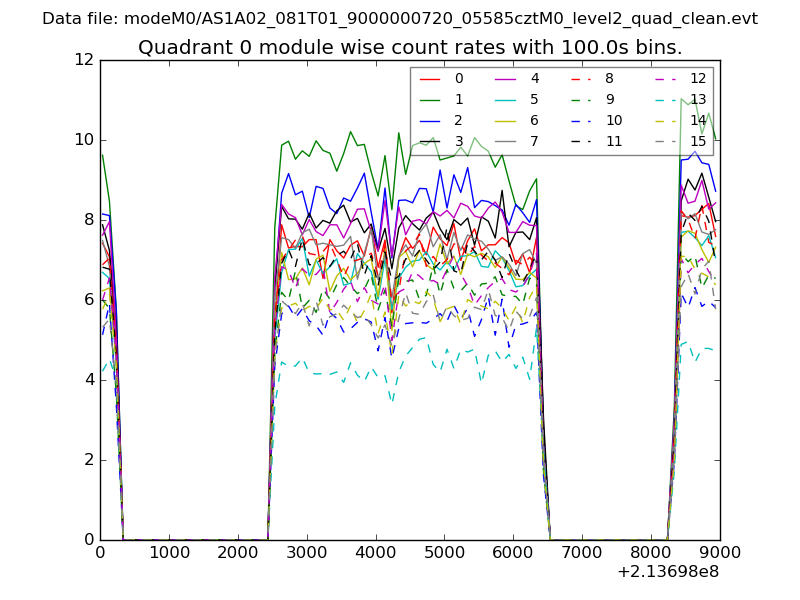 |
 |
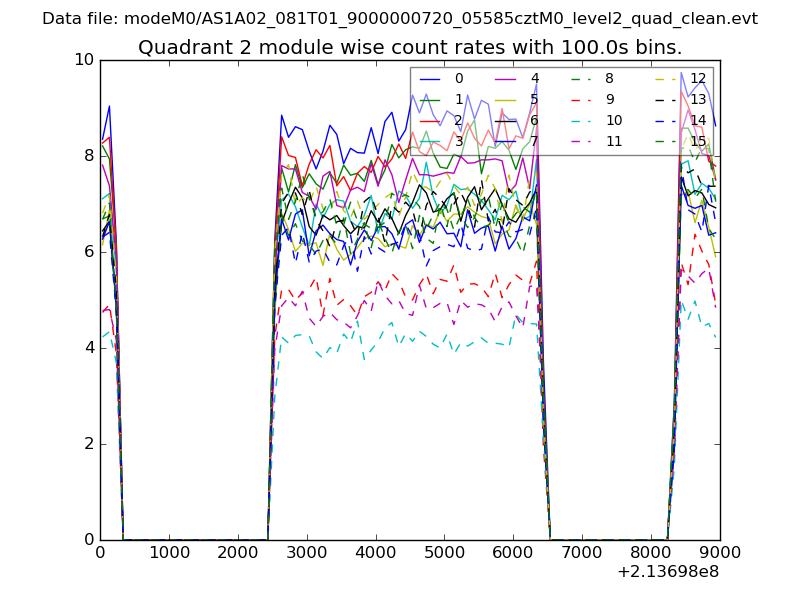
| Module-wise count rates for Quadrant B Data is divided into 100 sec bins |
 |
 |
| Module-wise count rates for Quadrant C Data is divided into 100 sec bins |
 |
 |
| Module-wise count rates for Quadrant D Data is divided into 100 sec bins |
 |
 |
| Parameter | Plot |
|---|---|
| CZT HV Monitor | 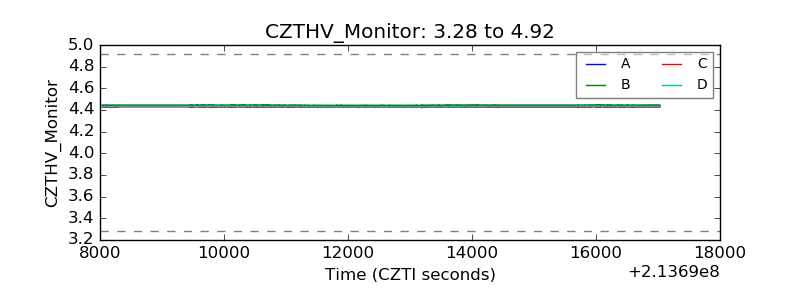 |
| D_VDD |  |
| Temperature 1 | 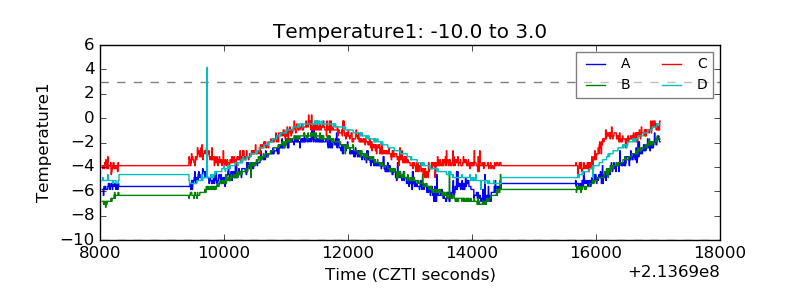 |
| Veto HV Monitor | 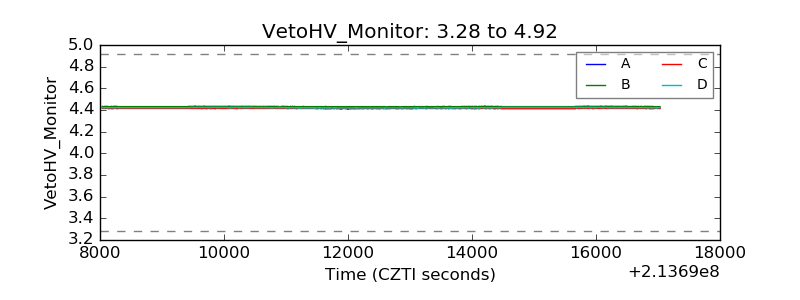 |
| Veto LLD | 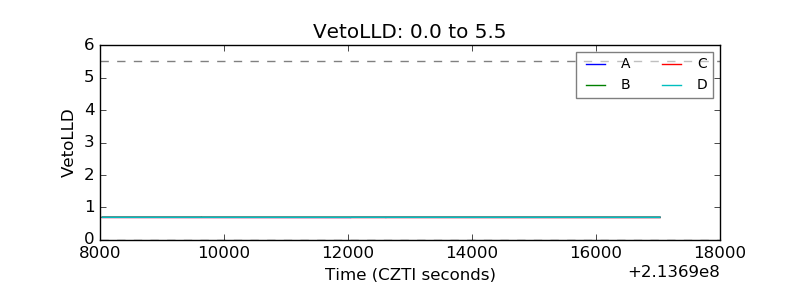 |
| Alpha Counter | 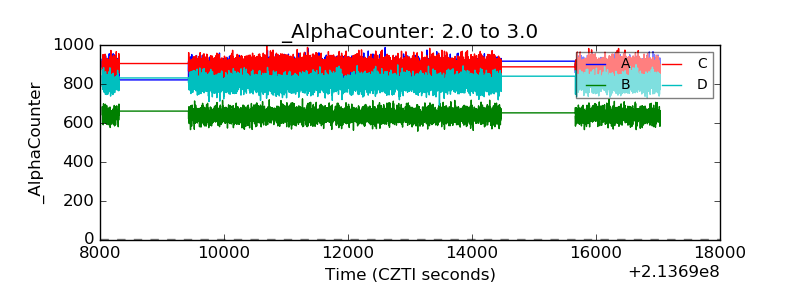 |
| _CPM_Rate | 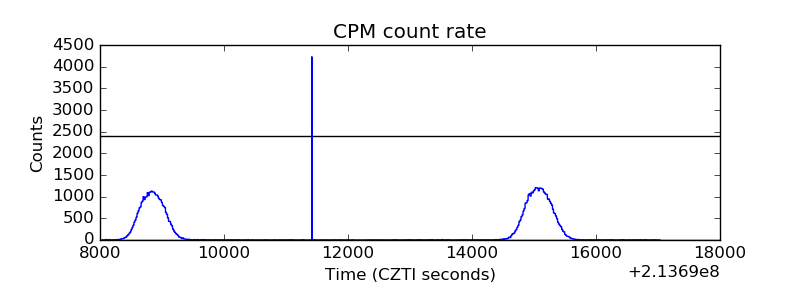 |
| CZT Counter | 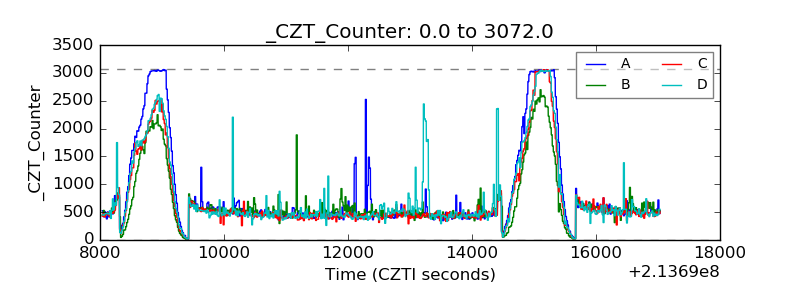 |
| +2.5 Volts monitor |  |
| +5 Volts monitor |  |
| _ROLL_ROT | 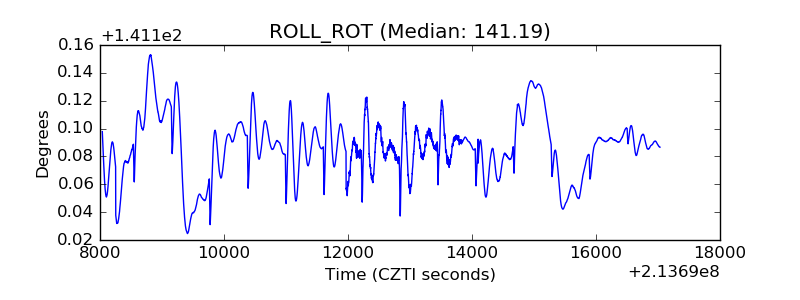 |
| _Roll_DEC | 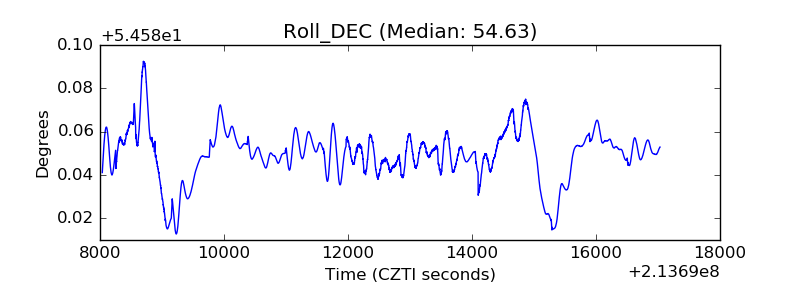 |
| _Roll_RA | 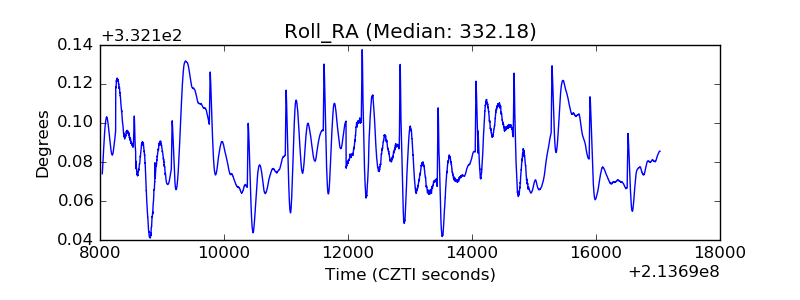 |
| Veto Counter | 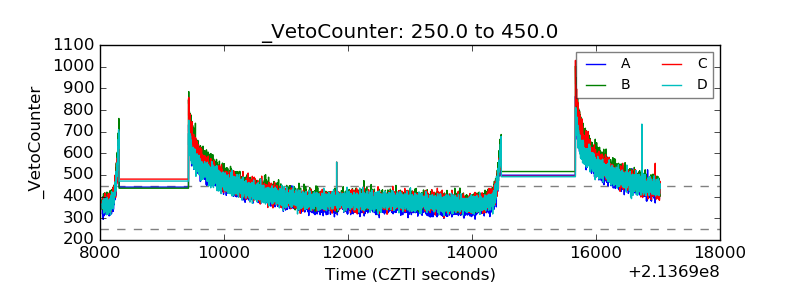 |