| Param | Original file | Final file |
|---|---|---|
| Filename | modeM0/AS1A02_081T01_9000000720_05587cztM0_level2.evt | modeM0/AS1A02_081T01_9000000720_05587cztM0_level2_quad_clean.evt |
| Size (bytes) | 436,561,920 | 93,934,080 |
| Size | 416.3 MB | 89.6 MB |
| Events in quadrant A | 2,908,440 | 626,997 |
| Events in quadrant B | 3,287,674 | 624,166 |
| Events in quadrant C | 2,824,312 | 601,309 |
| Events in quadrant D | 3,788,468 | 568,618 |
| Mode M9 | |||
|---|---|---|---|
| Quadrant | BADHDUFLAG | Total packets | Discarded packets |
| A | 0 | 12 | 0 |
| B | 0 | 12 | 0 |
| C | 0 | 12 | 0 |
| D | 0 | 12 | 0 |
| Mode SS | |||
|---|---|---|---|
| Quadrant | BADHDUFLAG | Total packets | Discarded packets |
| A | 0 | 124 | 0 |
| B | 0 | 124 | 0 |
| C | 0 | 124 | 0 |
| D | 0 | 124 | 0 |
| Mode M0 | |||
|---|---|---|---|
| Quadrant | BADHDUFLAG | Total packets | Discarded packets |
| A | 0 | 12535 | 2 |
| B | 0 | 13606 | 1 |
| C | 0 | 12420 | 1 |
| D | 0 | 15231 | 1 |
| Quadrant | Total seconds | Saturated seconds | Saturation percentage |
|---|---|---|---|
| A | 6065 | 101 | 1.665293% |
| B | 6065 | 140 | 2.308326% |
| C | 6065 | 79 | 1.302556% |
| D | 6065 | 193 | 3.182193% |
Noise dominated data is calculated using 1-second bins in cleaned event files. If a bin has >2000 counts, and if more than 50% of those come from <1% of pixels, then it is considered to be noise-dominated and hence unusable.
| Quadrant | # 1 sec bins | Bins with >0 counts | Bins with >2000 counts | High rate bins dominated by noise | Noise dominated (total time) | Noise dominated (detector-on time) | Marked lightcurve |
|---|---|---|---|---|---|---|---|
| A | 7285 | 6066 | 0 | 0 | 0.00% | 0.00% | 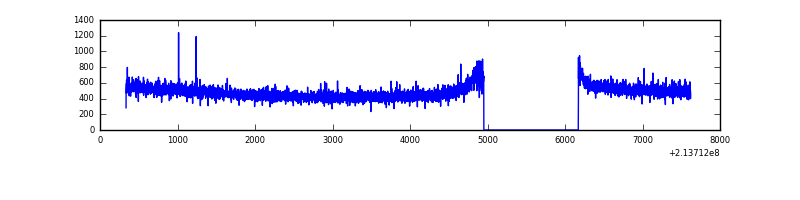 |
| B | 7285 | 6066 | 15 | 15 | 0.21% | 0.25% | 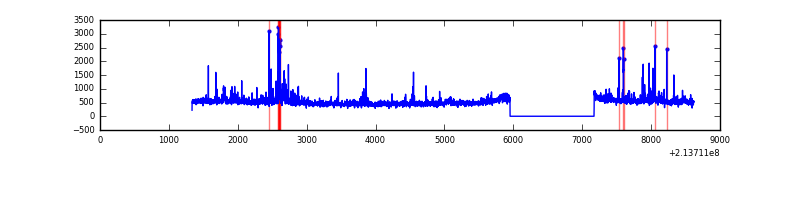 |
| C | 7285 | 6066 | 0 | 0 | 0.00% | 0.00% | 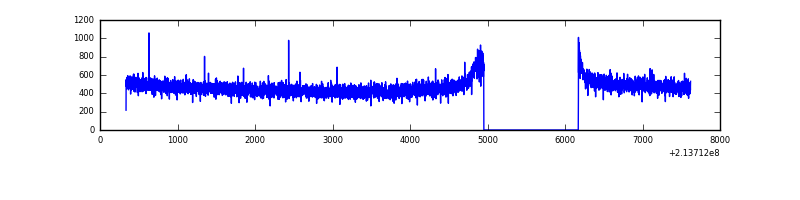 |
| D | 7285 | 6065 | 75 | 75 | 1.03% | 1.24% | 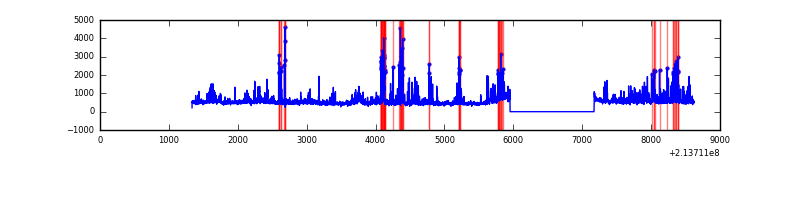 |
Top three noisy pixels from each quadrant. If the there are fewer than three noisy pixels in the level2.evt file, extra rows are filled as -1
| Pixel properties | Quadrant properties | ||||||
|---|---|---|---|---|---|---|---|
| Quadrant | DetID | PixID | Counts | Sigma | Mean | Median | Sigma |
| A | 0 | 226 | 7945 | 47.6 | 752 | 738 | 151.4 |
| A | 12 | 194 | 7441 | 44.27 | 752 | 738 | 151.4 |
| A | 0 | 149 | 5150 | 29.14 | 752 | 738 | 151.4 |
| B | 15 | 204 | 122910 | 867.45 | 747 | 732 | 140.8 |
| B | 0 | 214 | 105140 | 741.29 | 747 | 732 | 140.8 |
| B | 15 | 54 | 59360 | 416.25 | 747 | 732 | 140.8 |
| C | 13 | 61 | 5893 | 31.06 | 721 | 724 | 166.4 |
| C | 1 | 16 | 3415 | 16.17 | 721 | 724 | 166.4 |
| C | 12 | 4 | 2760 | 12.23 | 721 | 724 | 166.4 |
| D | 2 | 136 | 331184 | 1880.16 | 720 | 695 | 175.8 |
| D | 2 | 152 | 240506 | 1364.29 | 720 | 695 | 175.8 |
| D | 8 | 195 | 181829 | 1030.47 | 720 | 695 | 175.8 |
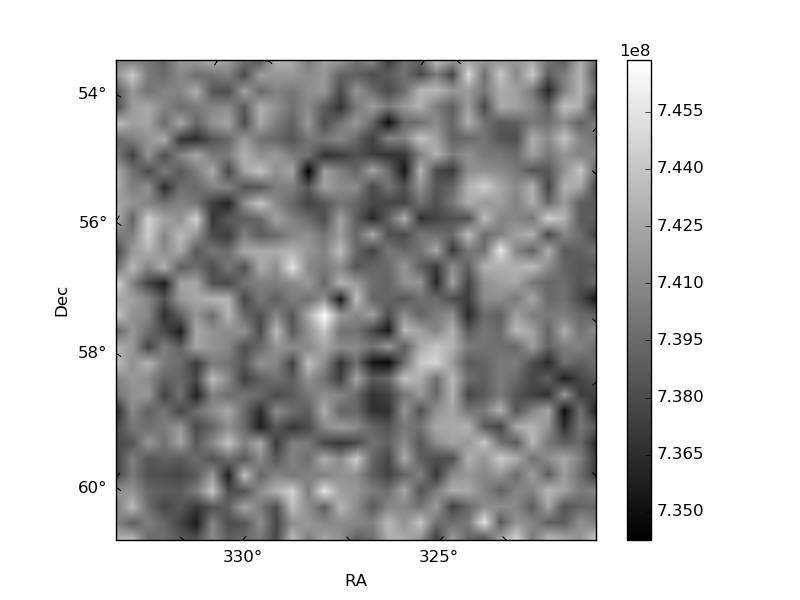
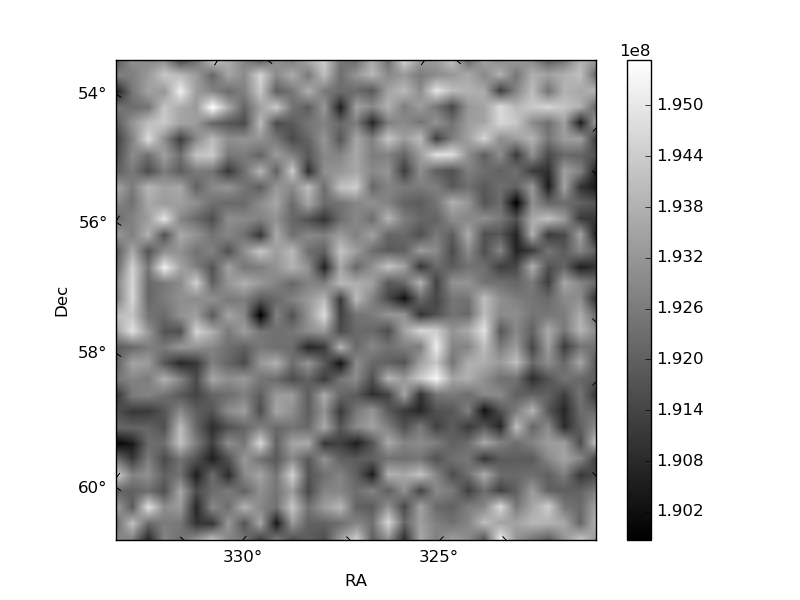
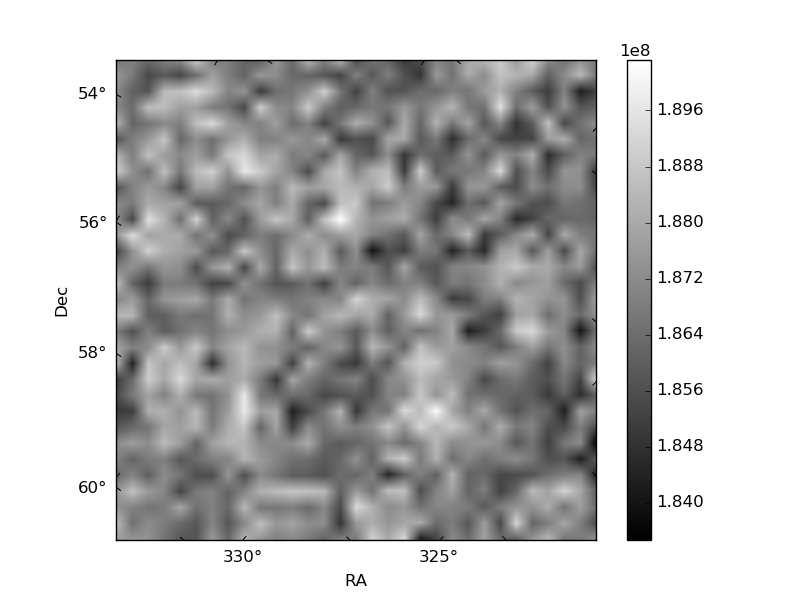
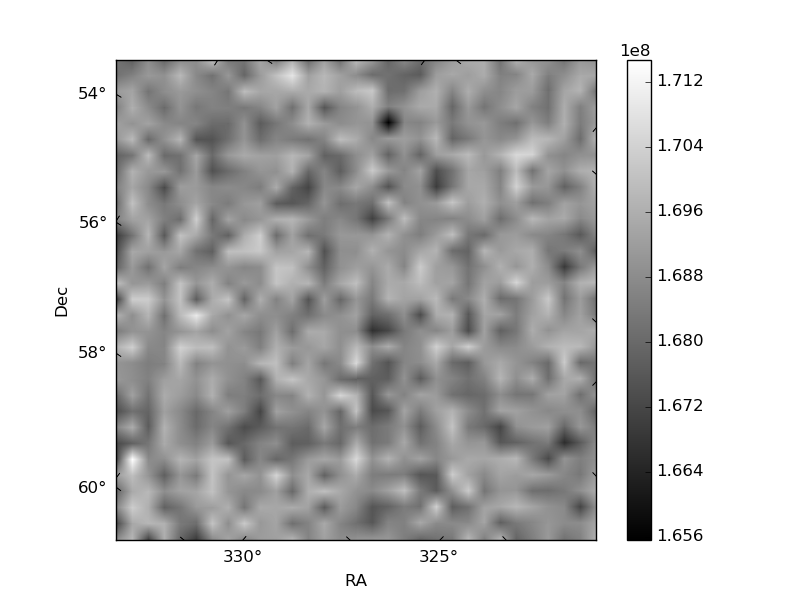
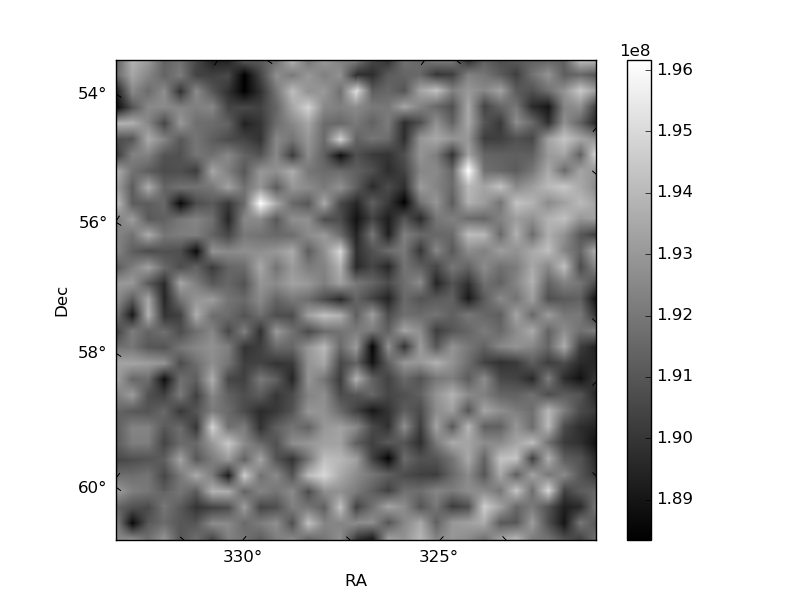
Histogram calculated using DETX and DETY for each event in the final _common_clean file
| Quadrant A | 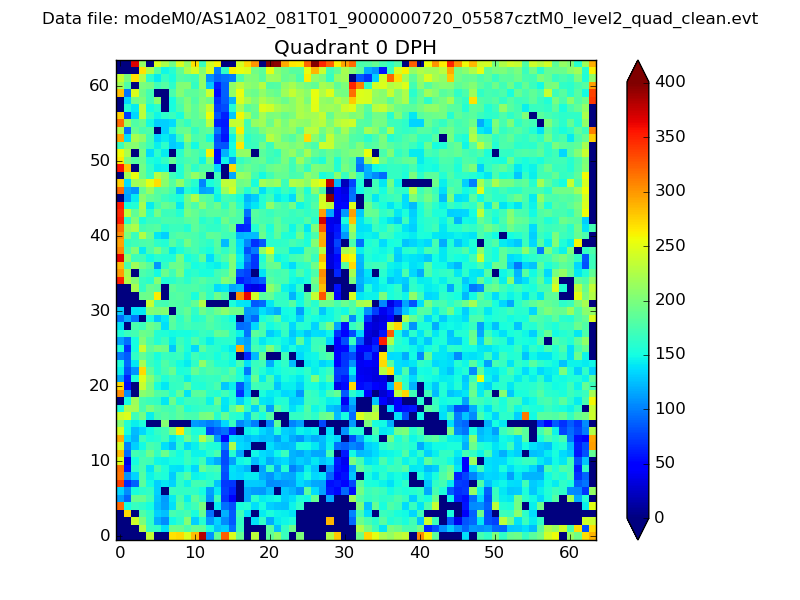 |
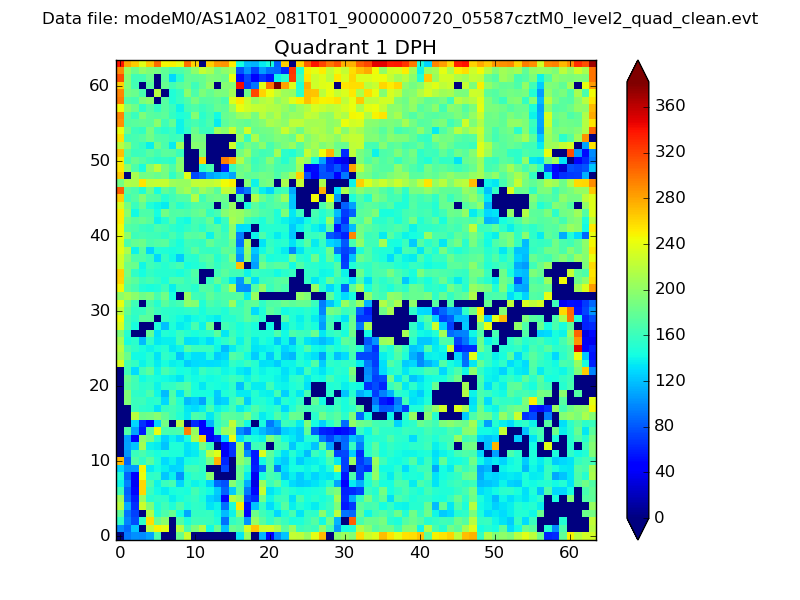 |
Quadrant B |
|---|---|---|---|
| Quadrant D | 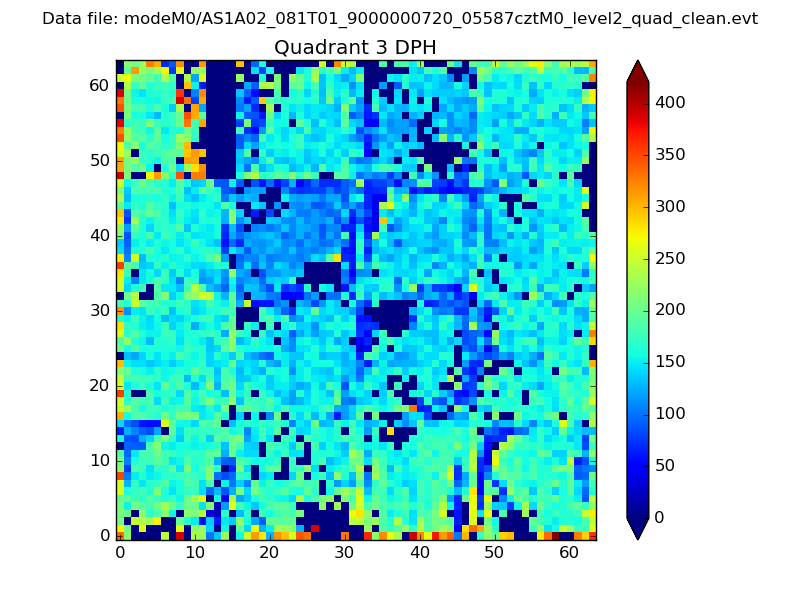 |
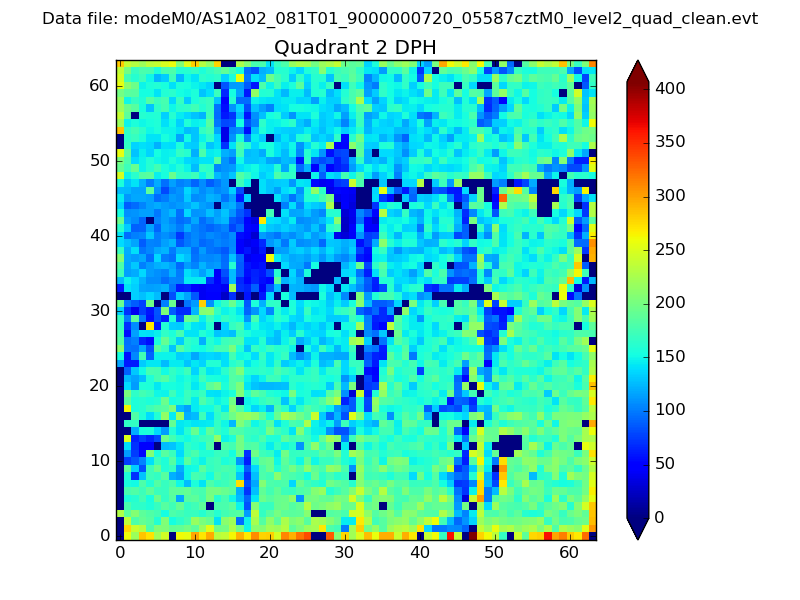 |
Quadrant C |
| Plot type | Count rate plots | Images |
|---|---|---|
| Comparison with Poisson distribution Blue bars denote a histogram of data divided into 1 sec bins. Red curve is a Poisson curve with rate = median count rate of data. |
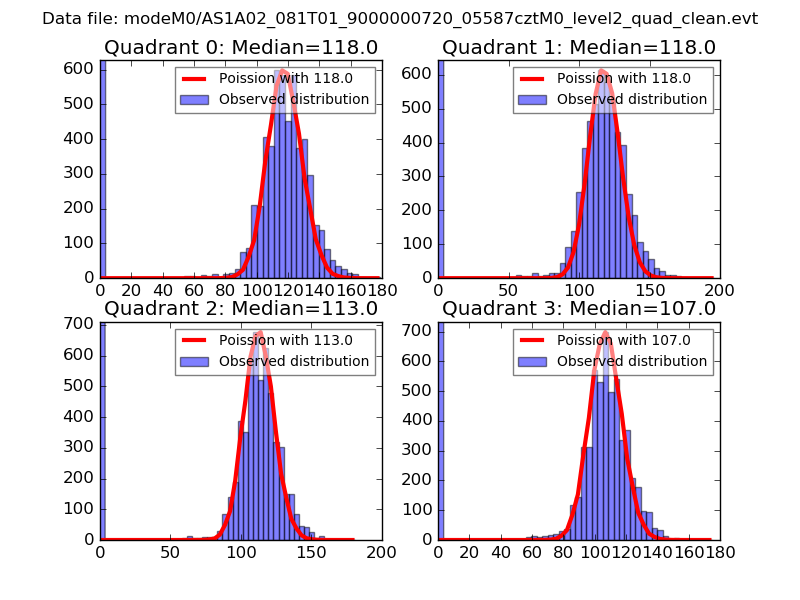 |
 |
| Quadrant-wise count rates Data is divided into 100 sec bins |
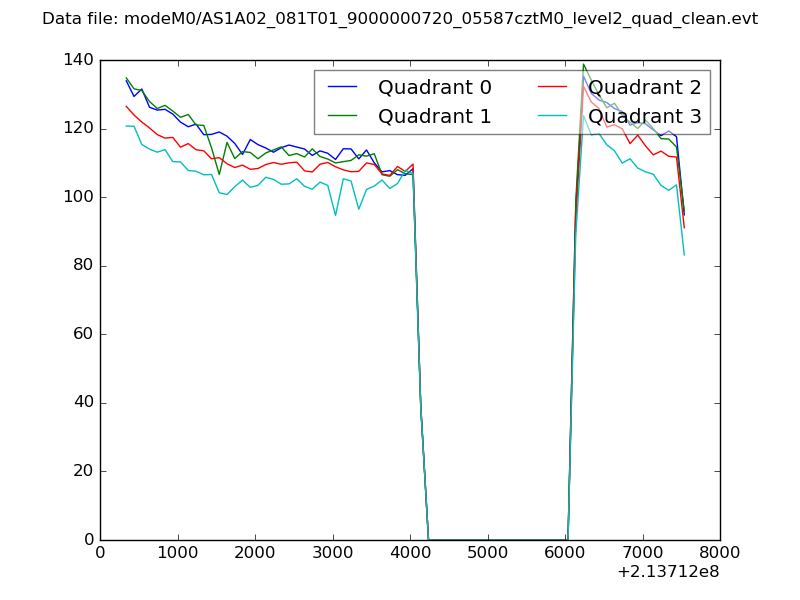 |
|
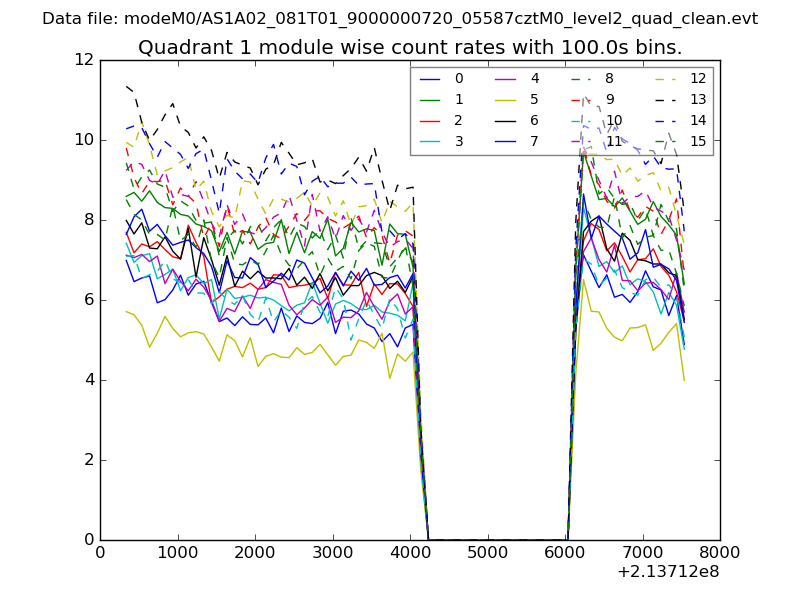
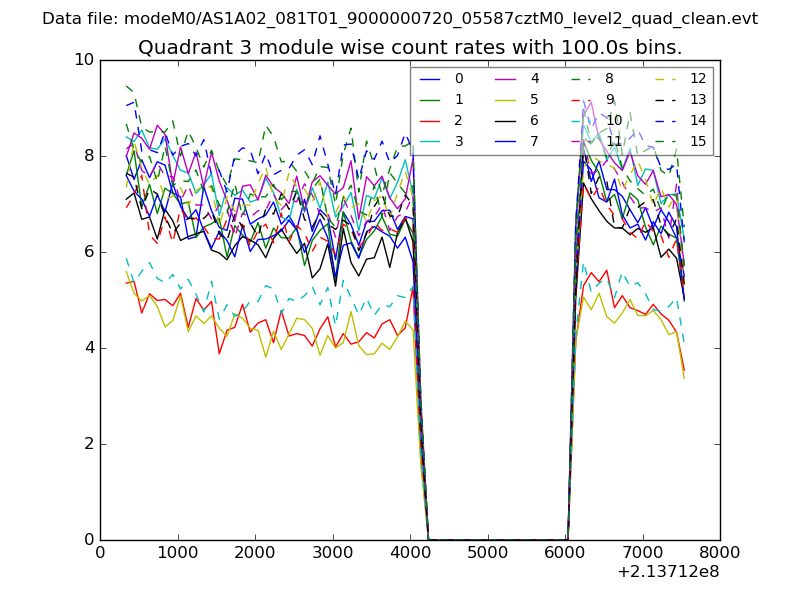
| Module-wise count rates for Quadrant A Data is divided into 100 sec bins |
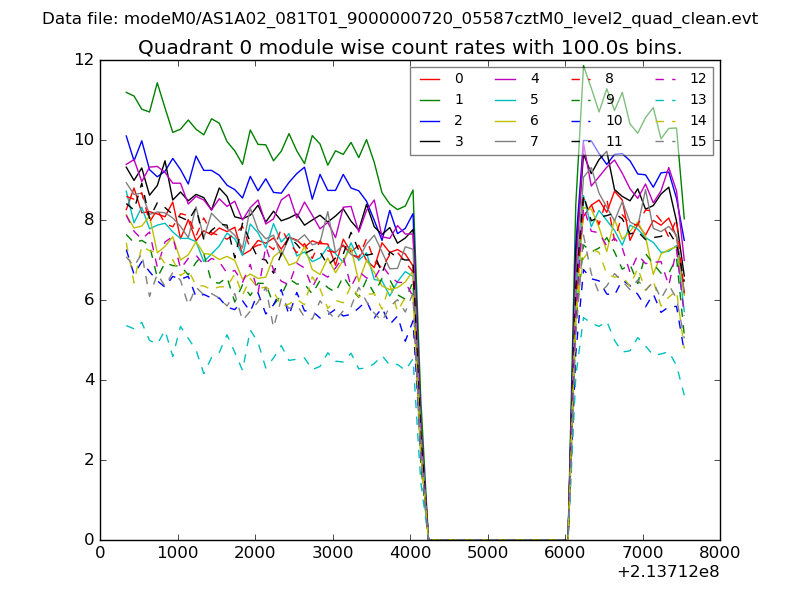 |
 |
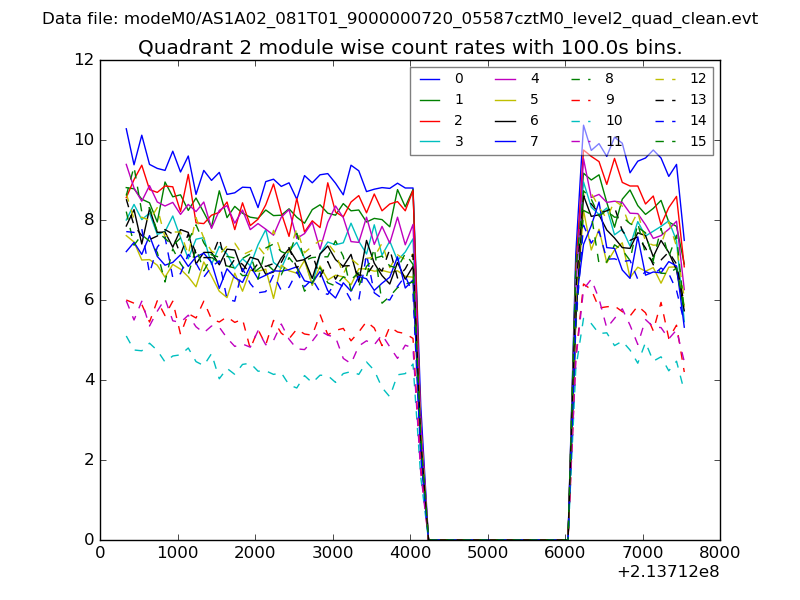
| Module-wise count rates for Quadrant B Data is divided into 100 sec bins |
 |
 |
| Module-wise count rates for Quadrant C Data is divided into 100 sec bins |
 |
 |
| Module-wise count rates for Quadrant D Data is divided into 100 sec bins |
 |
 |
| Parameter | Plot |
|---|---|
| CZT HV Monitor | 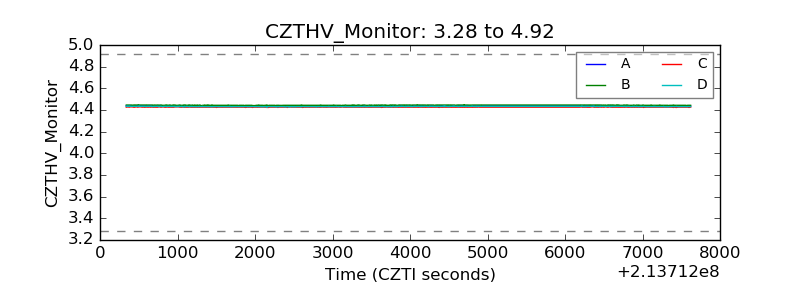 |
| D_VDD | 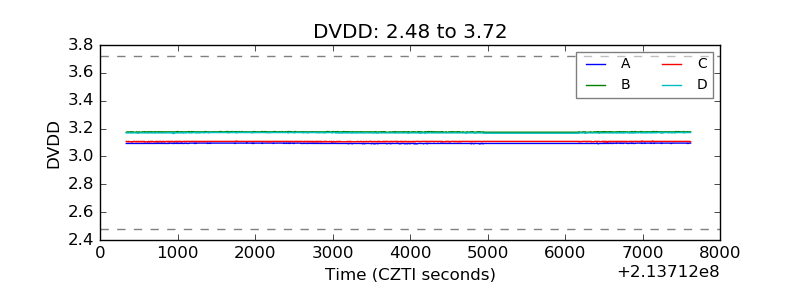 |
| Temperature 1 | 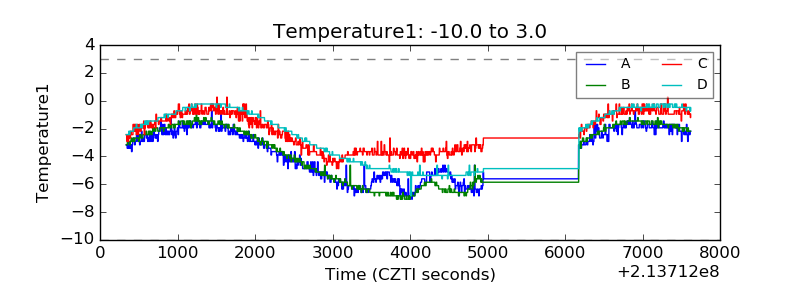 |
| Veto HV Monitor | 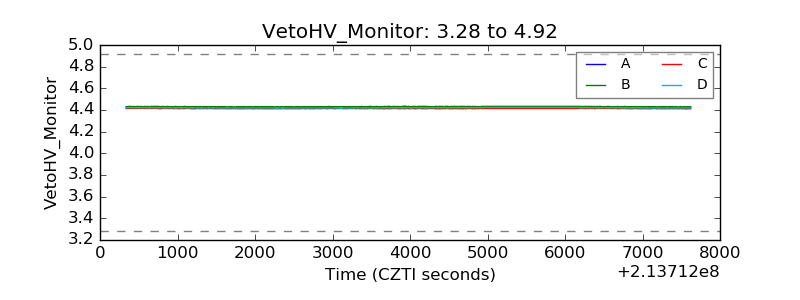 |
| Veto LLD | 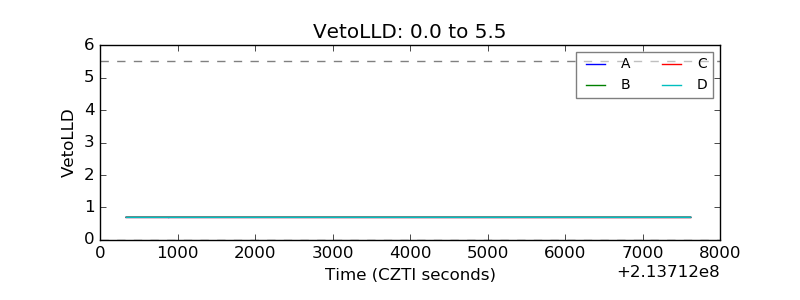 |
| Alpha Counter | 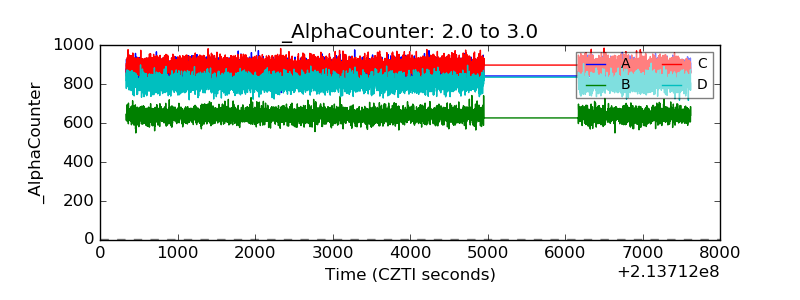 |
| _CPM_Rate |  |
| CZT Counter | 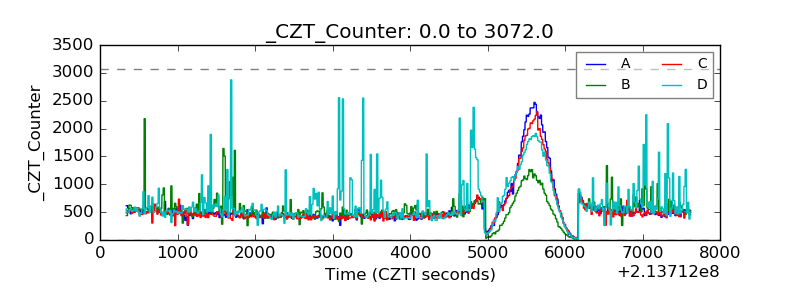 |
| +2.5 Volts monitor |  |
| +5 Volts monitor |  |
| _ROLL_ROT | 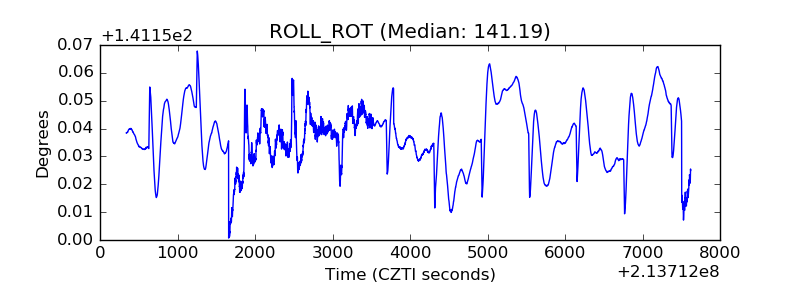 |
| _Roll_DEC | 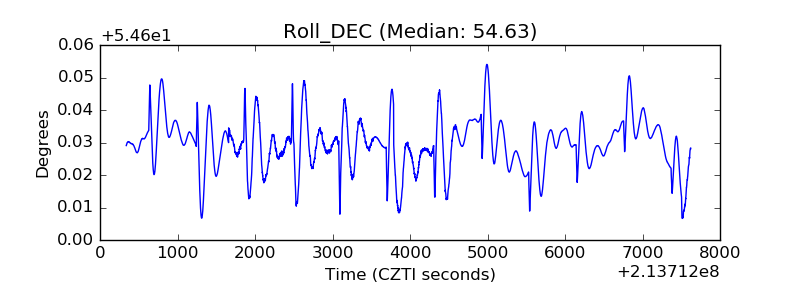 |
| _Roll_RA | 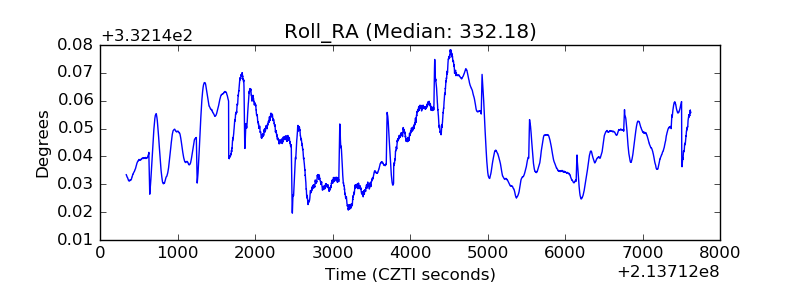 |
| Veto Counter | 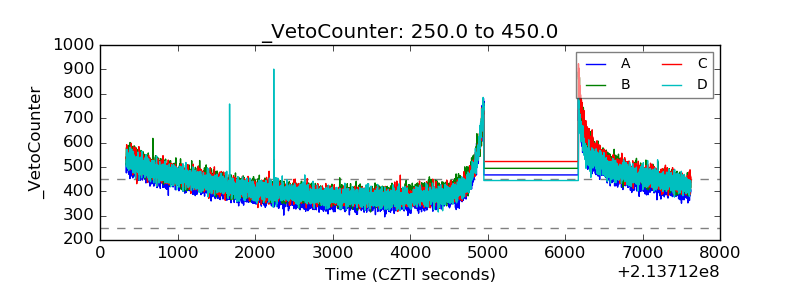 |