| Param | Original file | Final file |
|---|---|---|
| Filename | modeM0/AS1A02_081T01_9000000720_05588cztM0_level2.evt | modeM0/AS1A02_081T01_9000000720_05588cztM0_level2_quad_clean.evt |
| Size (bytes) | 501,552,000 | 80,933,760 |
| Size | 478.3 MB | 77.2 MB |
| Events in quadrant A | 2,813,649 | 546,468 |
| Events in quadrant B | 3,107,832 | 543,455 |
| Events in quadrant C | 2,753,900 | 527,631 |
| Events in quadrant D | 6,101,632 | 408,706 |
| Mode M9 | |||
|---|---|---|---|
| Quadrant | BADHDUFLAG | Total packets | Discarded packets |
| A | 0 | 12 | 0 |
| B | 0 | 12 | 0 |
| C | 0 | 12 | 0 |
| D | 0 | 12 | 0 |
| Mode SS | |||
|---|---|---|---|
| Quadrant | BADHDUFLAG | Total packets | Discarded packets |
| A | 0 | 122 | 0 |
| B | 0 | 122 | 0 |
| C | 0 | 122 | 0 |
| D | 0 | 122 | 0 |
| Mode M0 | |||
|---|---|---|---|
| Quadrant | BADHDUFLAG | Total packets | Discarded packets |
| A | 0 | 12496 | 2 |
| B | 0 | 13120 | 1 |
| C | 0 | 12397 | 1 |
| D | 0 | 22406 | 1 |
| Quadrant | Total seconds | Saturated seconds | Saturation percentage |
|---|---|---|---|
| A | 6074 | 68 | 1.119526% |
| B | 6074 | 72 | 1.185380% |
| C | 6074 | 57 | 0.938426% |
| D | 6074 | 1513 | 24.909450% |
Noise dominated data is calculated using 1-second bins in cleaned event files. If a bin has >2000 counts, and if more than 50% of those come from <1% of pixels, then it is considered to be noise-dominated and hence unusable.
| Quadrant | # 1 sec bins | Bins with >0 counts | Bins with >2000 counts | High rate bins dominated by noise | Noise dominated (total time) | Noise dominated (detector-on time) | Marked lightcurve |
|---|---|---|---|---|---|---|---|
| A | 7219 | 6076 | 1 | 1 | 0.01% | 0.02% | 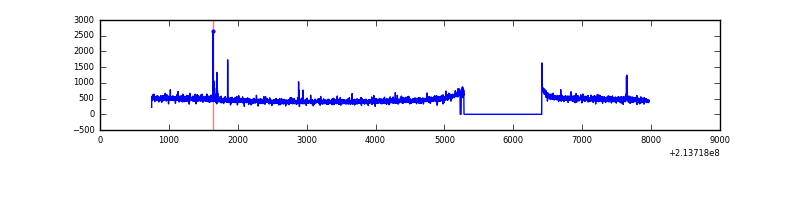 |
| B | 7219 | 6076 | 8 | 8 | 0.11% | 0.13% | 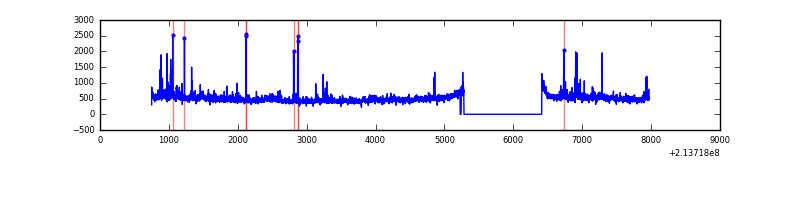 |
| C | 7219 | 6076 | 0 | 0 | 0.00% | 0.00% | 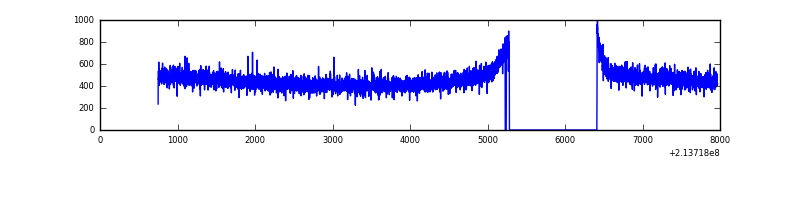 |
| D | 7219 | 6076 | 1223 | 1223 | 16.94% | 20.13% | 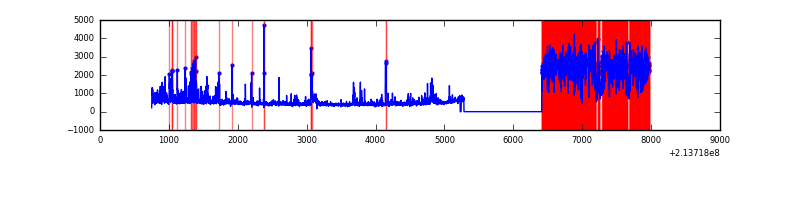 |
Top three noisy pixels from each quadrant. If the there are fewer than three noisy pixels in the level2.evt file, extra rows are filled as -1
| Pixel properties | Quadrant properties | ||||||
|---|---|---|---|---|---|---|---|
| Quadrant | DetID | PixID | Counts | Sigma | Mean | Median | Sigma |
| A | 0 | 50 | 23782 | 157.9 | 721 | 705 | 146.1 |
| A | 12 | 194 | 7182 | 44.32 | 721 | 705 | 146.1 |
| A | 0 | 226 | 7154 | 44.13 | 721 | 705 | 146.1 |
| B | 0 | 214 | 74009 | 532.78 | 726 | 709 | 137.6 |
| B | 15 | 204 | 62692 | 450.53 | 726 | 709 | 137.6 |
| B | 10 | 245 | 47242 | 338.23 | 726 | 709 | 137.6 |
| C | 13 | 61 | 5598 | 30.03 | 703 | 706 | 162.9 |
| C | 1 | 16 | 5147 | 27.26 | 703 | 706 | 162.9 |
| C | 8 | 222 | 2857 | 13.2 | 703 | 706 | 162.9 |
| D | 2 | 63 | 3126894 | 21194.73 | 607 | 589 | 147.5 |
| D | 2 | 136 | 206105 | 1393.29 | 607 | 589 | 147.5 |
| D | 10 | 15 | 143830 | 971.1 | 607 | 589 | 147.5 |
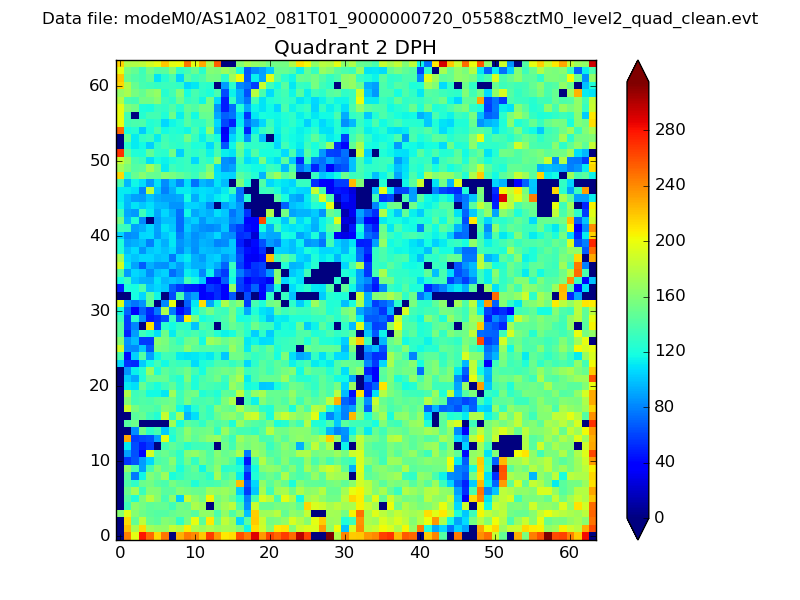
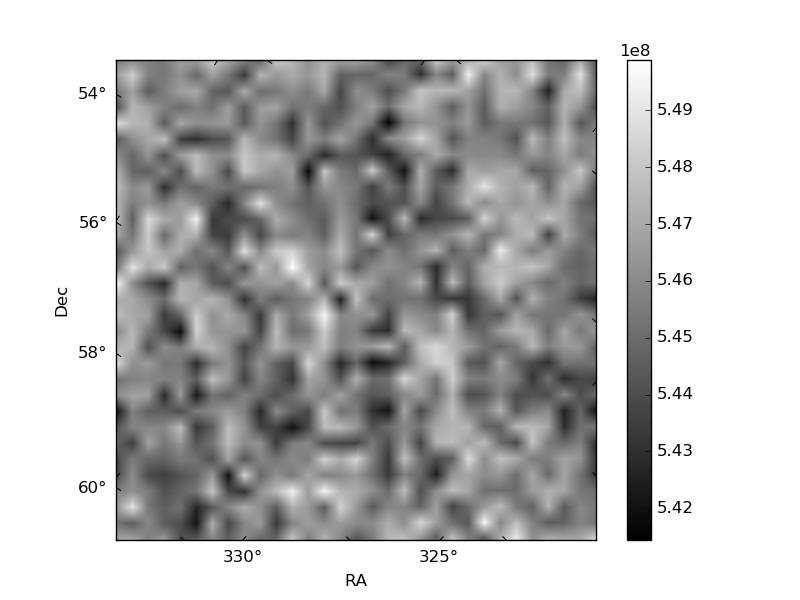
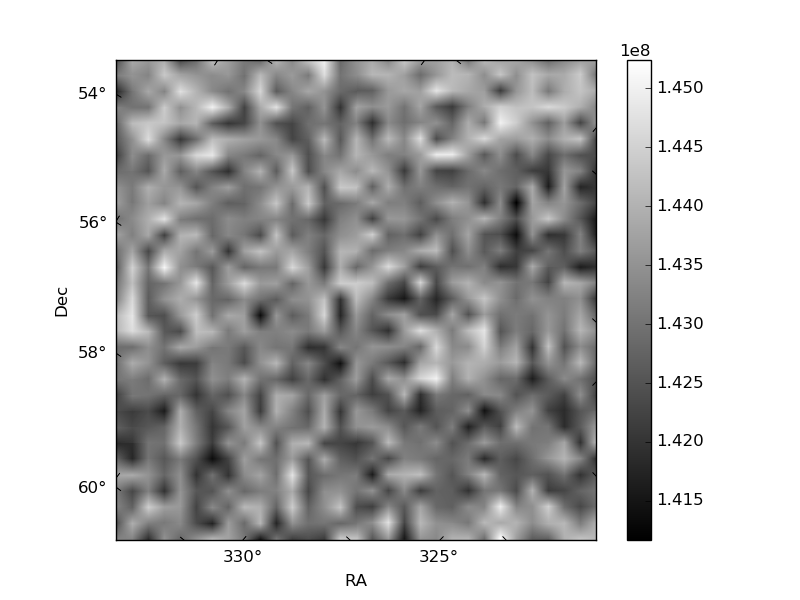
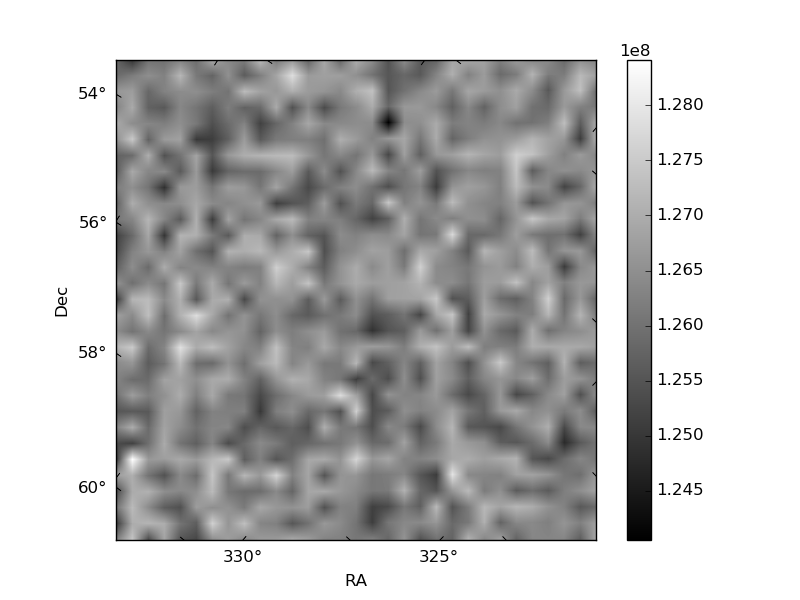
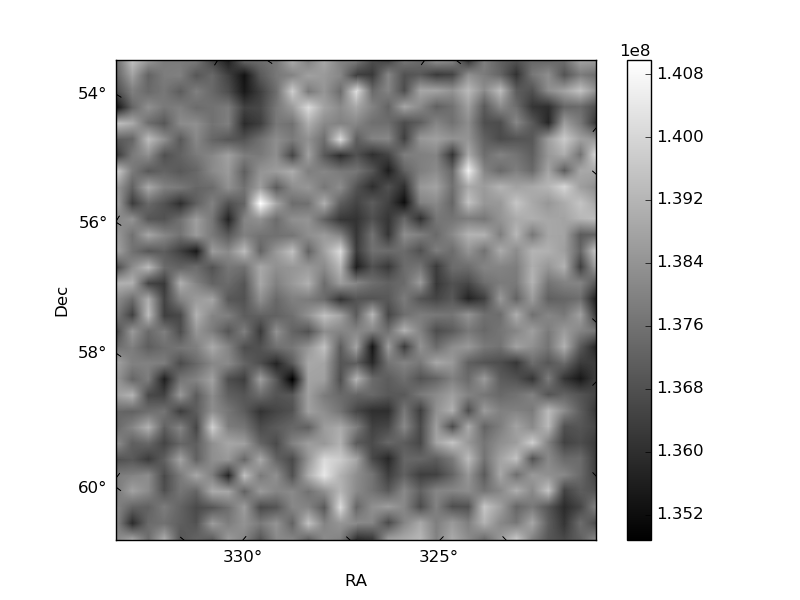
Histogram calculated using DETX and DETY for each event in the final _common_clean file
| Quadrant A | 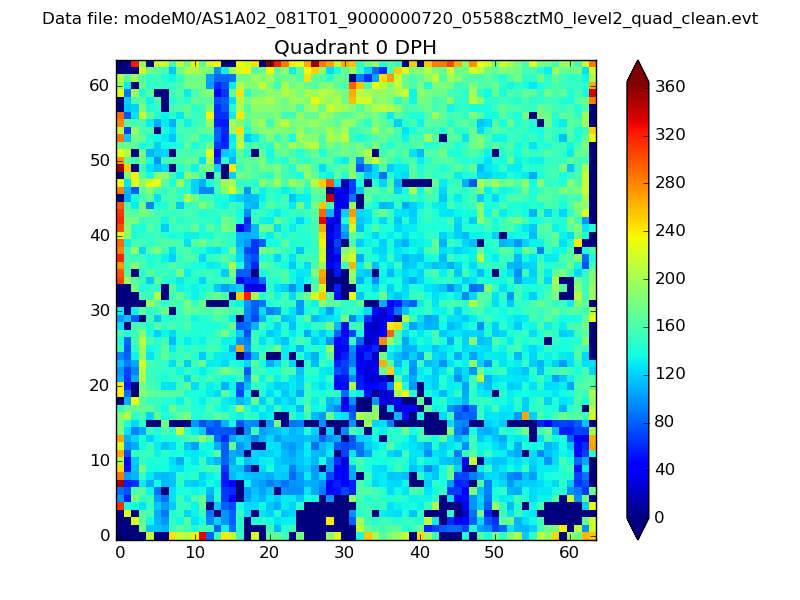 |
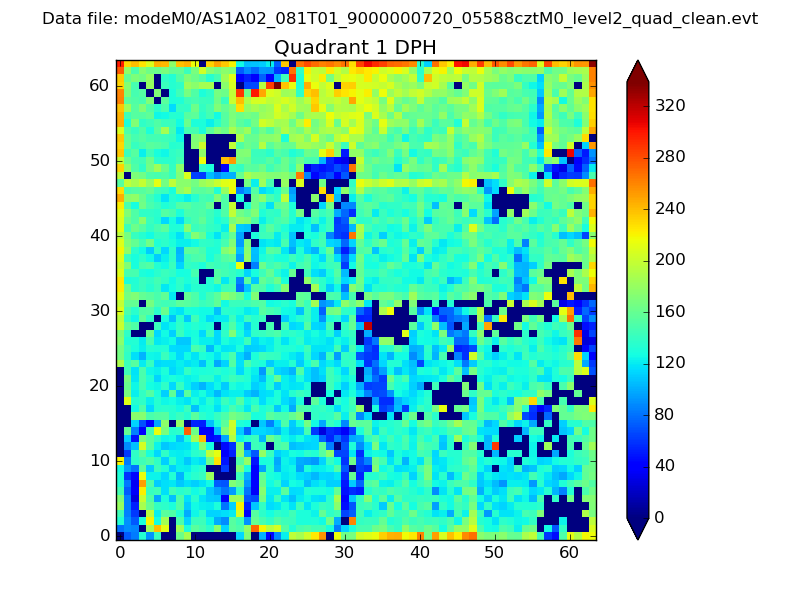 |
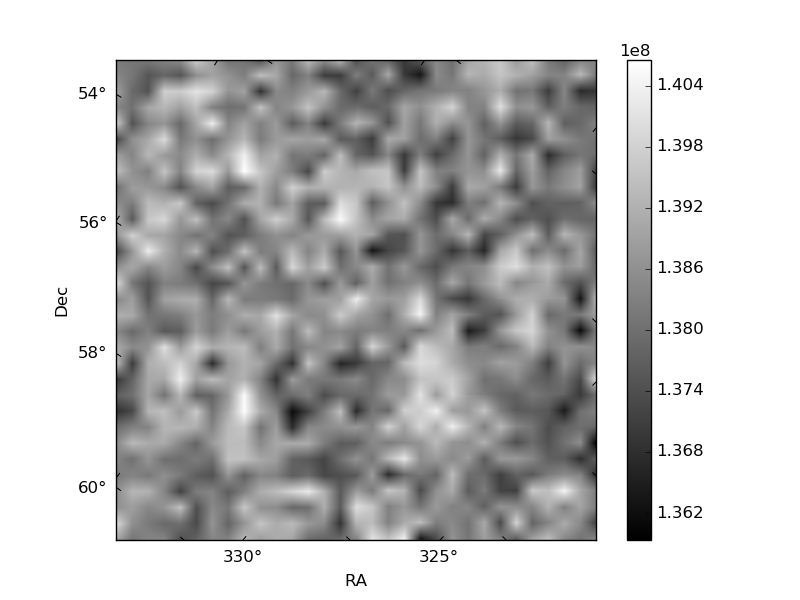
Quadrant B |
|---|---|---|---|
| Quadrant D | 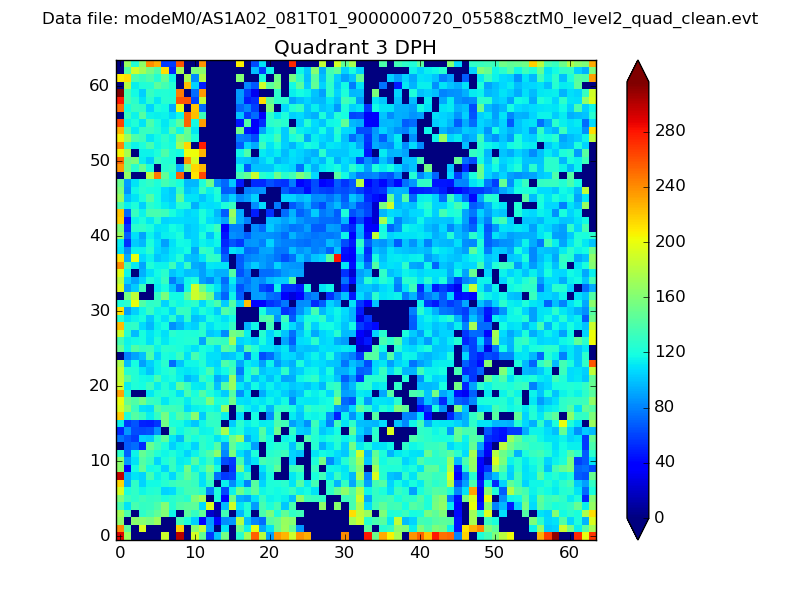 |
 |
Quadrant C |
| Plot type | Count rate plots | Images |
|---|---|---|
| Comparison with Poisson distribution Blue bars denote a histogram of data divided into 1 sec bins. Red curve is a Poisson curve with rate = median count rate of data. |
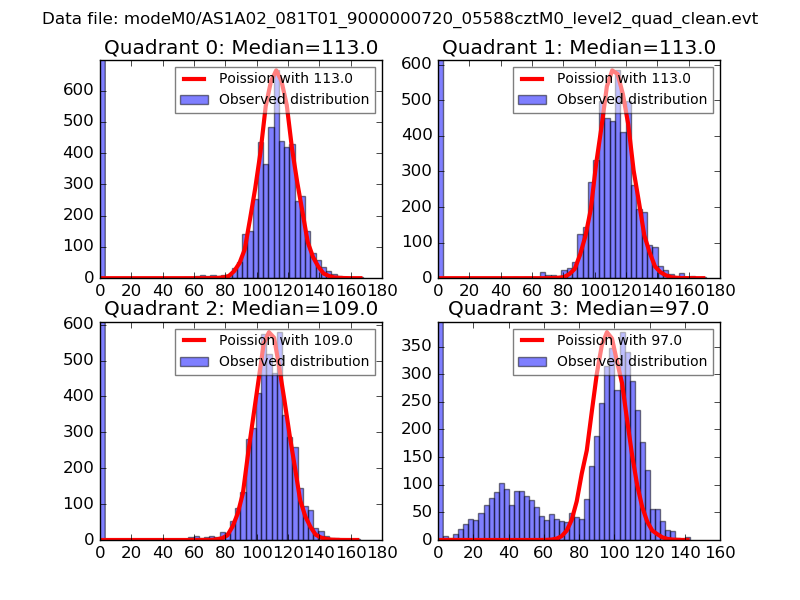 |
 |
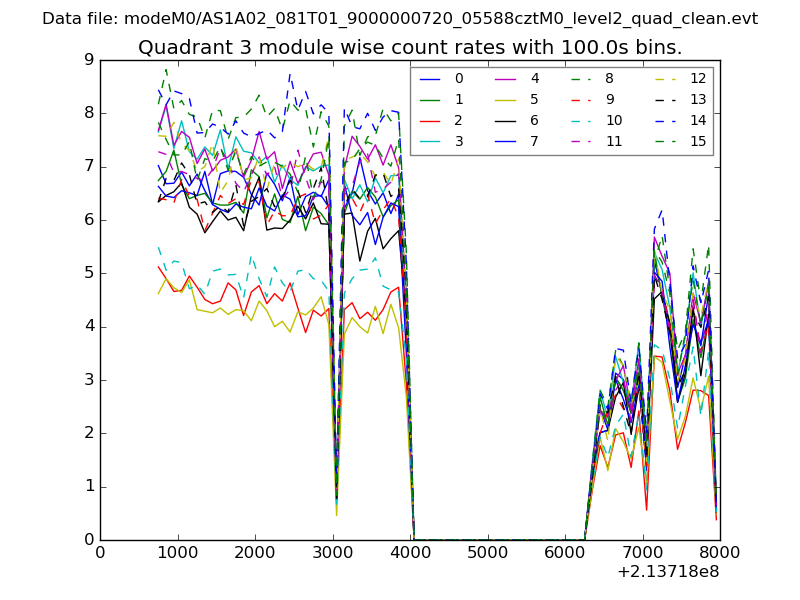
| Quadrant-wise count rates Data is divided into 100 sec bins |
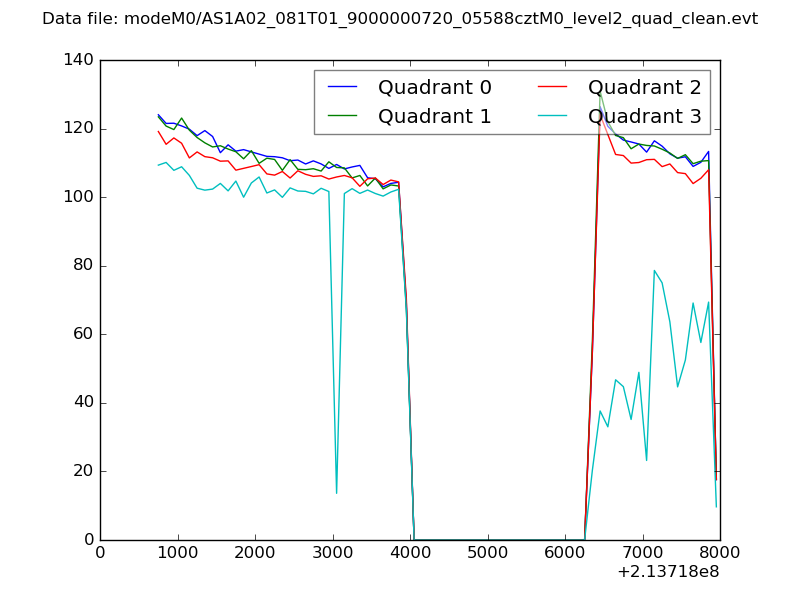 |
|
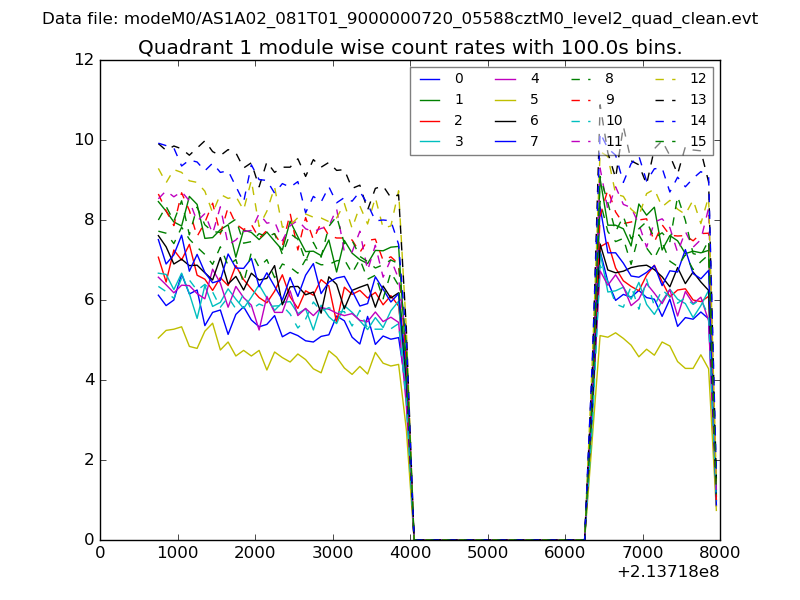
| Module-wise count rates for Quadrant A Data is divided into 100 sec bins |
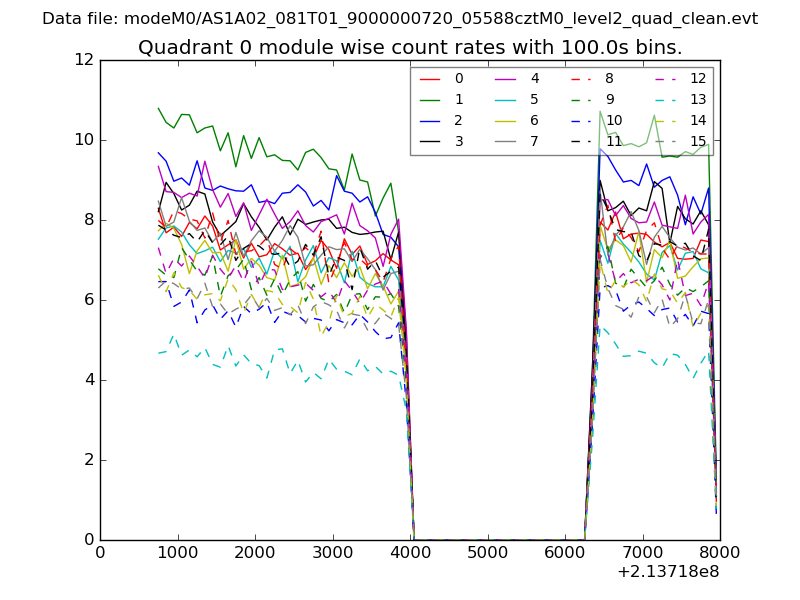 |
 |
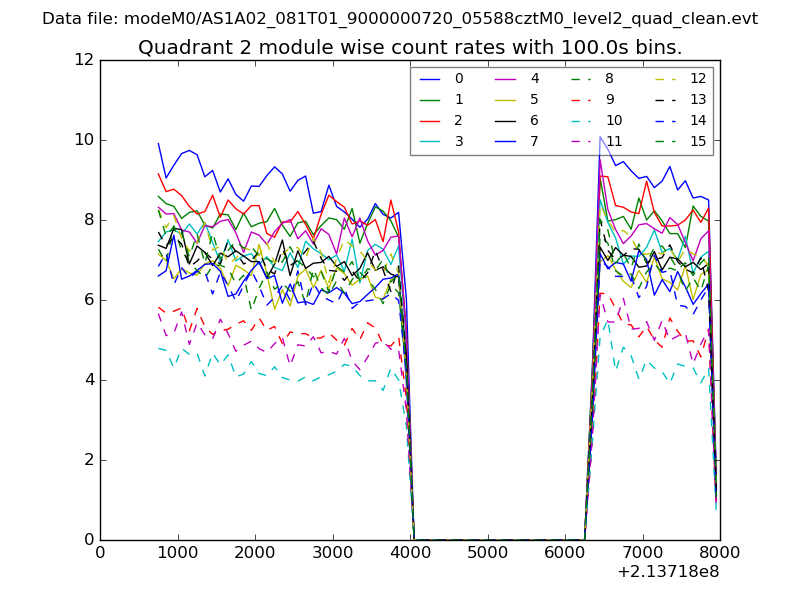
| Module-wise count rates for Quadrant B Data is divided into 100 sec bins |
 |
 |
| Module-wise count rates for Quadrant C Data is divided into 100 sec bins |
 |
 |
| Module-wise count rates for Quadrant D Data is divided into 100 sec bins |
 |
 |
| Parameter | Plot |
|---|---|
| CZT HV Monitor | 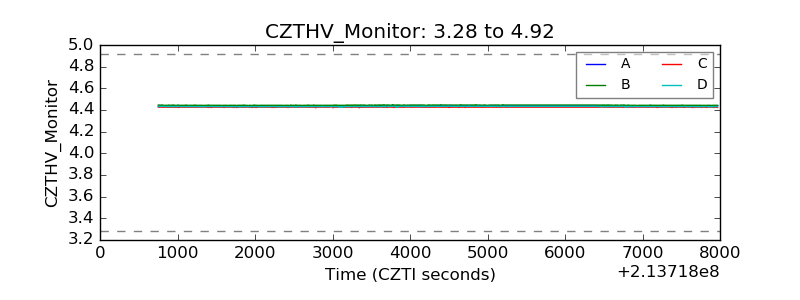 |
| D_VDD | 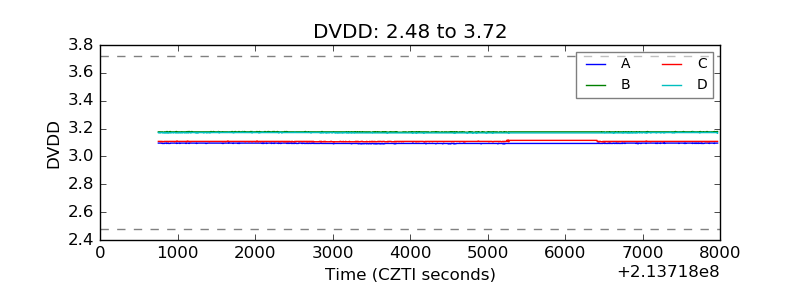 |
| Temperature 1 | 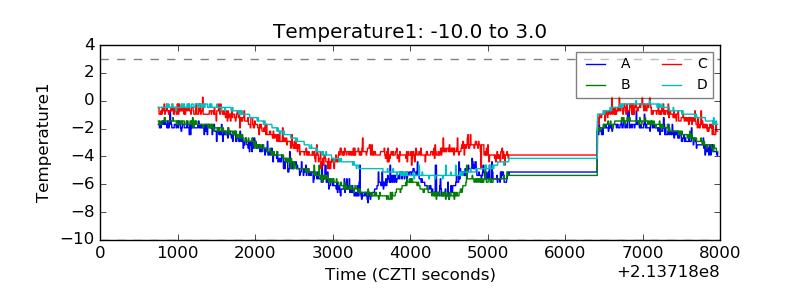 |
| Veto HV Monitor | 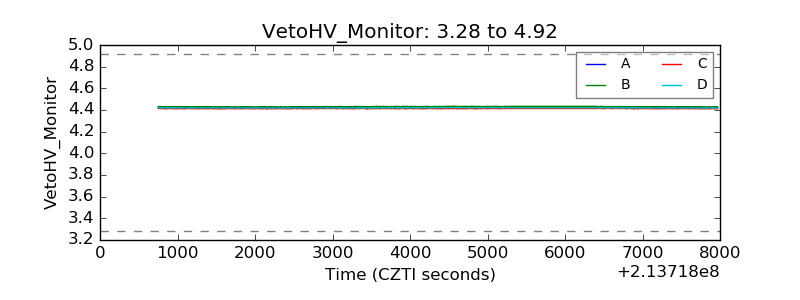 |
| Veto LLD | 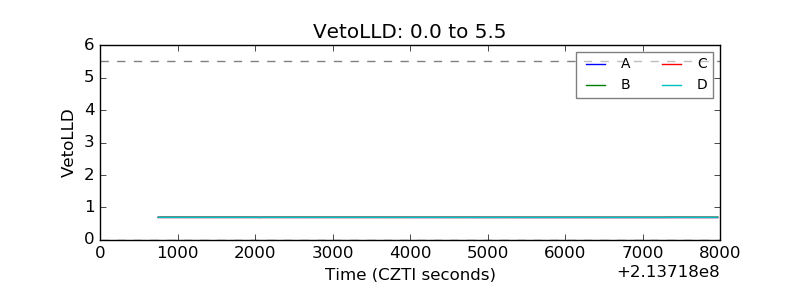 |
| Alpha Counter | 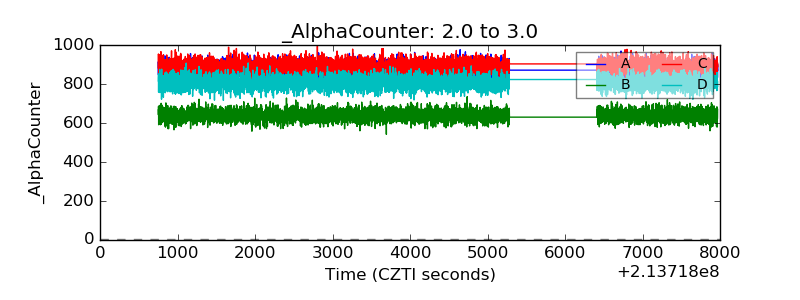 |
| _CPM_Rate | 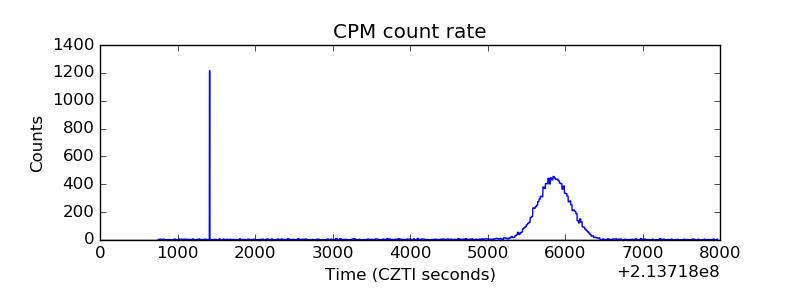 |
| CZT Counter | 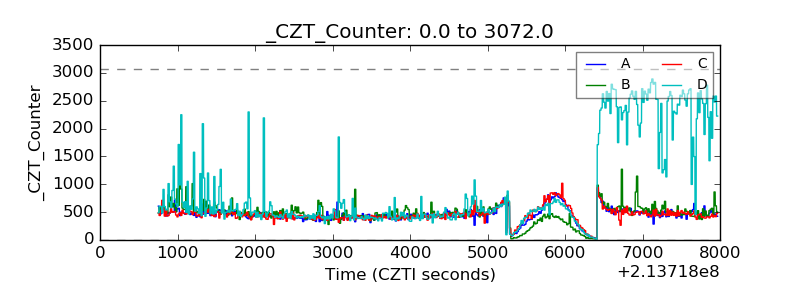 |
| +2.5 Volts monitor |  |
| +5 Volts monitor |  |
| _ROLL_ROT | 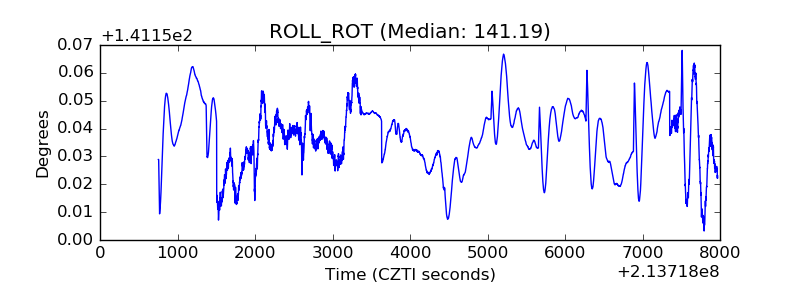 |
| _Roll_DEC | 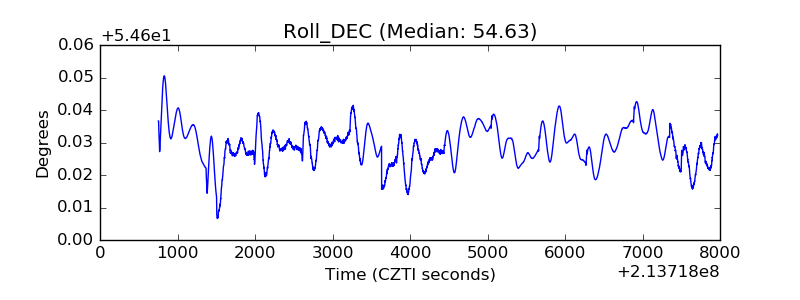 |
| _Roll_RA | 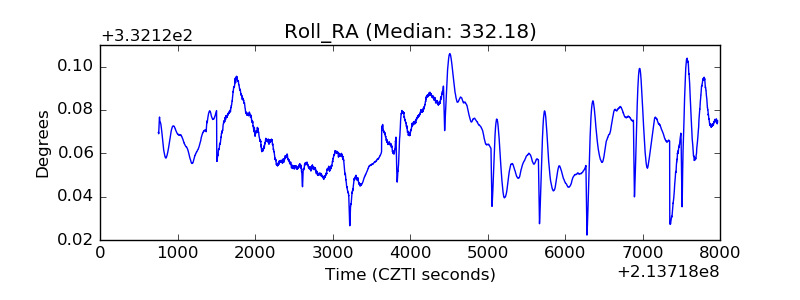 |
| Veto Counter | 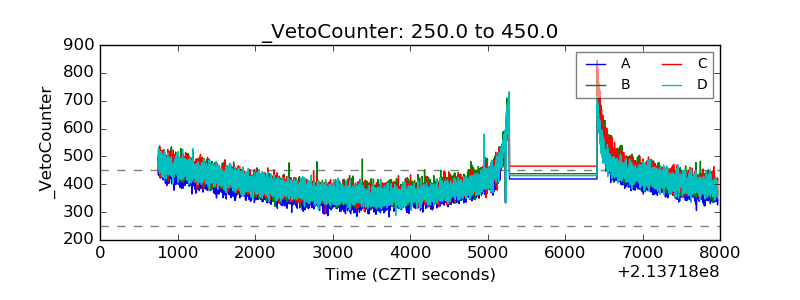 |