| Param | Original file | Final file |
|---|---|---|
| Filename | modeM0/AS1G06_034T01_9000000722cztM0_level2.fits | modeM0/AS1G06_034T01_9000000722cztM0_level2_quad_clean.evt |
| Size (bytes) | 413,665,920 | 456,975,360 |
| Size | 394.5 MB | 435.8 MB |
| Events in quadrant A | 2,487,086 | 2,810,940 |
| Events in quadrant B | 2,411,312 | 2,814,941 |
| Events in quadrant C | 2,455,246 | 2,672,853 |
| Events in quadrant D | 2,018,626 | 2,387,077 |
| Mode M9 | |||
|---|---|---|---|
| Quadrant | BADHDUFLAG | Total packets | Discarded packets |
| A | 0 | 46 | 0 |
| B | 0 | 46 | 0 |
| C | 0 | 46 | 0 |
| D | 0 | 46 | 0 |
| Mode M0 | |||
|---|---|---|---|
| Quadrant | BADHDUFLAG | Total packets | Discarded packets |
| A | 0 | 95540 | 0 |
| B | 0 | 97704 | 0 |
| C | 0 | 93988 | 0 |
| D | 0 | 136998 | 0 |
| Mode SS | |||
|---|---|---|---|
| Quadrant | BADHDUFLAG | Total packets | Discarded packets |
| A | 0 | 940 | 0 |
| B | 0 | 940 | 0 |
| C | 0 | 940 | 0 |
| D | 0 | 940 | 0 |
| Quadrant | Total seconds | Saturated seconds | Saturation percentage |
|---|---|---|---|
| A | 45947 | 554 | 1.205737% |
| B | 45948 | 547 | 1.190476% |
| C | 45947 | 272 | 0.591986% |
| D | 45949 | 2893 | 6.296111% |
Noise dominated data is calculated using 1-second bins in cleaned event files. If a bin has >2000 counts, and if more than 50% of those come from <1% of pixels, then it is considered to be noise-dominated and hence unusable.
| Quadrant | # 1 sec bins | Bins with >0 counts | Bins with >2000 counts | High rate bins dominated by noise | Noise dominated (total time) | Noise dominated (detector-on time) | Marked lightcurve |
|---|---|---|---|---|---|---|---|
| A | 50659 | 45947 | 0 | 0 | 0.00% | 0.00% | 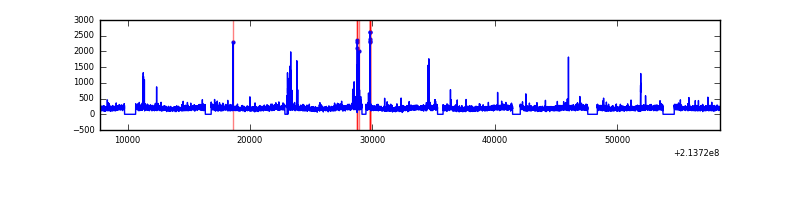 |
| B | 50659 | 45948 | 0 | 0 | 0.00% | 0.00% | 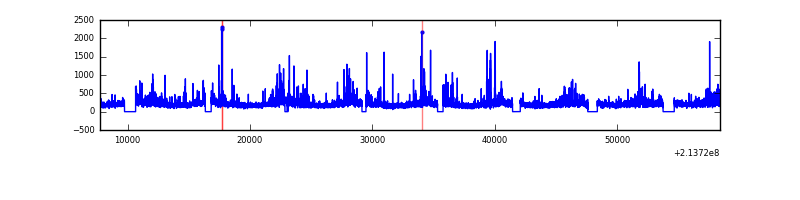 |
| C | 50659 | 45948 | 0 | 0 | 0.00% | 0.00% | 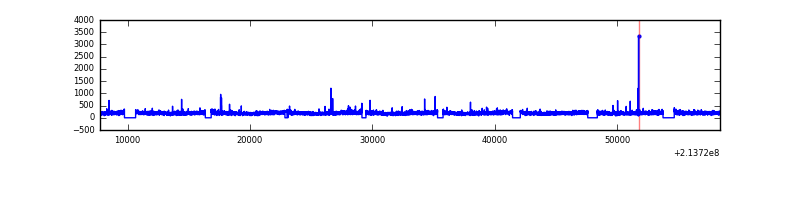 |
| D | 50659 | 45903 | 0 | 0 | 0.00% | 0.00% | 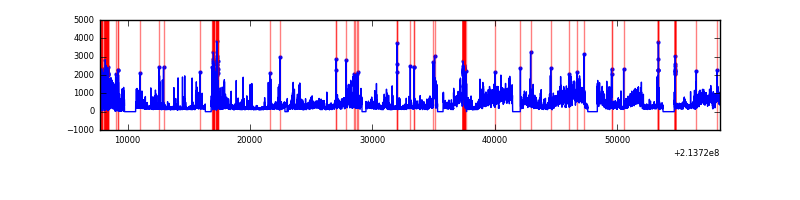 |
Top three noisy pixels from each quadrant. If the there are fewer than three noisy pixels in the level2.evt file, extra rows are filled as -1
| Pixel properties | Quadrant properties | ||||||
|---|---|---|---|---|---|---|---|
| Quadrant | DetID | PixID | Counts | Sigma | Mean | Median | Sigma |
| A | 14 | 188 | 2470 | 11.17 | 645 | 601 | 167.3 |
| A | 0 | 29 | 2364 | 10.54 | 645 | 601 | 167.3 |
| A | 7 | 110 | 2239 | 9.79 | 645 | 601 | 167.3 |
| B | 2 | 9 | 2079 | 11.06 | 635 | 600 | 133.7 |
| B | 12 | 226 | 1675 | 8.04 | 635 | 600 | 133.7 |
| B | 14 | 254 | 1642 | 7.79 | 635 | 600 | 133.7 |
| C | 1 | 81 | 1819 | 7.02 | 648 | 596 | 174.3 |
| C | 1 | 80 | 1814 | 6.99 | 648 | 596 | 174.3 |
| C | 1 | 65 | 1706 | 6.37 | 648 | 596 | 174.3 |
| D | 11 | 82 | 1567 | 6.59 | 576 | 521 | 158.7 |
| D | 3 | 14 | 1535 | 6.39 | 576 | 521 | 158.7 |
| D | 4 | 160 | 1467 | 5.96 | 576 | 521 | 158.7 |
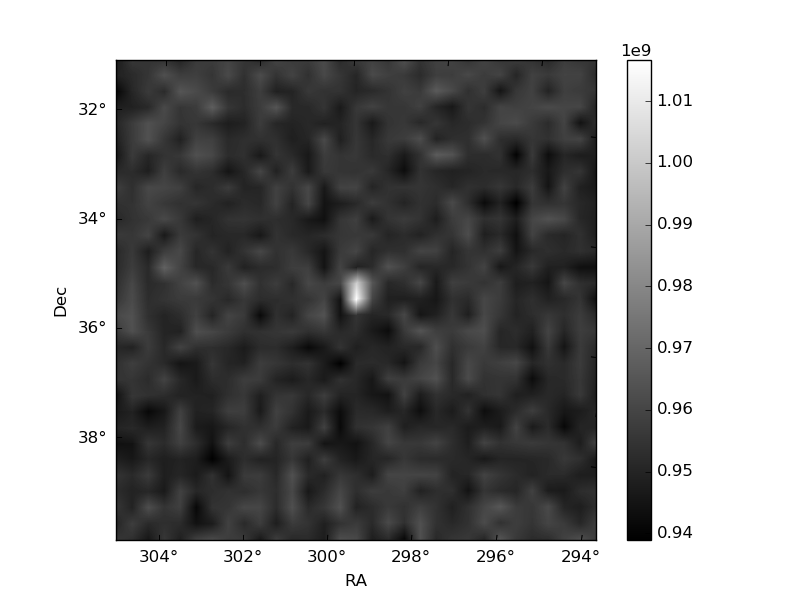
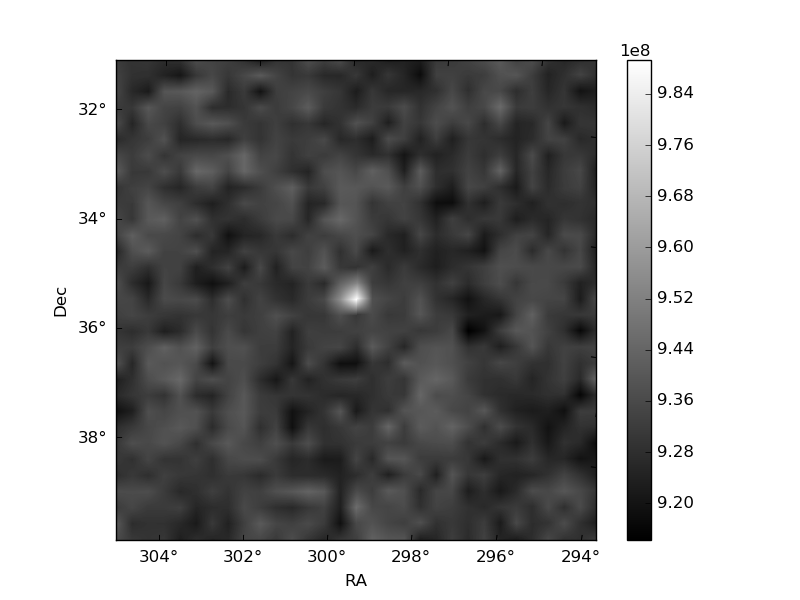
Histogram calculated using DETX and DETY for each event in the final _common_clean file
| Quadrant A | 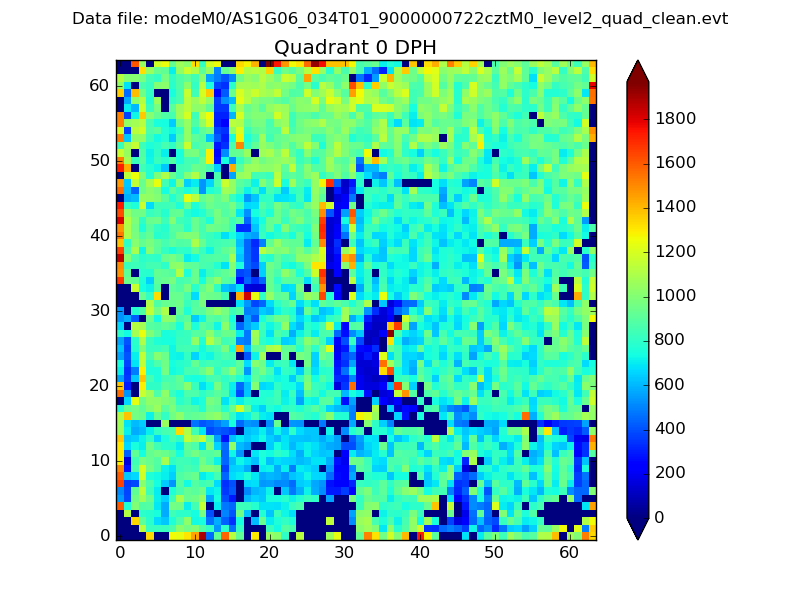 |
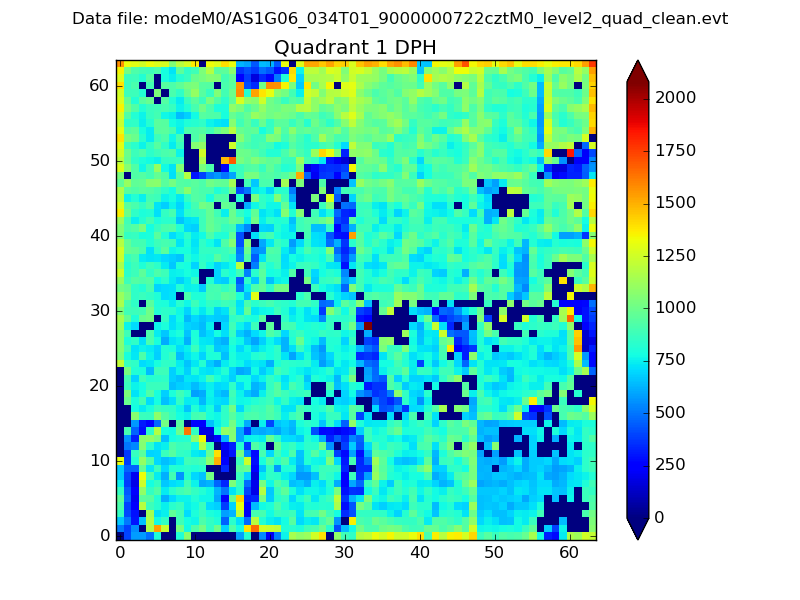 |
Quadrant B |
|---|---|---|---|
| Quadrant D | 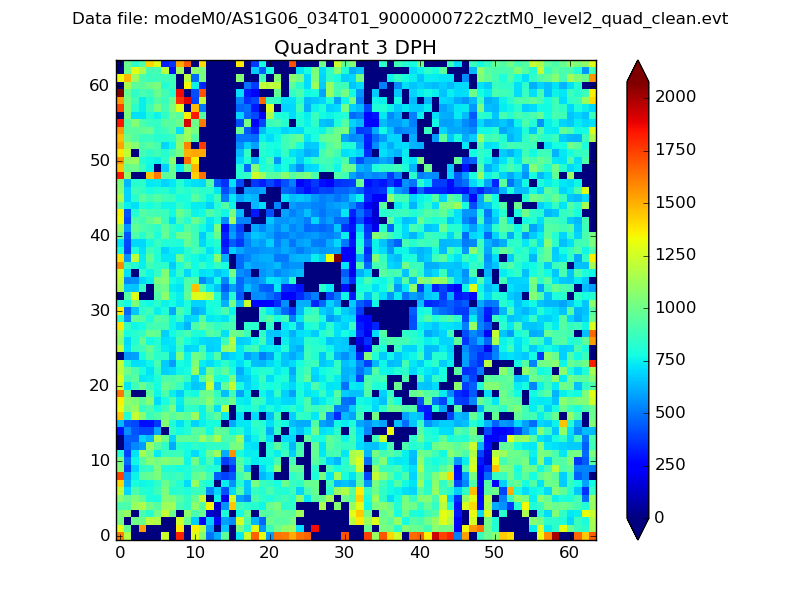 |
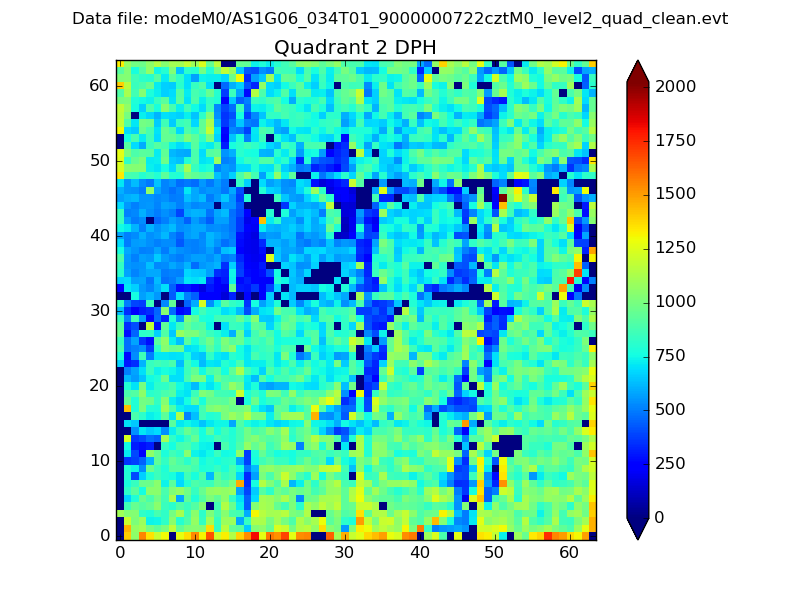 |
Quadrant C |
| Plot type | Count rate plots | Images |
|---|---|---|
| Comparison with Poisson distribution Blue bars denote a histogram of data divided into 1 sec bins. Red curve is a Poisson curve with rate = median count rate of data. |
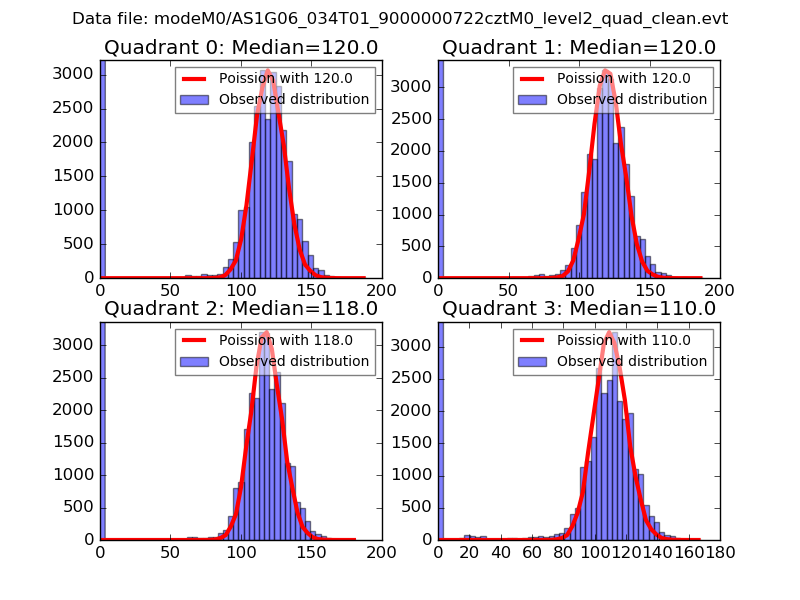 |
 |
| Quadrant-wise count rates Data is divided into 100 sec bins |
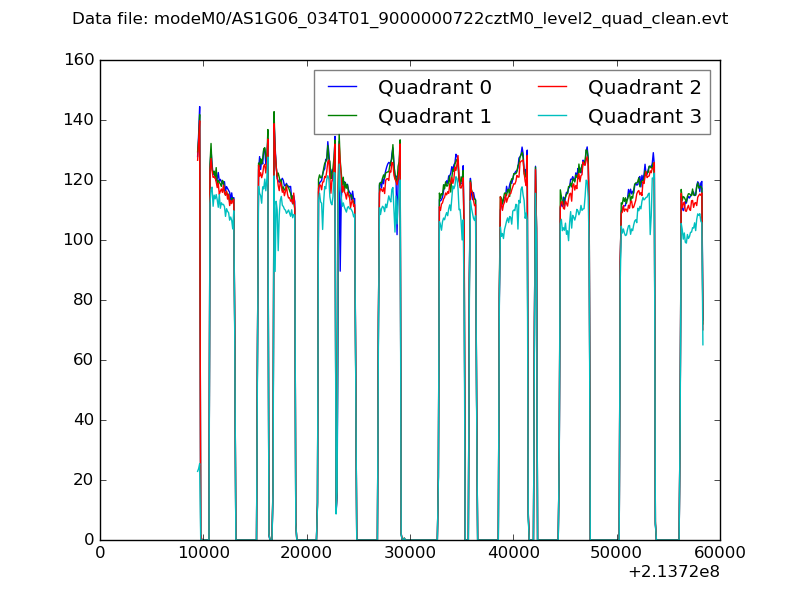 |
|
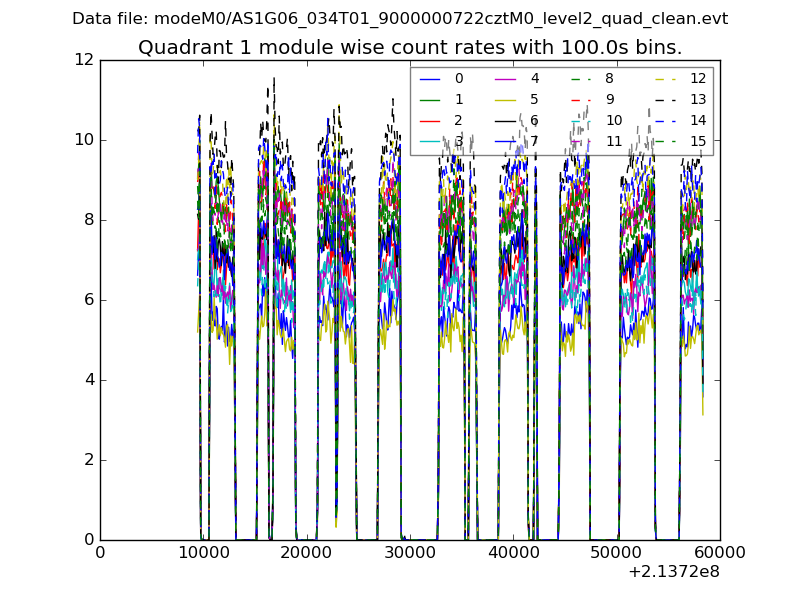
| Module-wise count rates for Quadrant A Data is divided into 100 sec bins |
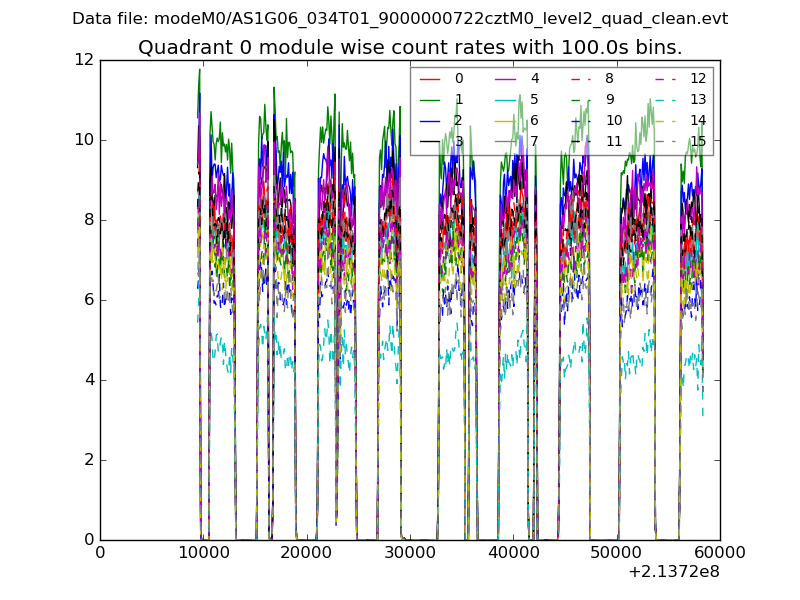 |
 |
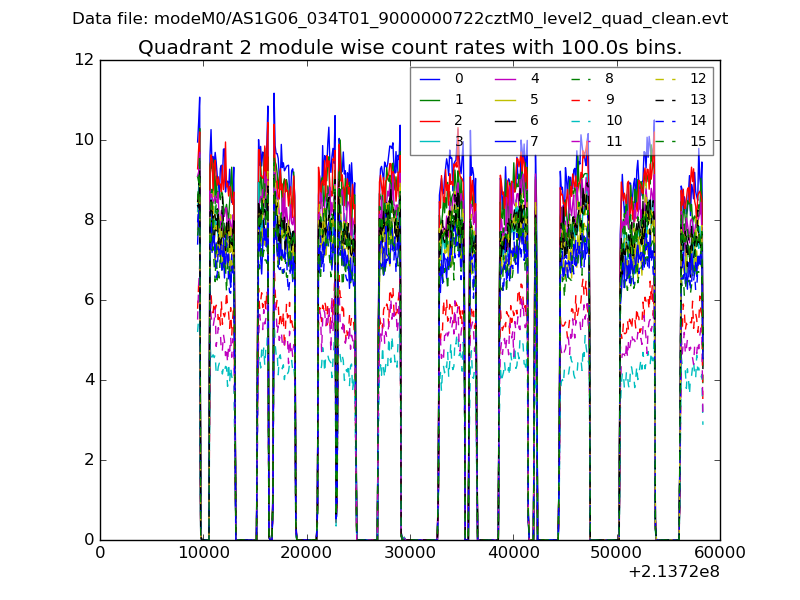
| Module-wise count rates for Quadrant B Data is divided into 100 sec bins |
 |
 |
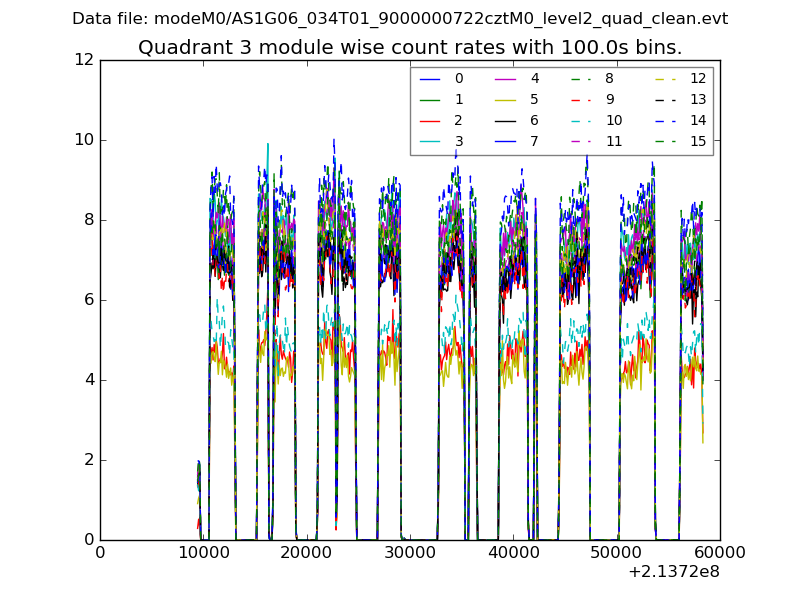
| Module-wise count rates for Quadrant C Data is divided into 100 sec bins |
 |
 |
| Module-wise count rates for Quadrant D Data is divided into 100 sec bins |
 |
 |
| Parameter | Plot |
|---|---|
| CZT HV Monitor | 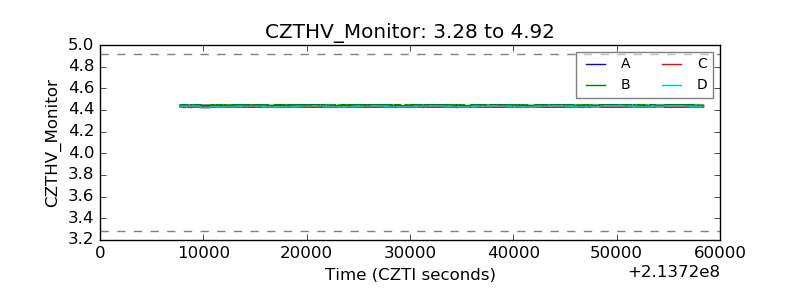 |
| D_VDD | 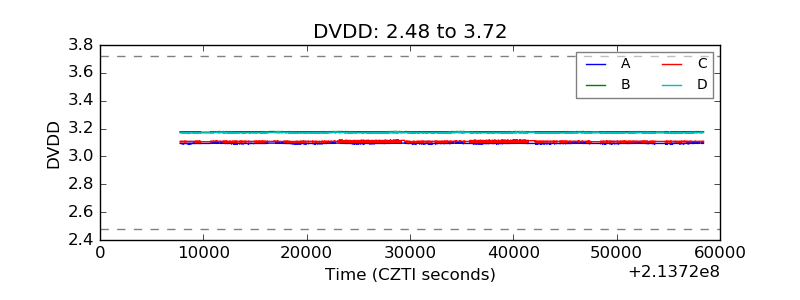 |
| Temperature 1 | 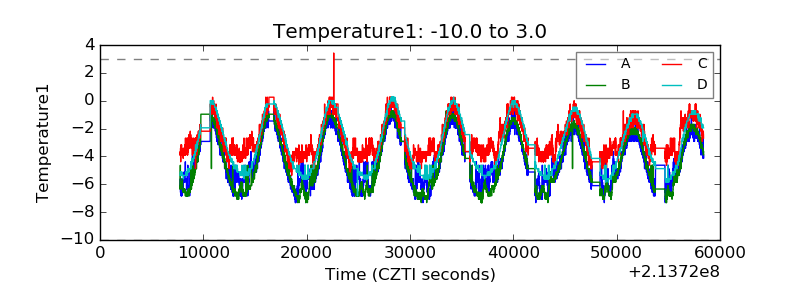 |
| Veto HV Monitor | 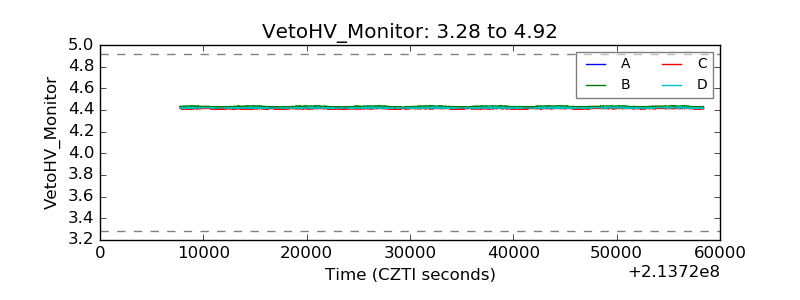 |
| Veto LLD | 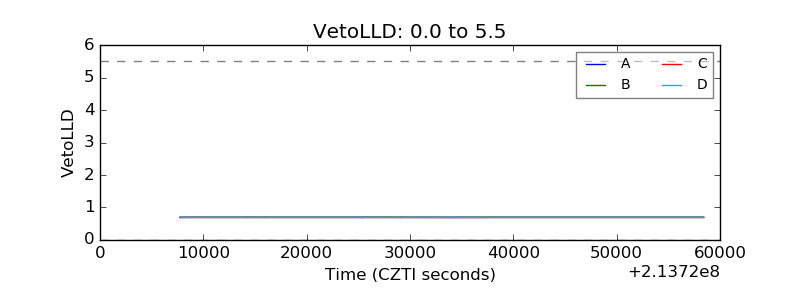 |
| Alpha Counter | 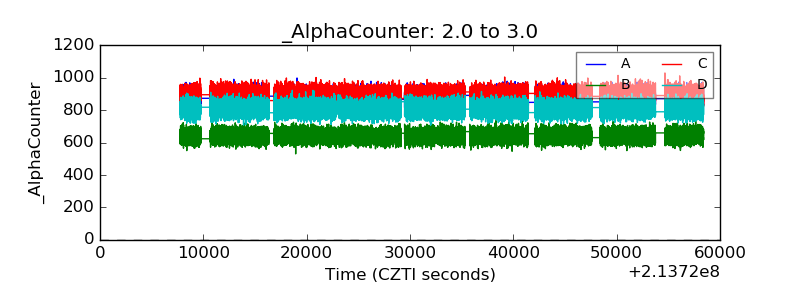 |
| _CPM_Rate | 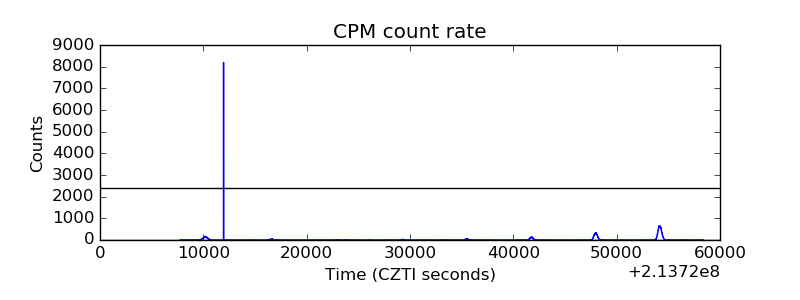 |
| CZT Counter | 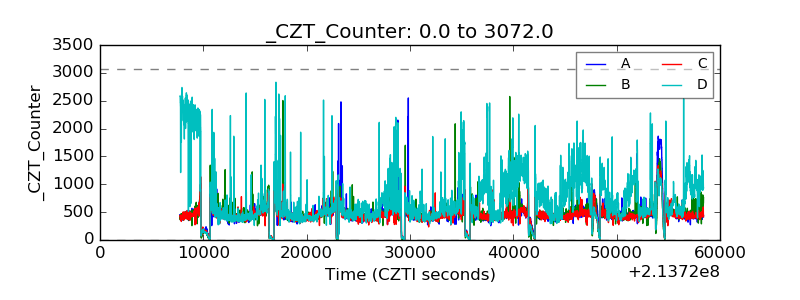 |
| +2.5 Volts monitor | 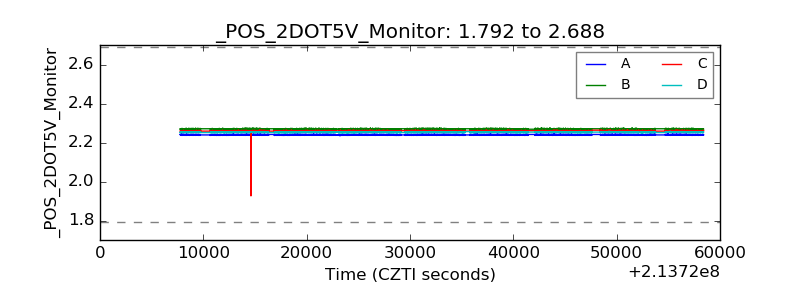 |
| +5 Volts monitor | 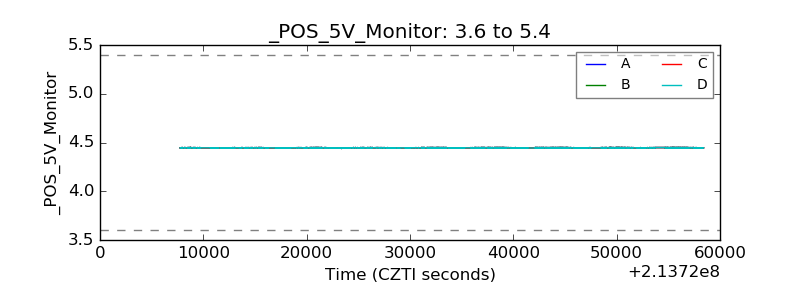 |
| _ROLL_ROT | 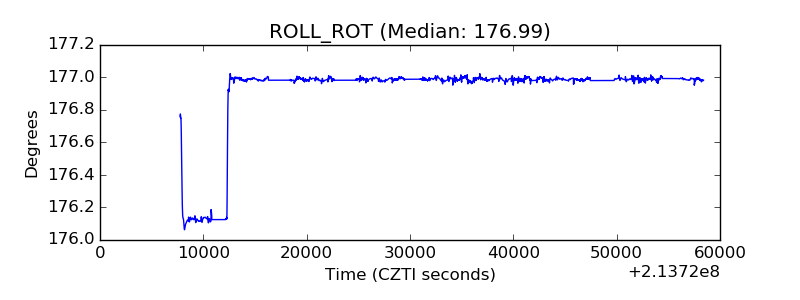 |
| _Roll_DEC | 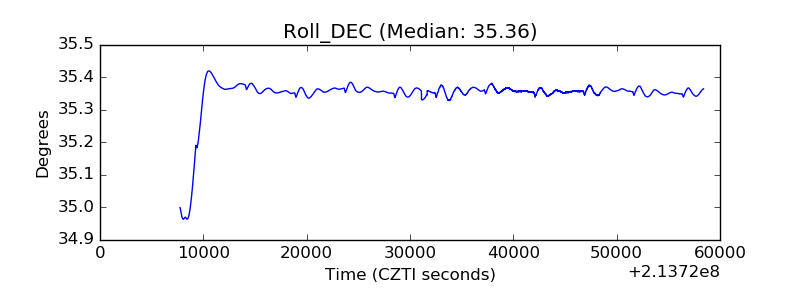 |
| _Roll_RA | 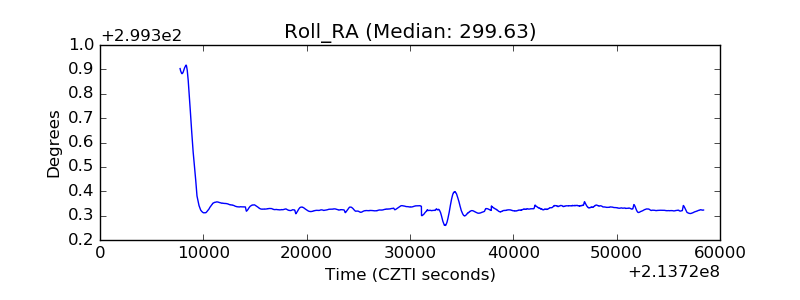 |
| Veto Counter | 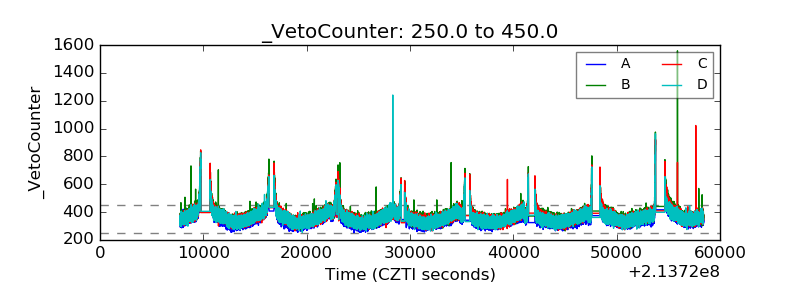 |