| Param | Original file | Final file |
|---|---|---|
| Filename | modeM0/AS1G06_034T01_9000000722_05589cztM0_level2.evt | modeM0/AS1G06_034T01_9000000722_05589cztM0_level2_quad_clean.evt |
| Size (bytes) | 350,640,000 | 35,884,800 |
| Size | 334.4 MB | 34.2 MB |
| Events in quadrant A | 1,718,242 | 222,180 |
| Events in quadrant B | 1,812,870 | 221,668 |
| Events in quadrant C | 1,667,022 | 218,741 |
| Events in quadrant D | 5,183,078 | 176,975 |
| Mode M9 | |||
|---|---|---|---|
| Quadrant | BADHDUFLAG | Total packets | Discarded packets |
| A | 0 | 9 | 0 |
| B | 0 | 9 | 0 |
| C | 0 | 9 | 0 |
| D | 0 | 9 | 0 |
| Mode M0 | |||
|---|---|---|---|
| Quadrant | BADHDUFLAG | Total packets | Discarded packets |
| A | 0 | 7375 | 2 |
| B | 0 | 7577 | 1 |
| C | 0 | 7275 | 1 |
| D | 0 | 17736 | 1 |
| Mode SS | |||
|---|---|---|---|
| Quadrant | BADHDUFLAG | Total packets | Discarded packets |
| A | 0 | 72 | 0 |
| B | 0 | 72 | 0 |
| C | 0 | 72 | 0 |
| D | 0 | 72 | 0 |
| Quadrant | Total seconds | Saturated seconds | Saturation percentage |
|---|---|---|---|
| A | 3477 | 49 | 1.409261% |
| B | 3477 | 52 | 1.495542% |
| C | 3477 | 42 | 1.207938% |
| D | 3477 | 1862 | 53.551913% |
Noise dominated data is calculated using 1-second bins in cleaned event files. If a bin has >2000 counts, and if more than 50% of those come from <1% of pixels, then it is considered to be noise-dominated and hence unusable.
| Quadrant | # 1 sec bins | Bins with >0 counts | Bins with >2000 counts | High rate bins dominated by noise | Noise dominated (total time) | Noise dominated (detector-on time) | Marked lightcurve |
|---|---|---|---|---|---|---|---|
| A | 4387 | 3478 | 1 | 1 | 0.02% | 0.03% | 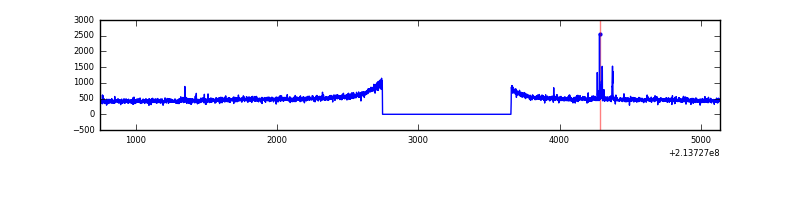 |
| B | 4387 | 3478 | 0 | 0 | 0.00% | 0.00% | 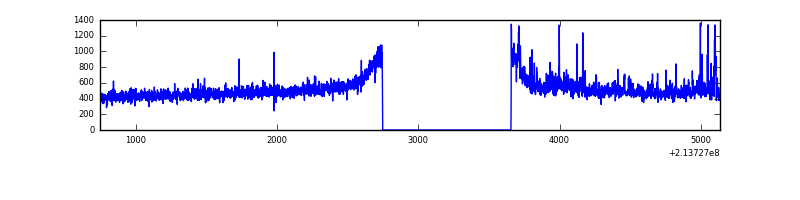 |
| C | 4387 | 3478 | 0 | 0 | 0.00% | 0.00% |  |
| D | 4387 | 3477 | 1463 | 1463 | 33.35% | 42.08% | 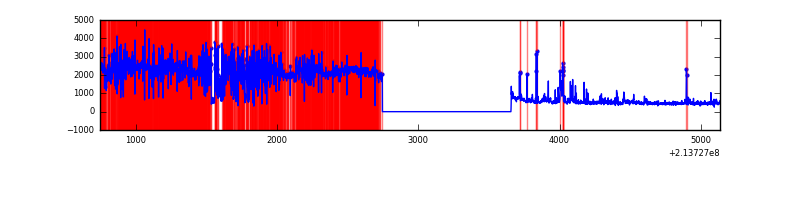 |
Top three noisy pixels from each quadrant. If the there are fewer than three noisy pixels in the level2.evt file, extra rows are filled as -1
| Pixel properties | Quadrant properties | ||||||
|---|---|---|---|---|---|---|---|
| Quadrant | DetID | PixID | Counts | Sigma | Mean | Median | Sigma |
| A | 0 | 50 | 19099 | 205.81 | 439 | 429 | 90.7 |
| A | 12 | 194 | 4497 | 44.84 | 439 | 429 | 90.7 |
| A | 15 | 236 | 4422 | 44.02 | 439 | 429 | 90.7 |
| B | 4 | 48 | 34613 | 391.8 | 442 | 431 | 87.2 |
| B | 0 | 214 | 27042 | 305.02 | 442 | 431 | 87.2 |
| B | 15 | 204 | 20826 | 233.77 | 442 | 431 | 87.2 |
| C | 13 | 61 | 3568 | 31.18 | 426 | 428 | 100.7 |
| C | 1 | 16 | 1952 | 15.13 | 426 | 428 | 100.7 |
| C | 8 | 222 | 1448 | 10.13 | 426 | 428 | 100.7 |
| D | 2 | 63 | 3871410 | 54551.68 | 286 | 277 | 71.0 |
| D | 2 | 136 | 93469 | 1313.25 | 286 | 277 | 71.0 |
| D | 2 | 33 | 41251 | 577.4 | 286 | 277 | 71.0 |
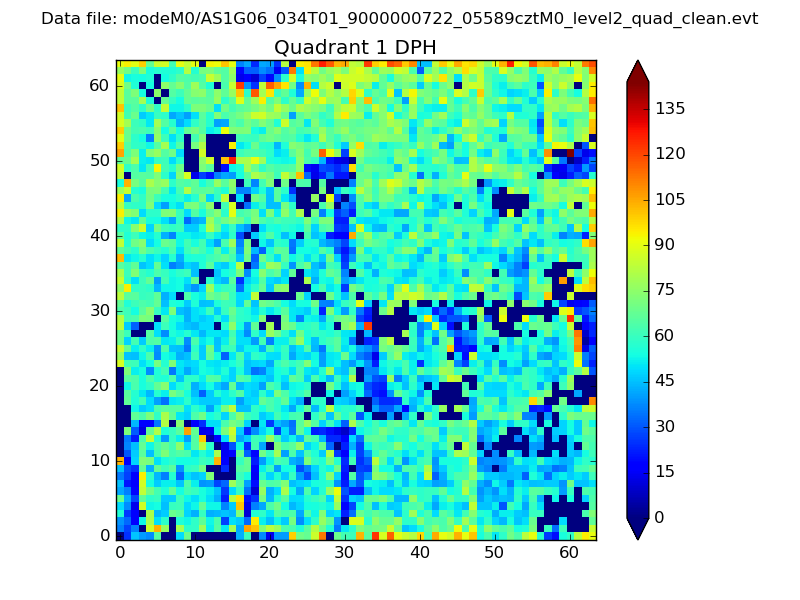
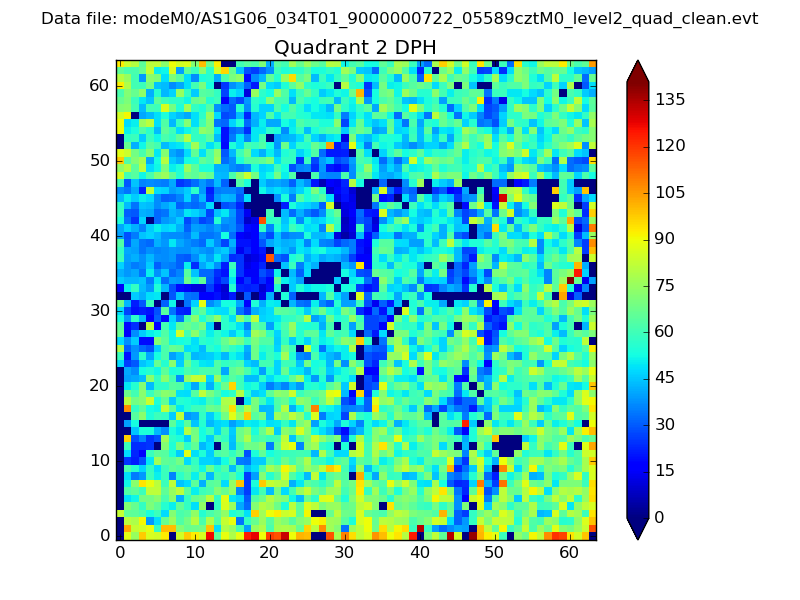
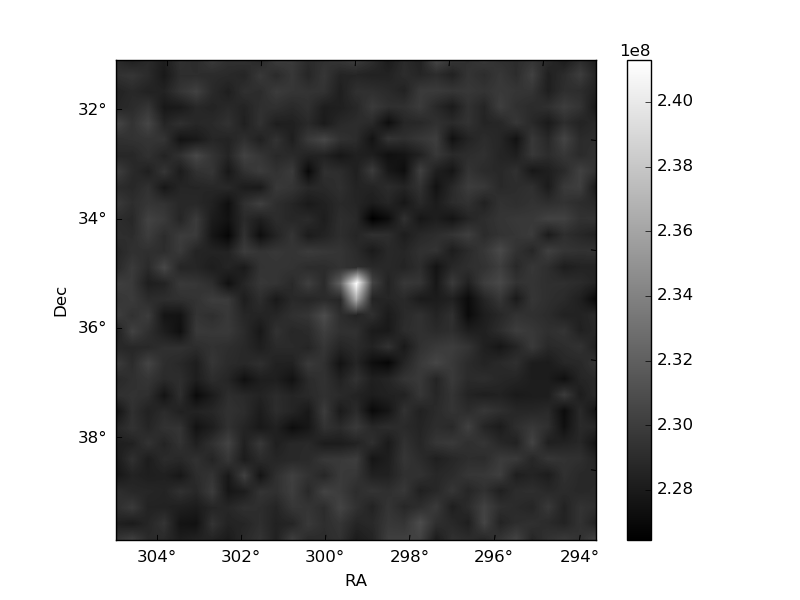
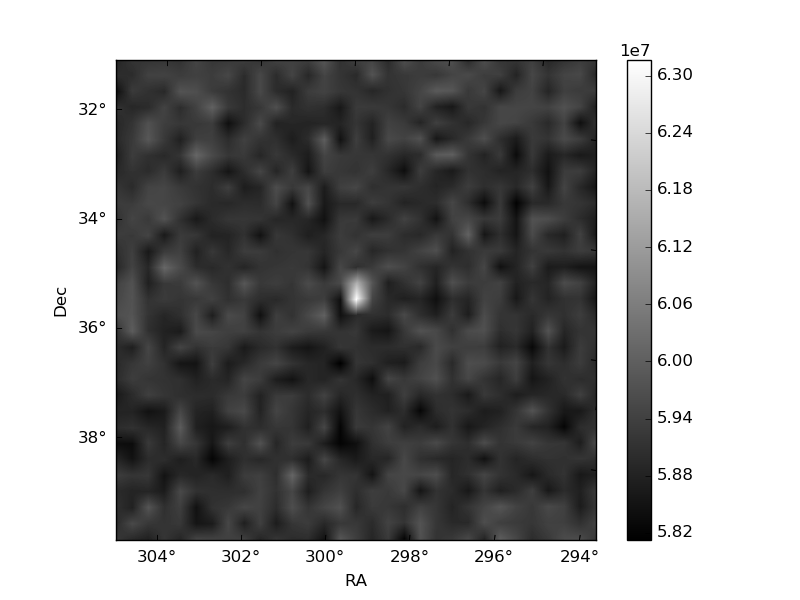
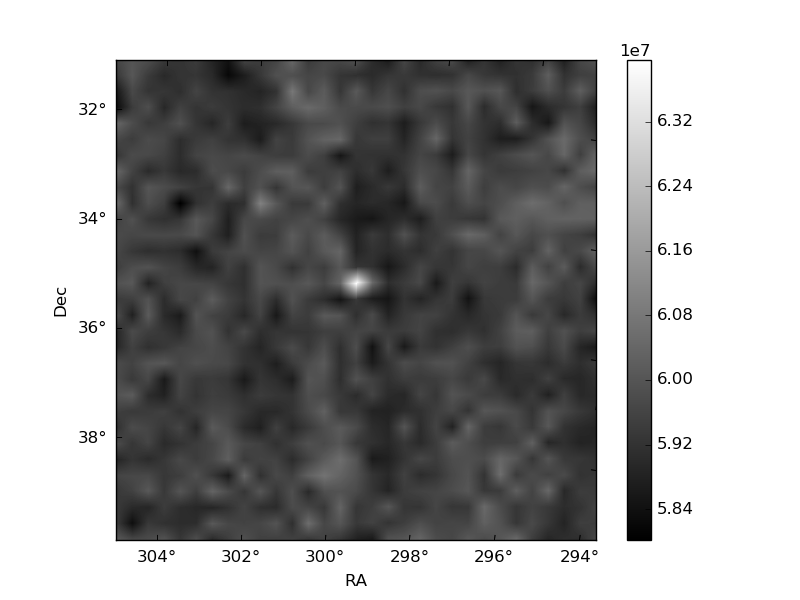
Histogram calculated using DETX and DETY for each event in the final _common_clean file
| Quadrant A | 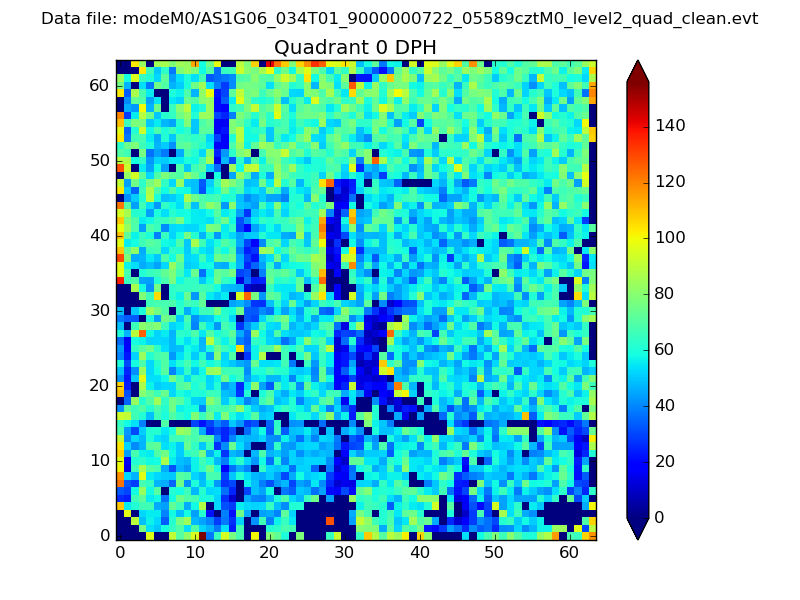 |
 |
Quadrant B |
|---|---|---|---|
| Quadrant D | 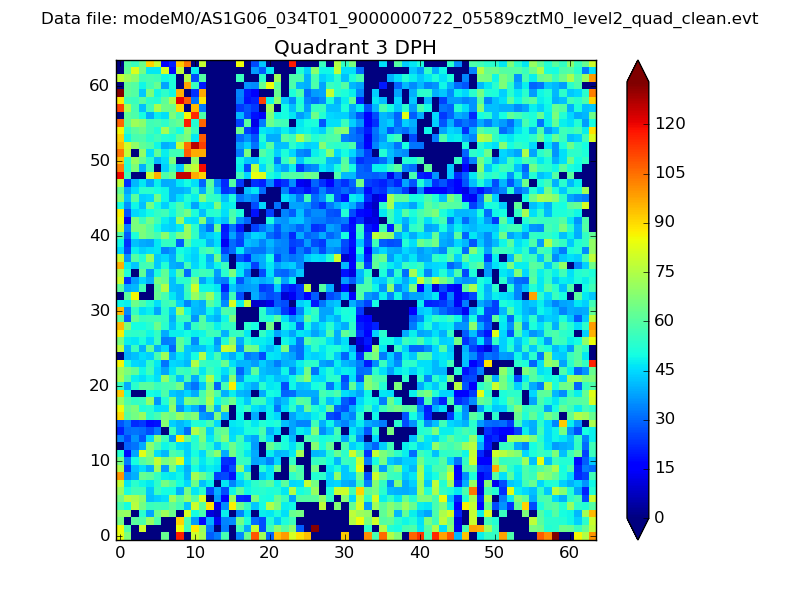 |
 |
Quadrant C |
| Plot type | Count rate plots | Images |
|---|---|---|
| Comparison with Poisson distribution Blue bars denote a histogram of data divided into 1 sec bins. Red curve is a Poisson curve with rate = median count rate of data. |
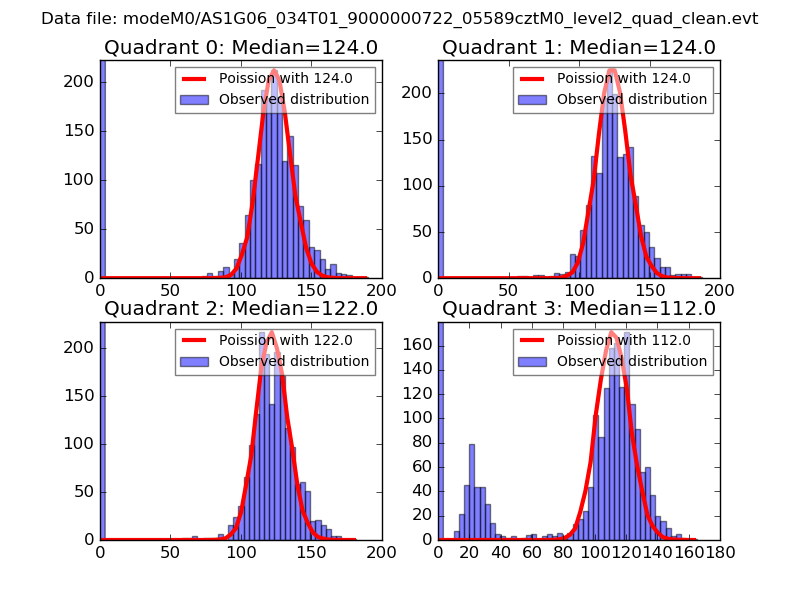 |
 |
| Quadrant-wise count rates Data is divided into 100 sec bins |
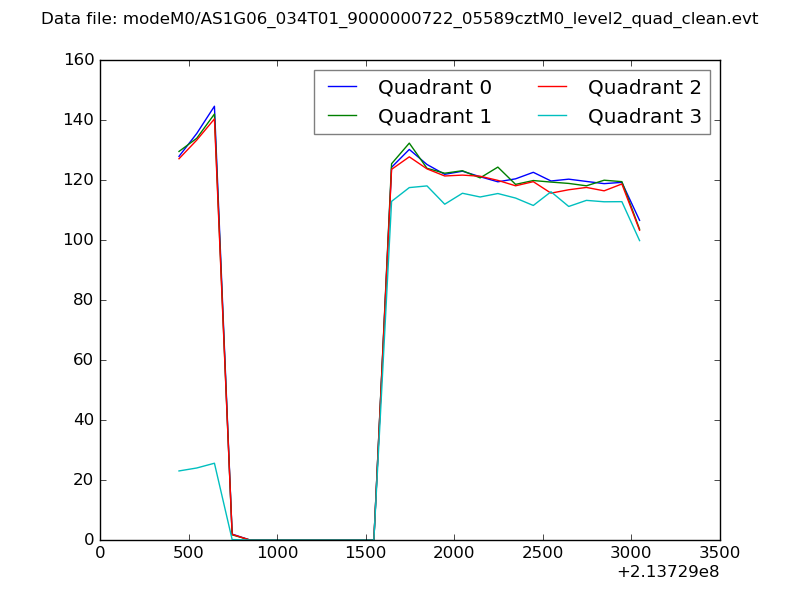 |
|
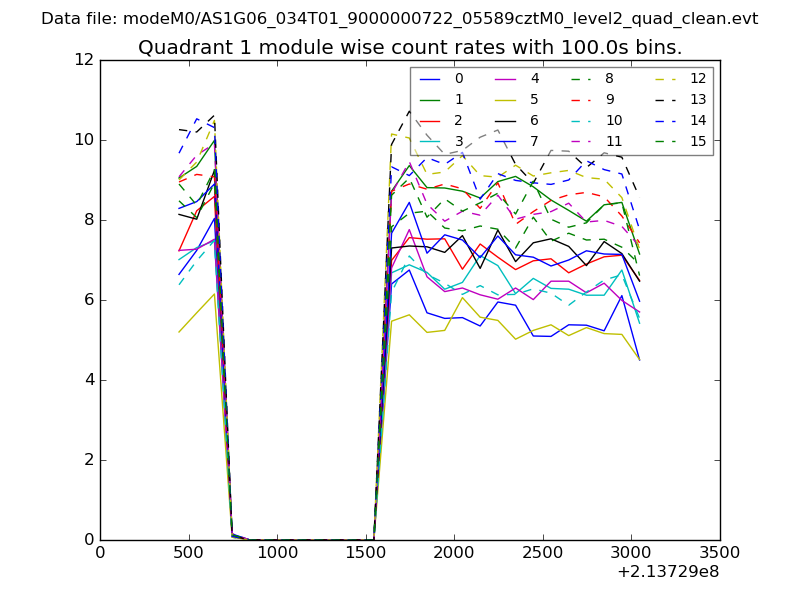
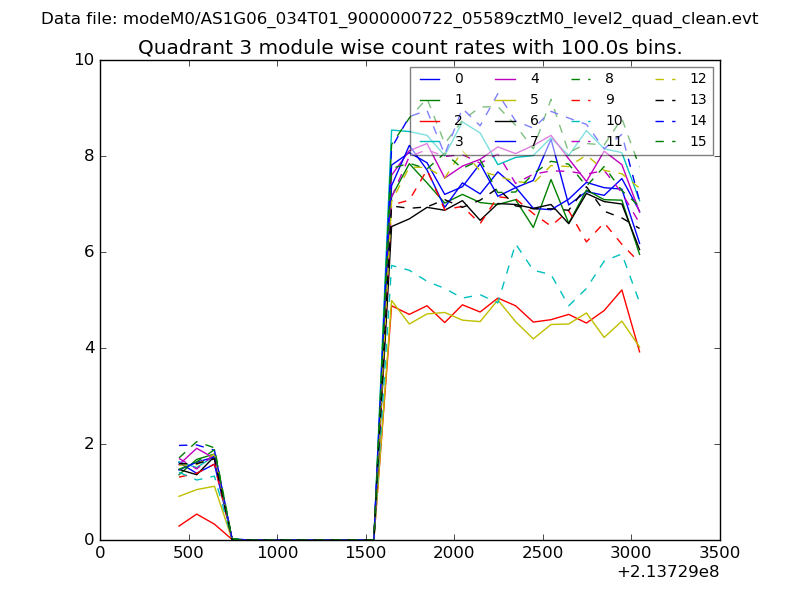
| Module-wise count rates for Quadrant A Data is divided into 100 sec bins |
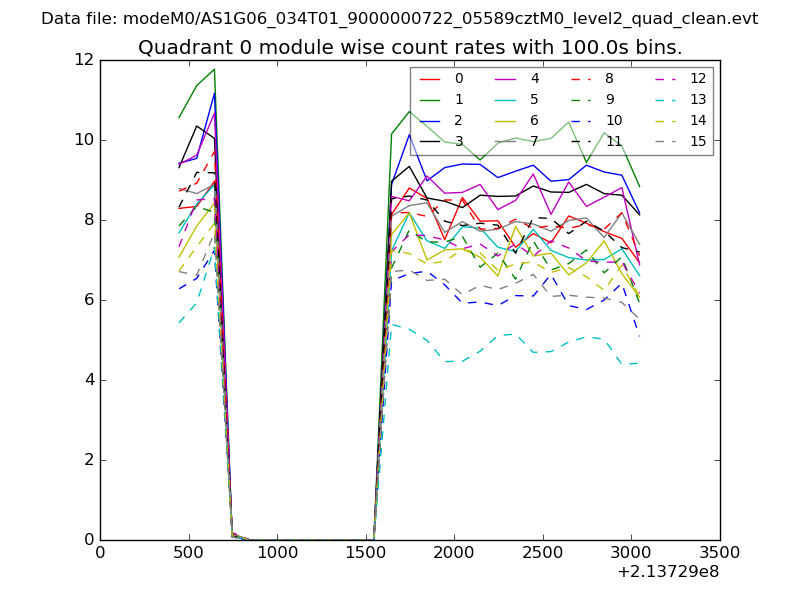 |
 |
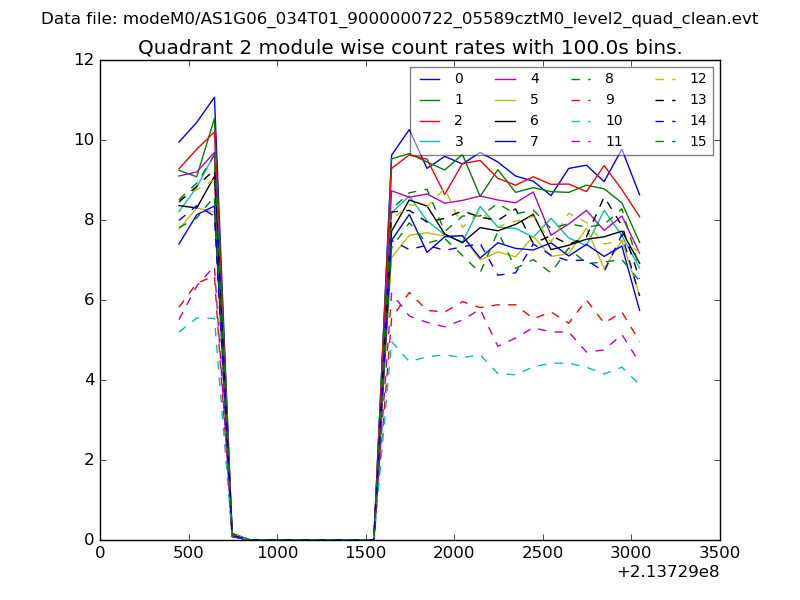
| Module-wise count rates for Quadrant B Data is divided into 100 sec bins |
 |
 |
| Module-wise count rates for Quadrant C Data is divided into 100 sec bins |
 |
 |
| Module-wise count rates for Quadrant D Data is divided into 100 sec bins |
 |
 |
| Parameter | Plot |
|---|---|
| CZT HV Monitor | 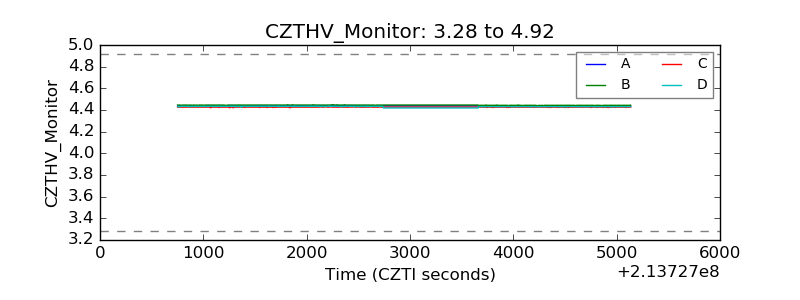 |
| D_VDD | 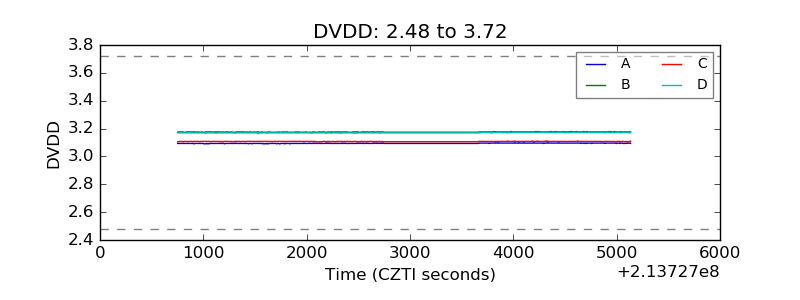 |
| Temperature 1 |  |
| Veto HV Monitor |  |
| Veto LLD | 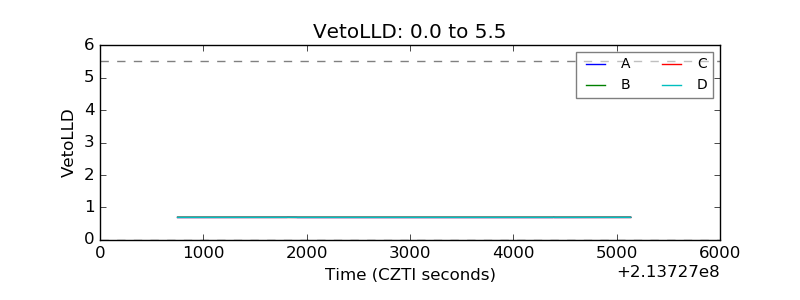 |
| Alpha Counter | 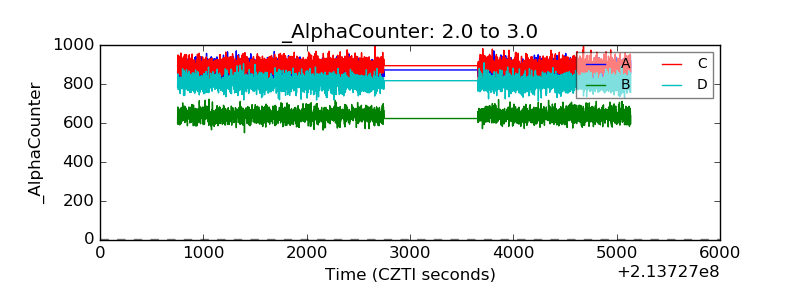 |
| _CPM_Rate | 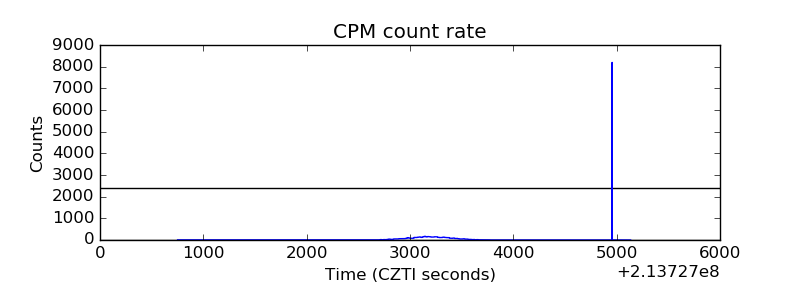 |
| CZT Counter | 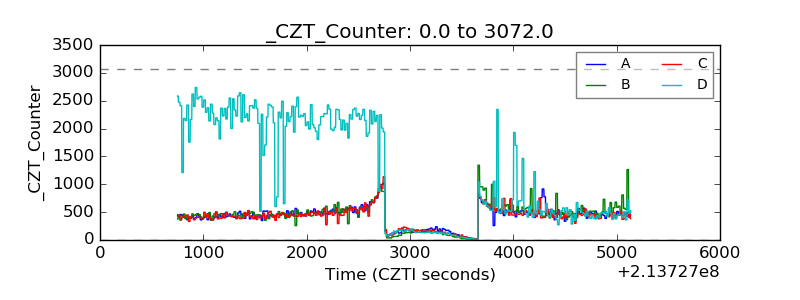 |
| +2.5 Volts monitor |  |
| +5 Volts monitor |  |
| _ROLL_ROT | 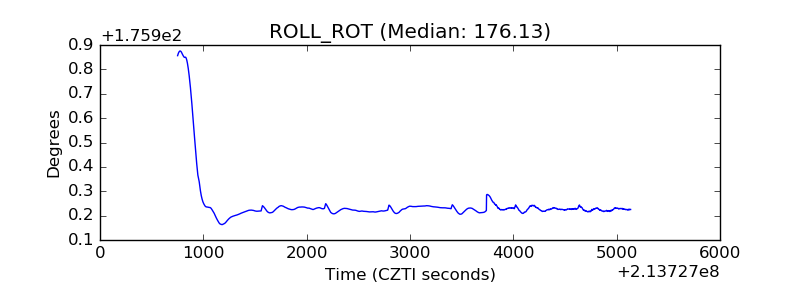 |
| _Roll_DEC | 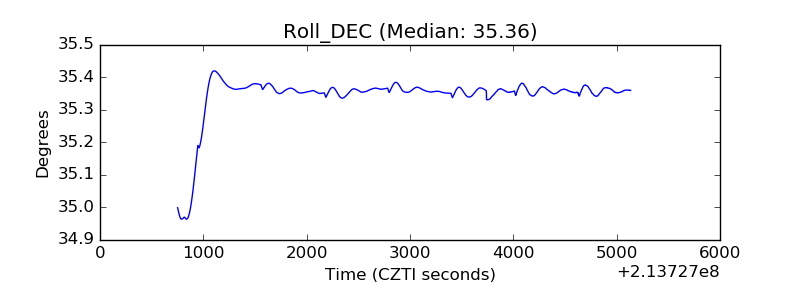 |
| _Roll_RA | 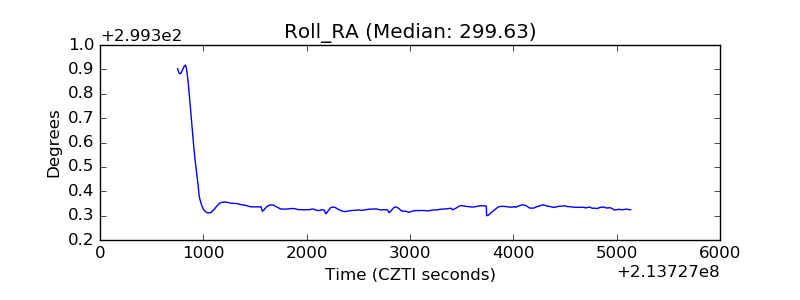 |
| Veto Counter | 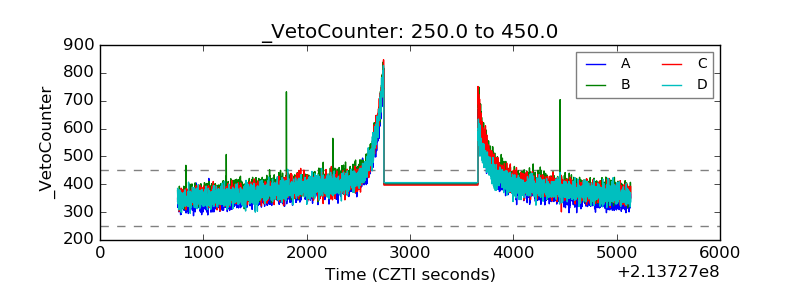 |