| Param | Original file | Final file |
|---|---|---|
| Filename | modeM0/AS1G06_034T01_9000000722_05590cztM0_level2.evt | modeM0/AS1G06_034T01_9000000722_05590cztM0_level2_quad_clean.evt |
| Size (bytes) | 484,073,280 | 93,628,800 |
| Size | 461.6 MB | 89.3 MB |
| Events in quadrant A | 3,335,560 | 599,734 |
| Events in quadrant B | 3,602,486 | 597,431 |
| Events in quadrant C | 3,257,461 | 589,389 |
| Events in quadrant D | 3,980,909 | 553,047 |
| Mode M9 | |||
|---|---|---|---|
| Quadrant | BADHDUFLAG | Total packets | Discarded packets |
| A | 0 | 5 | 0 |
| B | 0 | 5 | 0 |
| C | 0 | 5 | 0 |
| D | 0 | 5 | 0 |
| Mode M0 | |||
|---|---|---|---|
| Quadrant | BADHDUFLAG | Total packets | Discarded packets |
| A | 0 | 14768 | 2 |
| B | 0 | 15334 | 1 |
| C | 0 | 14611 | 1 |
| D | 0 | 16894 | 1 |
| Mode SS | |||
|---|---|---|---|
| Quadrant | BADHDUFLAG | Total packets | Discarded packets |
| A | 0 | 144 | 0 |
| B | 0 | 144 | 0 |
| C | 0 | 144 | 0 |
| D | 0 | 144 | 0 |
| Quadrant | Total seconds | Saturated seconds | Saturation percentage |
|---|---|---|---|
| A | 7122 | 61 | 0.856501% |
| B | 7122 | 91 | 1.277731% |
| C | 7122 | 25 | 0.351025% |
| D | 7122 | 196 | 2.752036% |
Noise dominated data is calculated using 1-second bins in cleaned event files. If a bin has >2000 counts, and if more than 50% of those come from <1% of pixels, then it is considered to be noise-dominated and hence unusable.
| Quadrant | # 1 sec bins | Bins with >0 counts | Bins with >2000 counts | High rate bins dominated by noise | Noise dominated (total time) | Noise dominated (detector-on time) | Marked lightcurve |
|---|---|---|---|---|---|---|---|
| A | 7607 | 7123 | 1 | 1 | 0.01% | 0.01% | 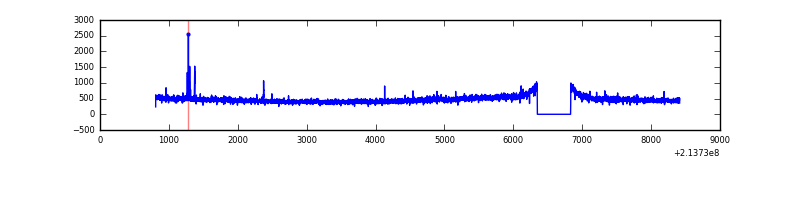 |
| B | 7607 | 7123 | 4 | 4 | 0.05% | 0.06% | 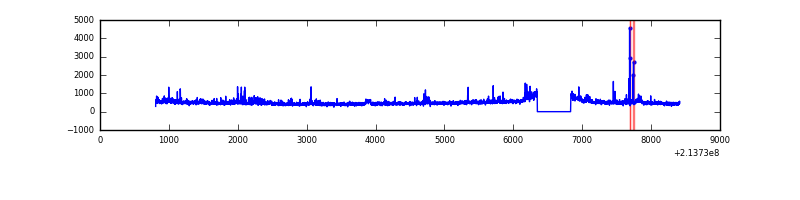 |
| C | 7607 | 7123 | 0 | 0 | 0.00% | 0.00% | 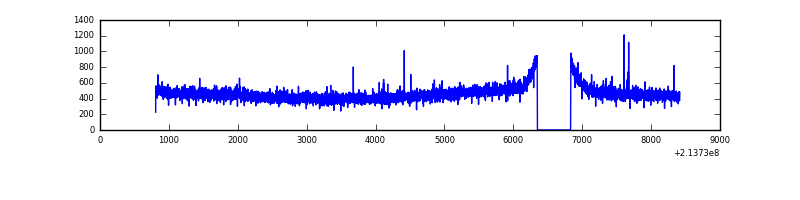 |
| D | 7607 | 7123 | 119 | 119 | 1.56% | 1.67% | 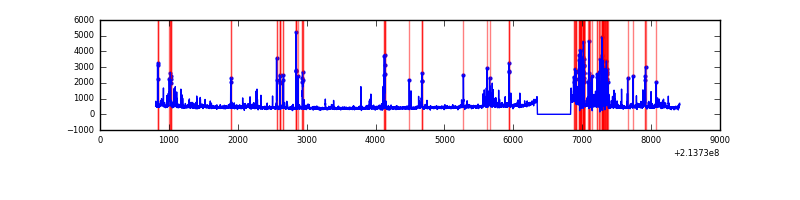 |
Top three noisy pixels from each quadrant. If the there are fewer than three noisy pixels in the level2.evt file, extra rows are filled as -1
| Pixel properties | Quadrant properties | ||||||
|---|---|---|---|---|---|---|---|
| Quadrant | DetID | PixID | Counts | Sigma | Mean | Median | Sigma |
| A | 0 | 50 | 25849 | 144.24 | 854 | 835 | 173.4 |
| A | 13 | 14 | 10573 | 56.15 | 854 | 835 | 173.4 |
| A | 12 | 194 | 8421 | 43.74 | 854 | 835 | 173.4 |
| B | 4 | 48 | 59547 | 356.56 | 861 | 840 | 164.6 |
| B | 0 | 219 | 52411 | 313.22 | 861 | 840 | 164.6 |
| B | 4 | 81 | 40773 | 242.54 | 861 | 840 | 164.6 |
| C | 12 | 4 | 6834 | 30.92 | 832 | 839 | 193.9 |
| C | 13 | 61 | 6752 | 30.5 | 832 | 839 | 193.9 |
| C | 1 | 16 | 3230 | 12.33 | 832 | 839 | 193.9 |
| D | 2 | 33 | 248630 | 1231.07 | 822 | 800 | 201.3 |
| D | 2 | 152 | 139308 | 688.03 | 822 | 800 | 201.3 |
| D | 13 | 105 | 131367 | 648.58 | 822 | 800 | 201.3 |
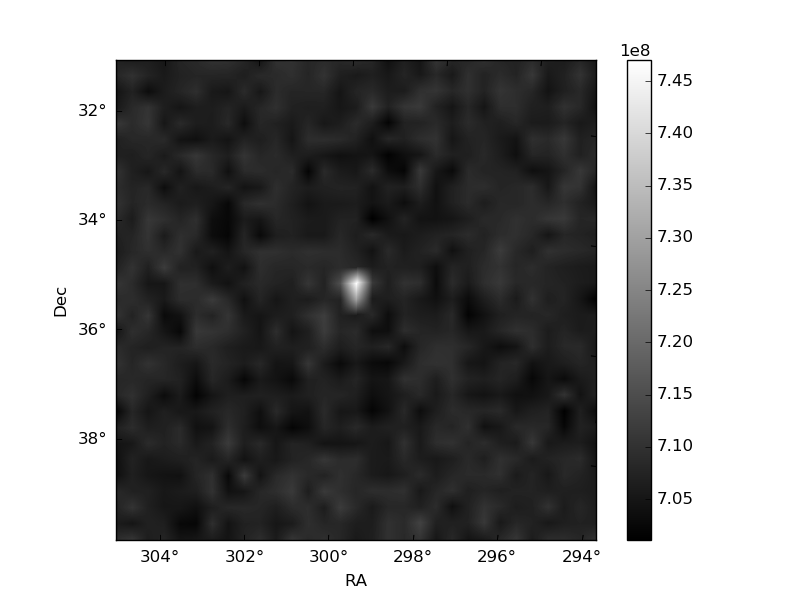
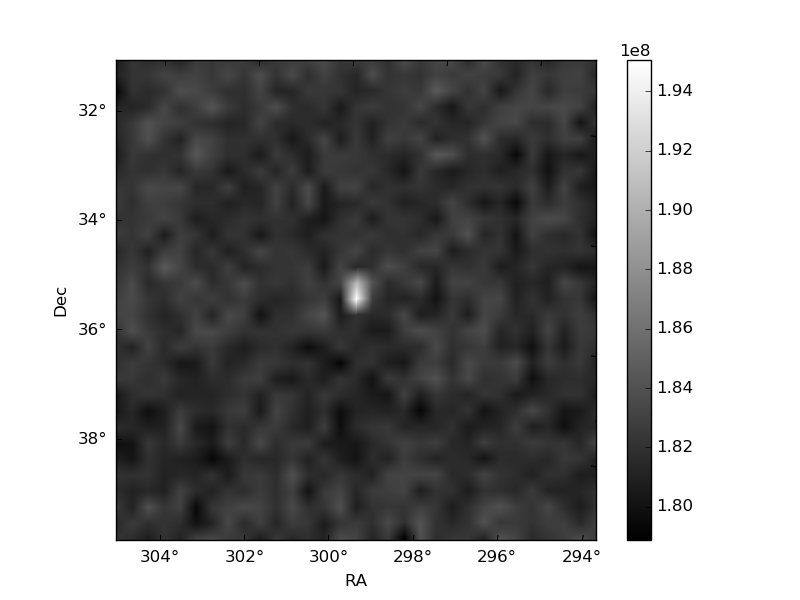
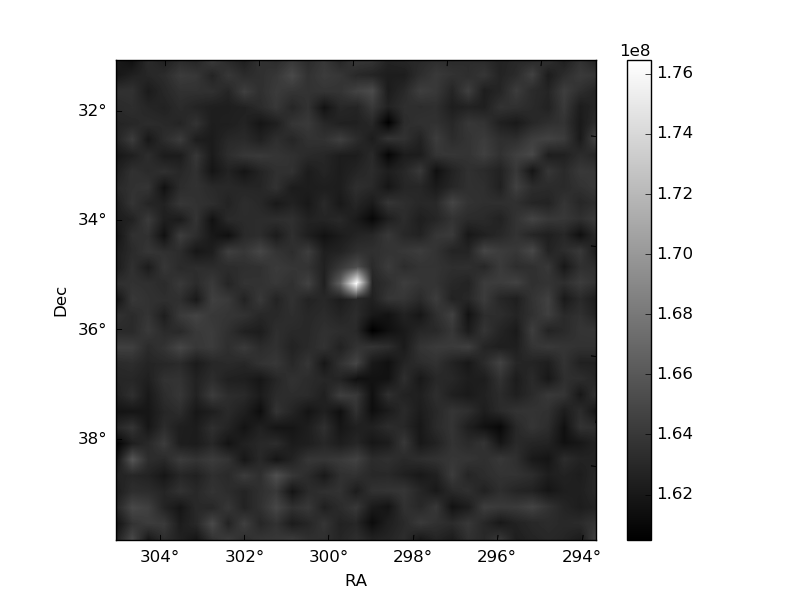
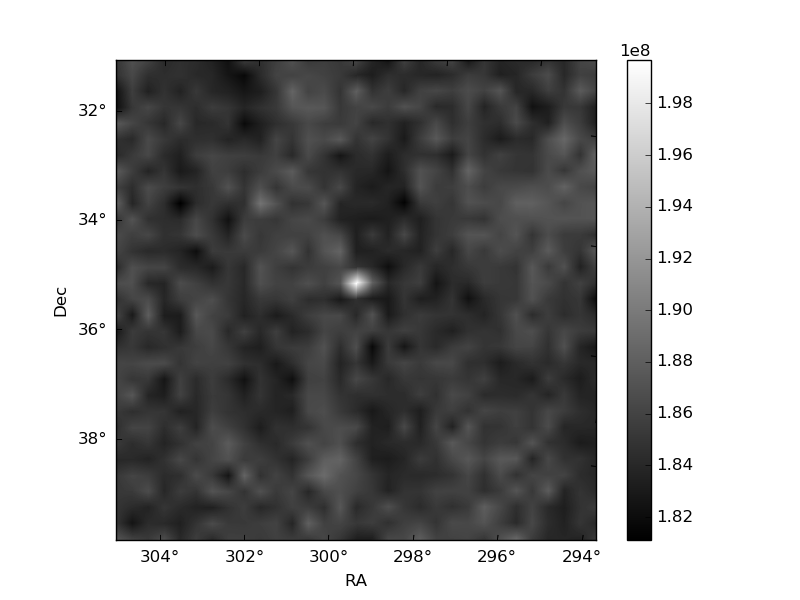
Histogram calculated using DETX and DETY for each event in the final _common_clean file
| Quadrant A | 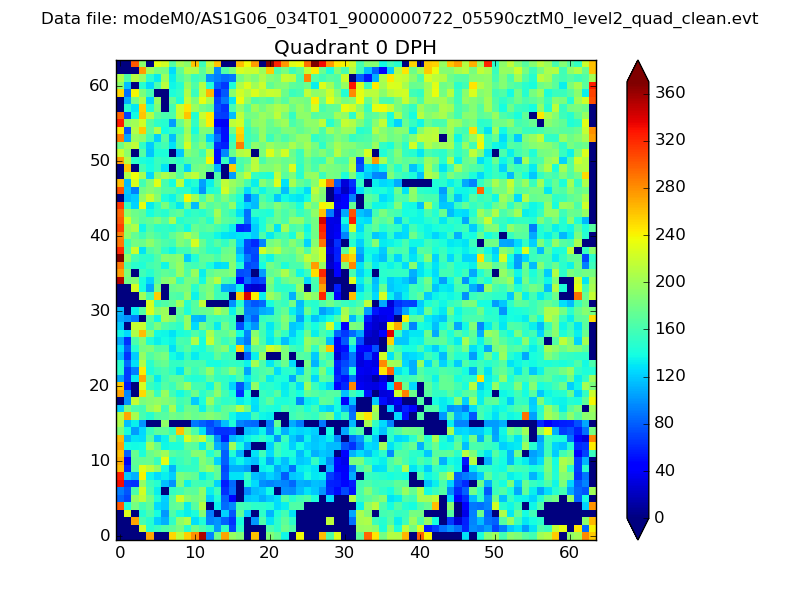 |
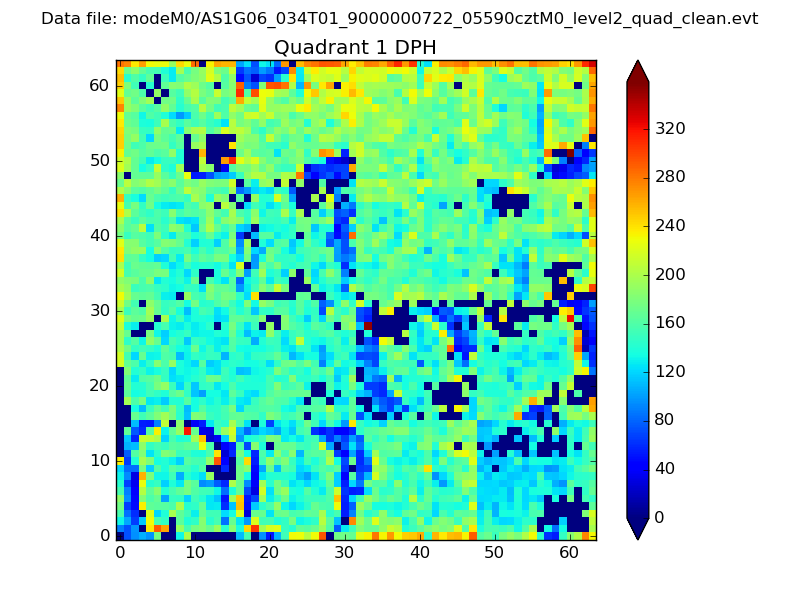 |
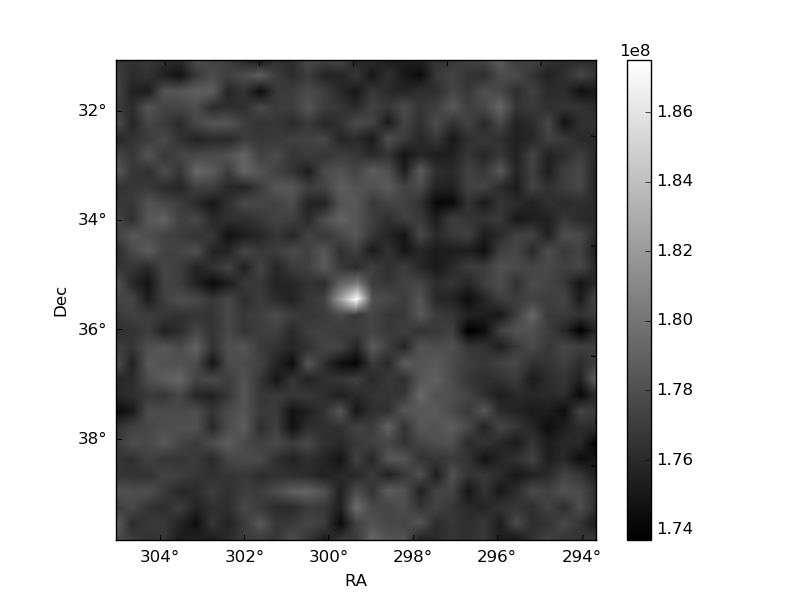
Quadrant B |
|---|---|---|---|
| Quadrant D | 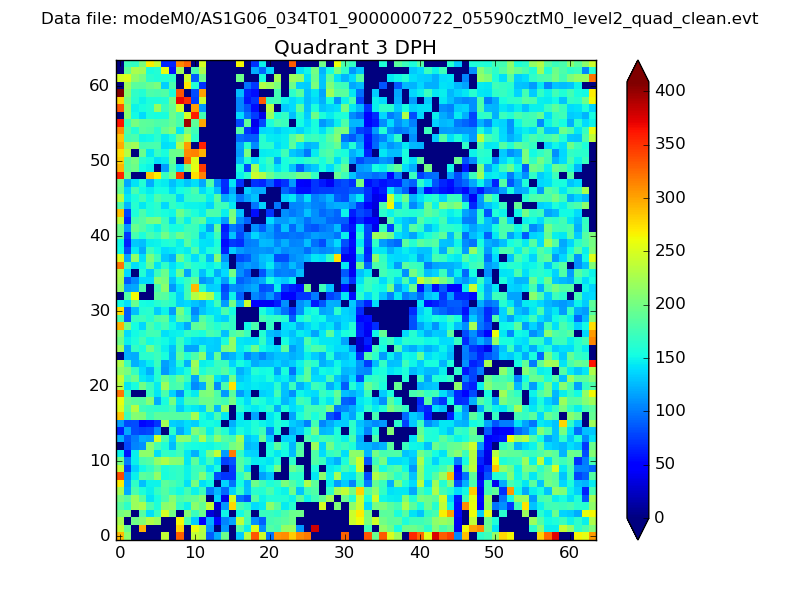 |
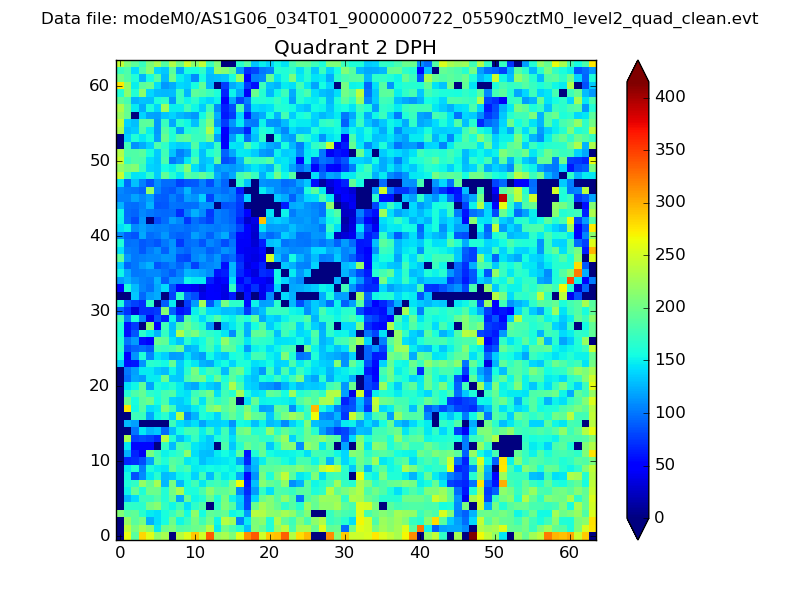 |
Quadrant C |
| Plot type | Count rate plots | Images |
|---|---|---|
| Comparison with Poisson distribution Blue bars denote a histogram of data divided into 1 sec bins. Red curve is a Poisson curve with rate = median count rate of data. |
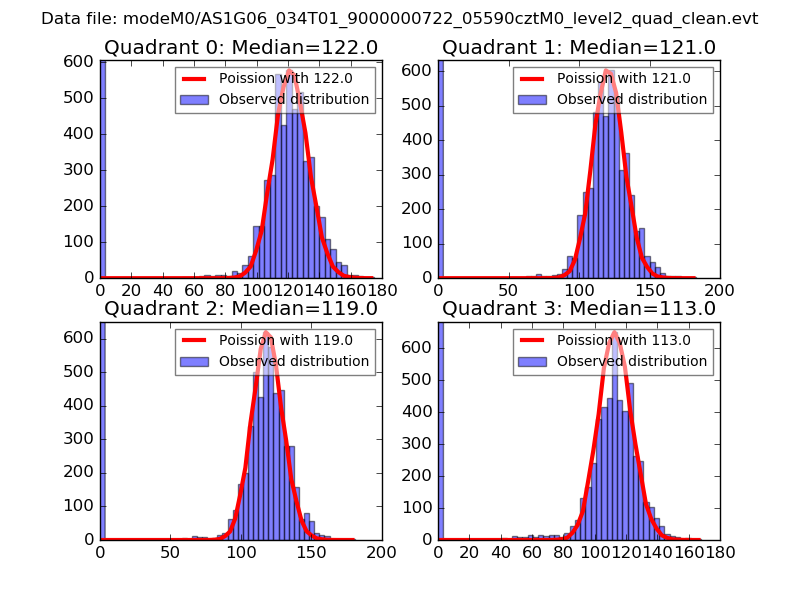 |
 |
| Quadrant-wise count rates Data is divided into 100 sec bins |
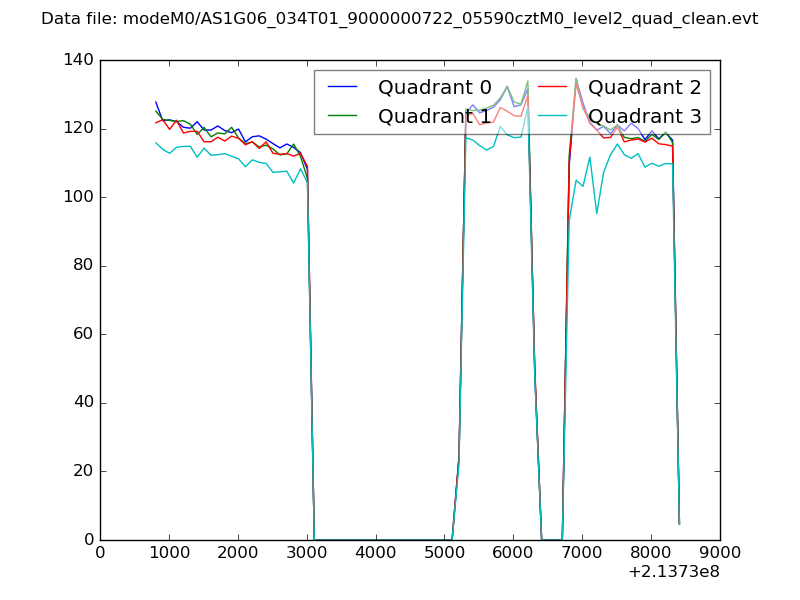 |
|
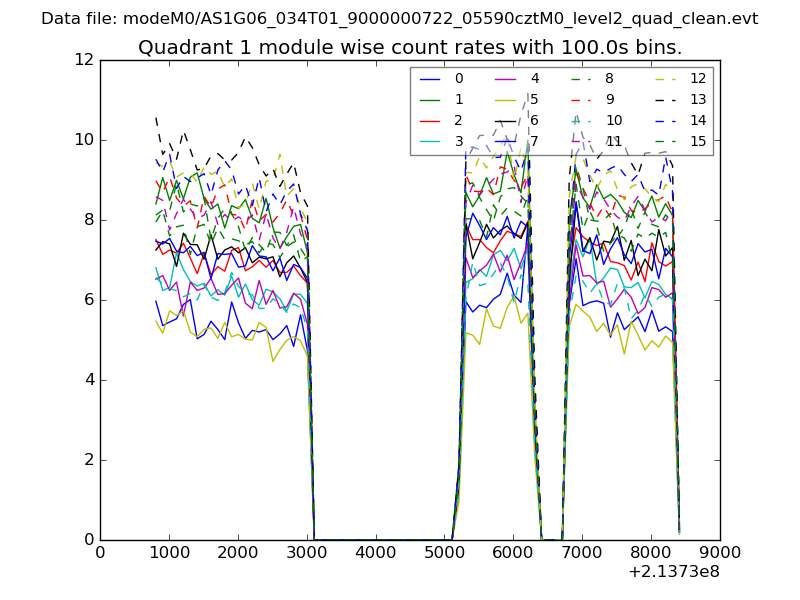
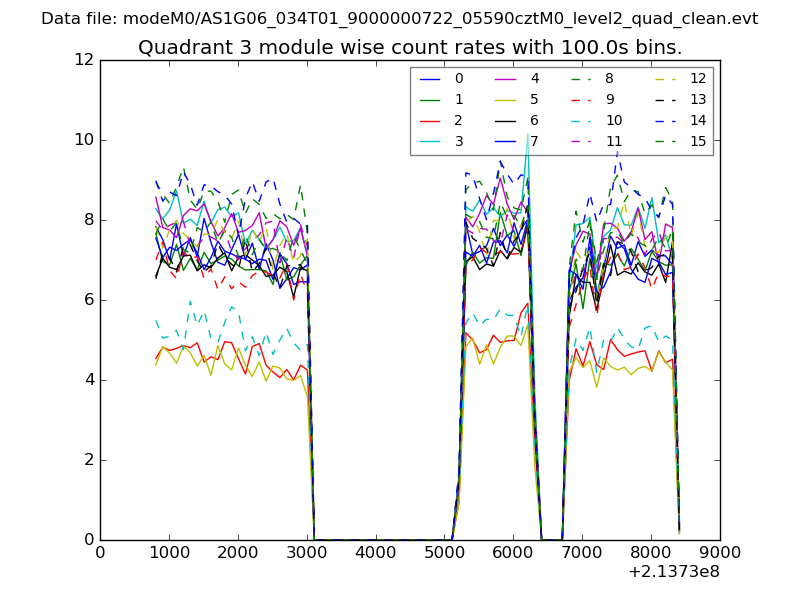
| Module-wise count rates for Quadrant A Data is divided into 100 sec bins |
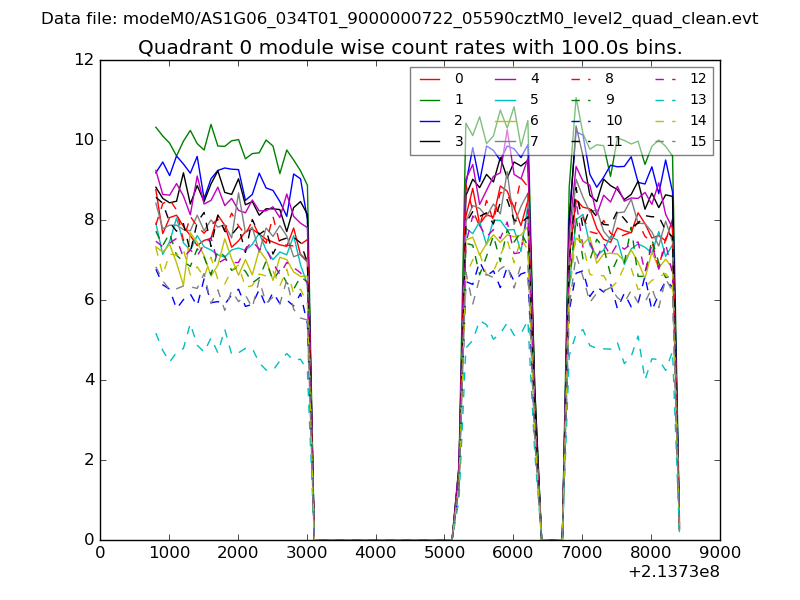 |
 |
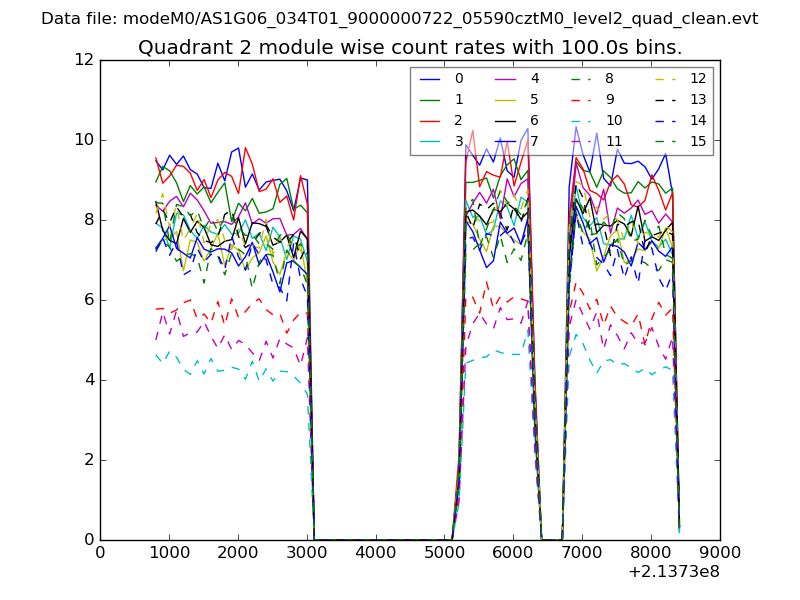
| Module-wise count rates for Quadrant B Data is divided into 100 sec bins |
 |
 |
| Module-wise count rates for Quadrant C Data is divided into 100 sec bins |
 |
 |
| Module-wise count rates for Quadrant D Data is divided into 100 sec bins |
 |
 |
| Parameter | Plot |
|---|---|
| CZT HV Monitor | 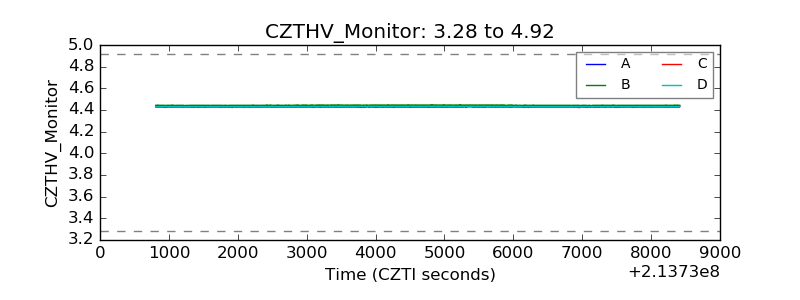 |
| D_VDD | 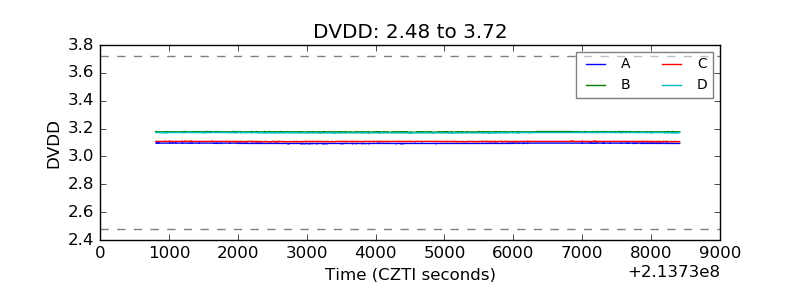 |
| Temperature 1 | 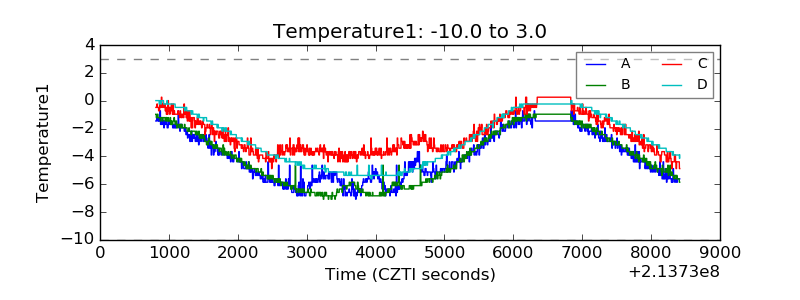 |
| Veto HV Monitor |  |
| Veto LLD | 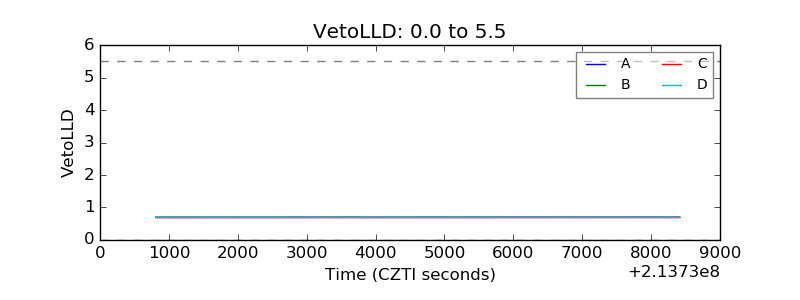 |
| Alpha Counter | 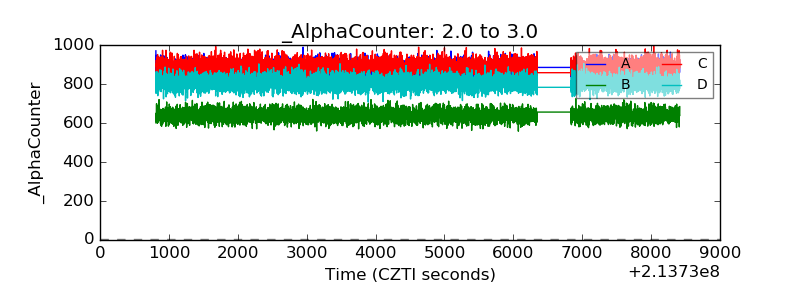 |
| _CPM_Rate | 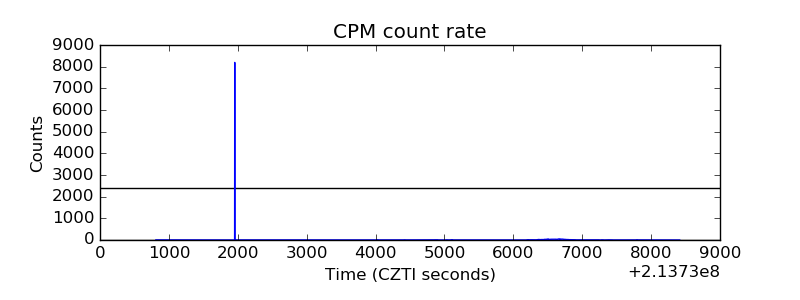 |
| CZT Counter | 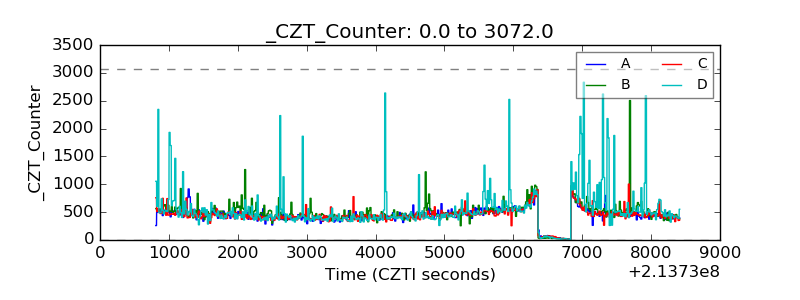 |
| +2.5 Volts monitor |  |
| +5 Volts monitor |  |
| _ROLL_ROT | 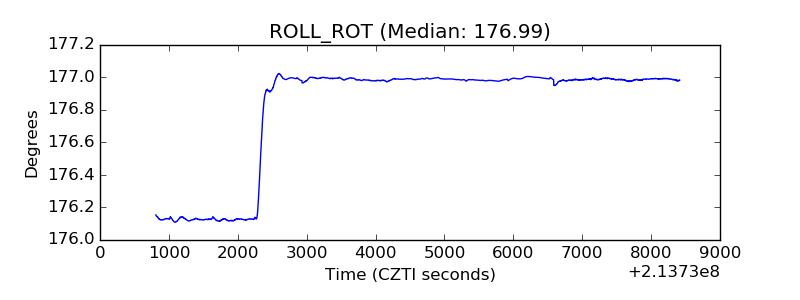 |
| _Roll_DEC | 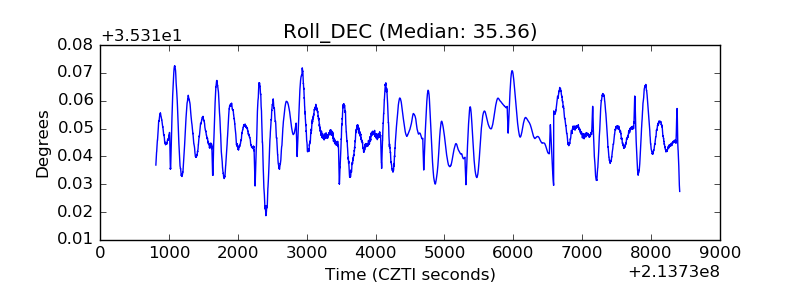 |
| _Roll_RA | 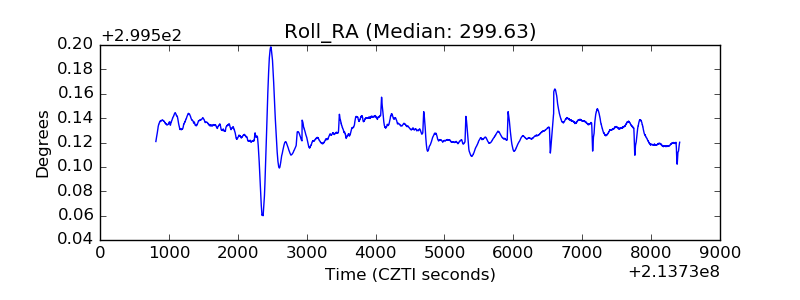 |
| Veto Counter | 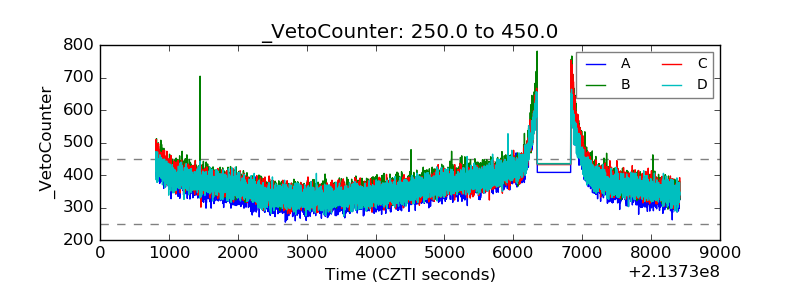 |