| Param | Original file | Final file |
|---|---|---|
| Filename | modeM0/AS1G06_034T01_9000000722_05591cztM0_level2.evt | modeM0/AS1G06_034T01_9000000722_05591cztM0_level2_quad_clean.evt |
| Size (bytes) | 533,629,440 | 104,860,800 |
| Size | 508.9 MB | 100.0 MB |
| Events in quadrant A | 3,840,735 | 667,524 |
| Events in quadrant B | 3,928,579 | 675,336 |
| Events in quadrant C | 3,603,415 | 664,102 |
| Events in quadrant D | 4,261,601 | 629,121 |
| Mode M9 | |||
|---|---|---|---|
| Quadrant | BADHDUFLAG | Total packets | Discarded packets |
| A | 0 | 8 | 0 |
| B | 0 | 8 | 0 |
| C | 0 | 8 | 0 |
| D | 0 | 8 | 0 |
| Mode M0 | |||
|---|---|---|---|
| Quadrant | BADHDUFLAG | Total packets | Discarded packets |
| A | 0 | 16752 | 3 |
| B | 0 | 16948 | 2 |
| C | 0 | 16102 | 2 |
| D | 0 | 18096 | 2 |
| Mode SS | |||
|---|---|---|---|
| Quadrant | BADHDUFLAG | Total packets | Discarded packets |
| A | 0 | 160 | 0 |
| B | 0 | 160 | 0 |
| C | 0 | 160 | 0 |
| D | 0 | 160 | 0 |
| Quadrant | Total seconds | Saturated seconds | Saturation percentage |
|---|---|---|---|
| A | 7760 | 194 | 2.500000% |
| B | 7760 | 160 | 2.061856% |
| C | 7760 | 60 | 0.773196% |
| D | 7760 | 205 | 2.641753% |
Noise dominated data is calculated using 1-second bins in cleaned event files. If a bin has >2000 counts, and if more than 50% of those come from <1% of pixels, then it is considered to be noise-dominated and hence unusable.
| Quadrant | # 1 sec bins | Bins with >0 counts | Bins with >2000 counts | High rate bins dominated by noise | Noise dominated (total time) | Noise dominated (detector-on time) | Marked lightcurve |
|---|---|---|---|---|---|---|---|
| A | 8440 | 7763 | 63 | 63 | 0.75% | 0.81% | 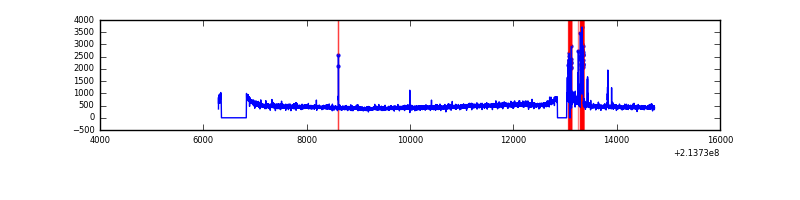 |
| B | 8440 | 7763 | 8 | 8 | 0.09% | 0.10% | 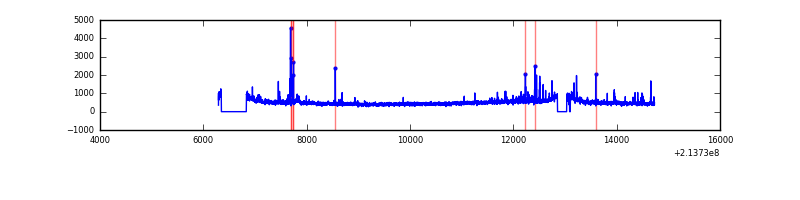 |
| C | 8440 | 7763 | 0 | 0 | 0.00% | 0.00% | 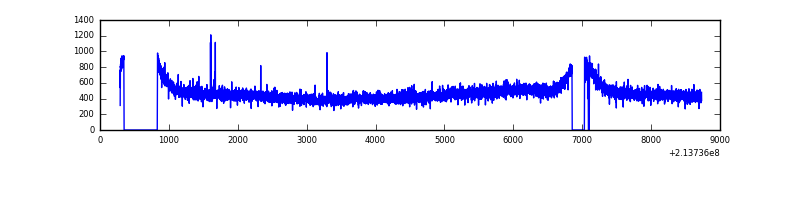 |
| D | 8440 | 7763 | 101 | 101 | 1.20% | 1.30% | 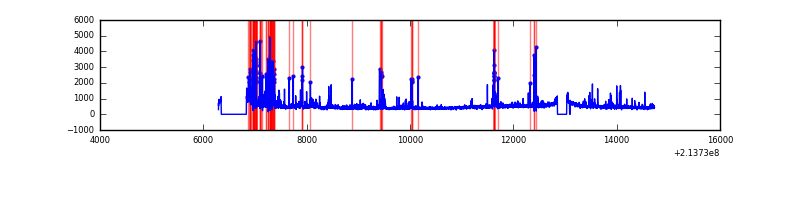 |
Top three noisy pixels from each quadrant. If the there are fewer than three noisy pixels in the level2.evt file, extra rows are filled as -1
| Pixel properties | Quadrant properties | ||||||
|---|---|---|---|---|---|---|---|
| Quadrant | DetID | PixID | Counts | Sigma | Mean | Median | Sigma |
| A | 14 | 111 | 209821 | 1095.11 | 932 | 913 | 190.8 |
| A | 0 | 50 | 25956 | 131.28 | 932 | 913 | 190.8 |
| A | 13 | 14 | 10366 | 49.55 | 932 | 913 | 190.8 |
| B | 0 | 219 | 59570 | 322.14 | 950 | 930 | 182.0 |
| B | 15 | 54 | 37886 | 203.02 | 950 | 930 | 182.0 |
| B | 0 | 214 | 33677 | 179.89 | 950 | 930 | 182.0 |
| C | 13 | 61 | 7350 | 30.02 | 919 | 924 | 214.1 |
| C | 12 | 4 | 6123 | 24.29 | 919 | 924 | 214.1 |
| C | 8 | 128 | 5311 | 20.49 | 919 | 924 | 214.1 |
| D | 2 | 33 | 176942 | 780.15 | 911 | 884 | 225.7 |
| D | 2 | 152 | 161120 | 710.04 | 911 | 884 | 225.7 |
| D | 13 | 105 | 127143 | 559.48 | 911 | 884 | 225.7 |
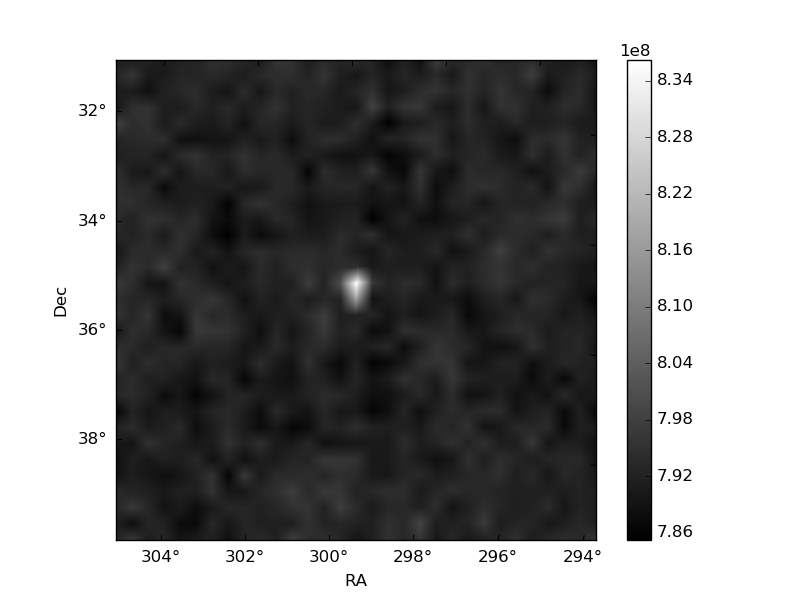
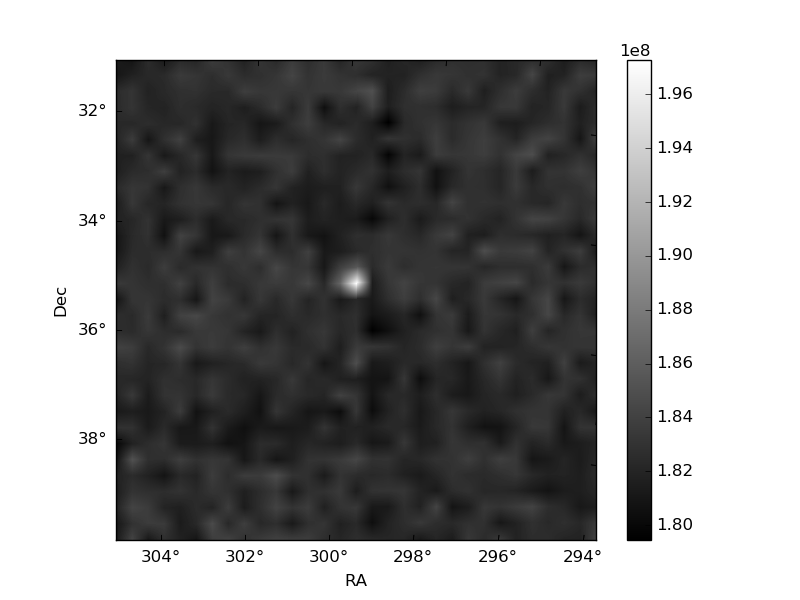
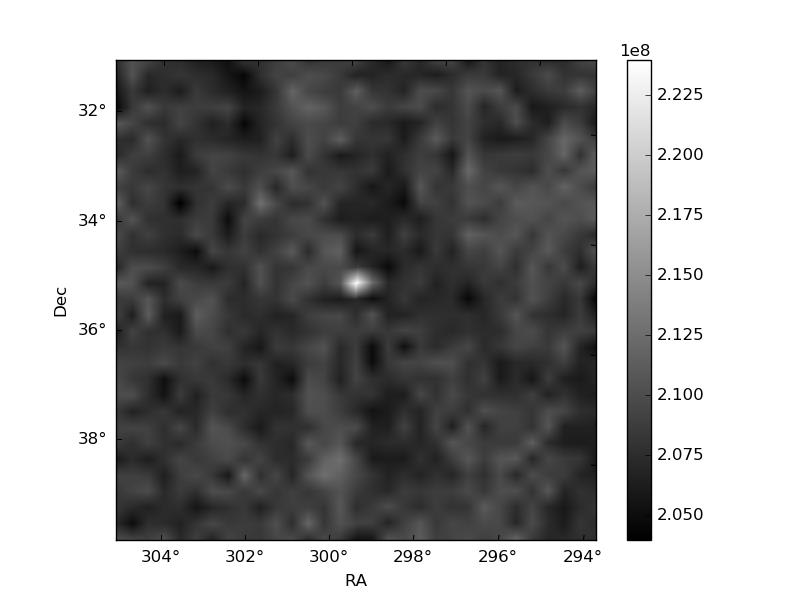
Histogram calculated using DETX and DETY for each event in the final _common_clean file
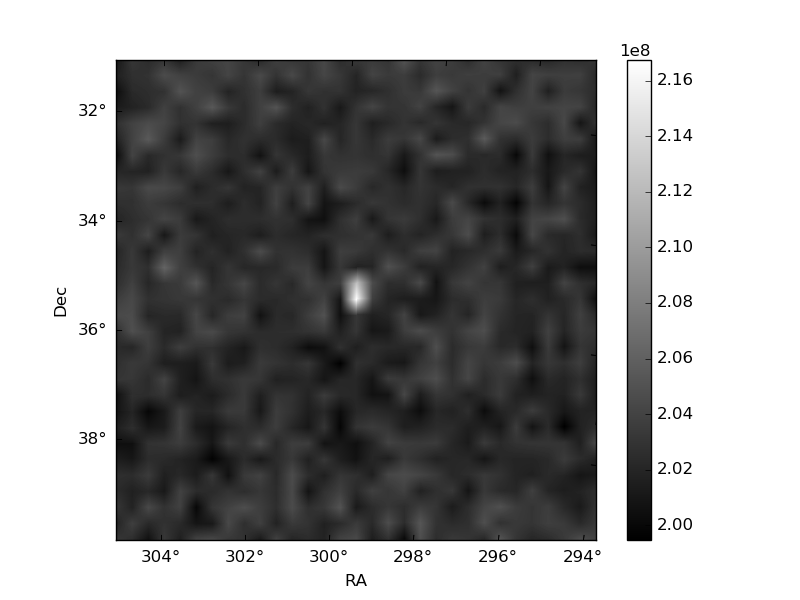
| Quadrant A | 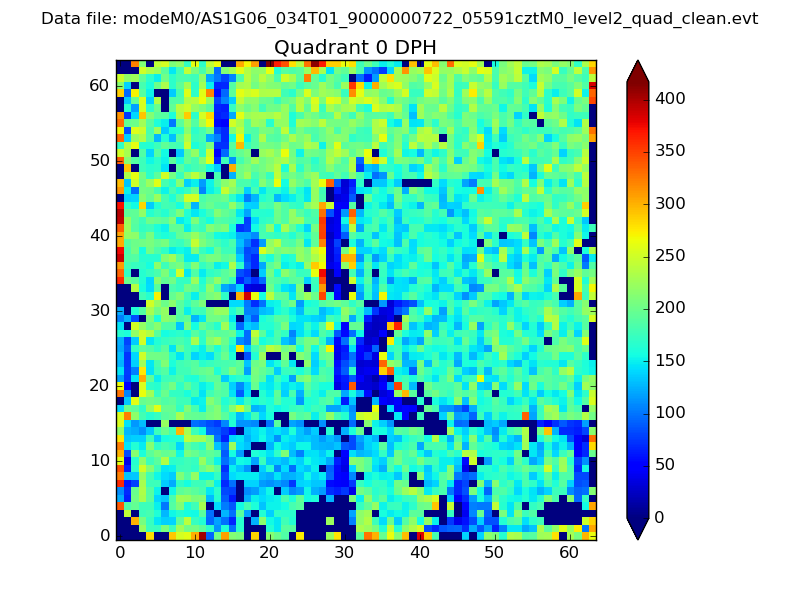 |
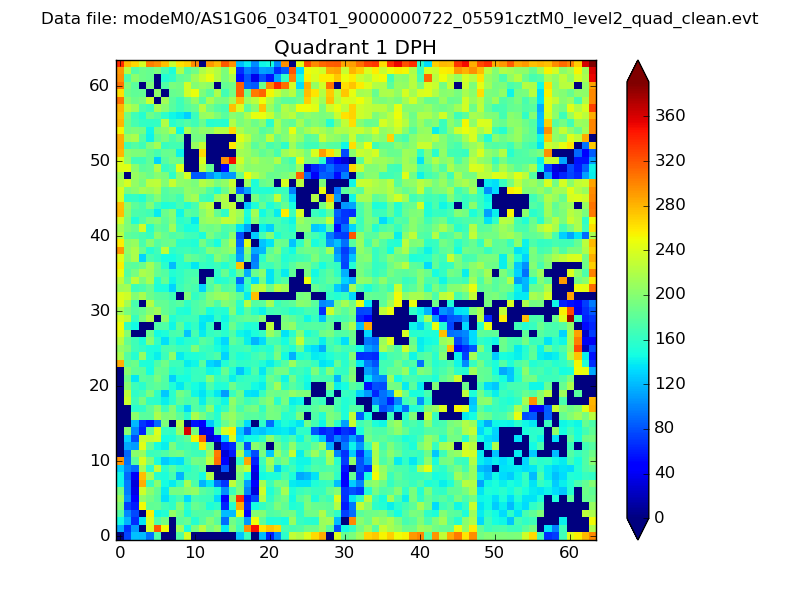 |
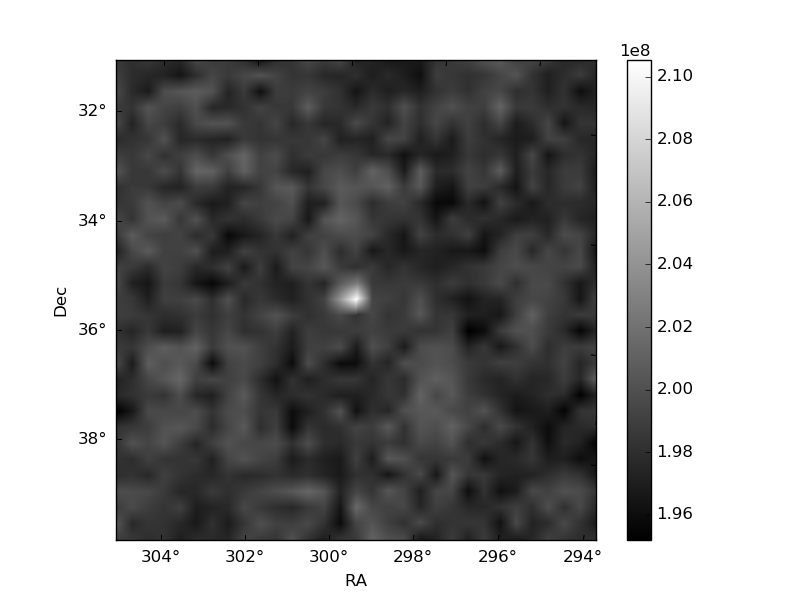
Quadrant B |
|---|---|---|---|
| Quadrant D | 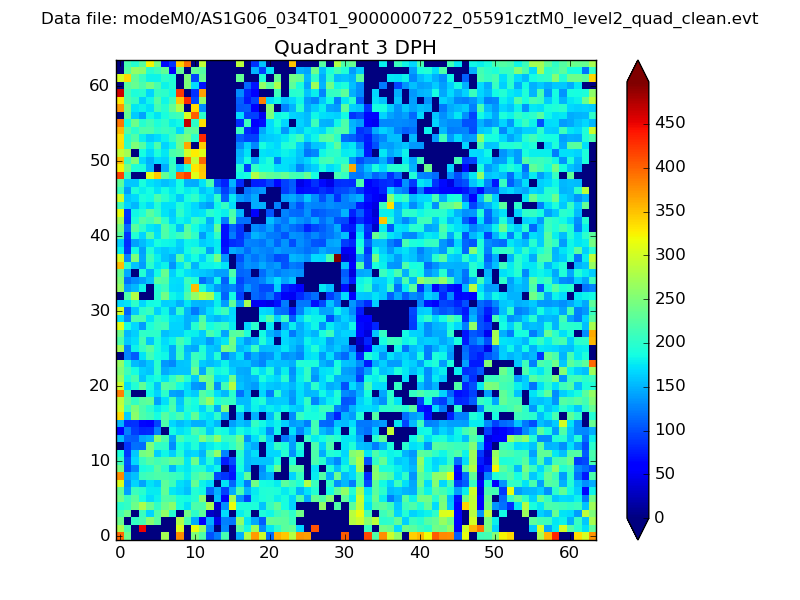 |
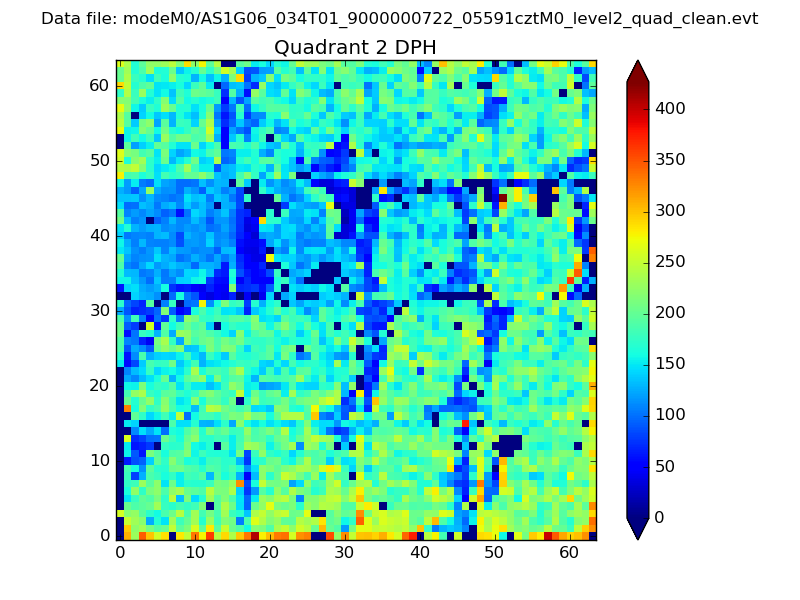 |
Quadrant C |
| Plot type | Count rate plots | Images |
|---|---|---|
| Comparison with Poisson distribution Blue bars denote a histogram of data divided into 1 sec bins. Red curve is a Poisson curve with rate = median count rate of data. |
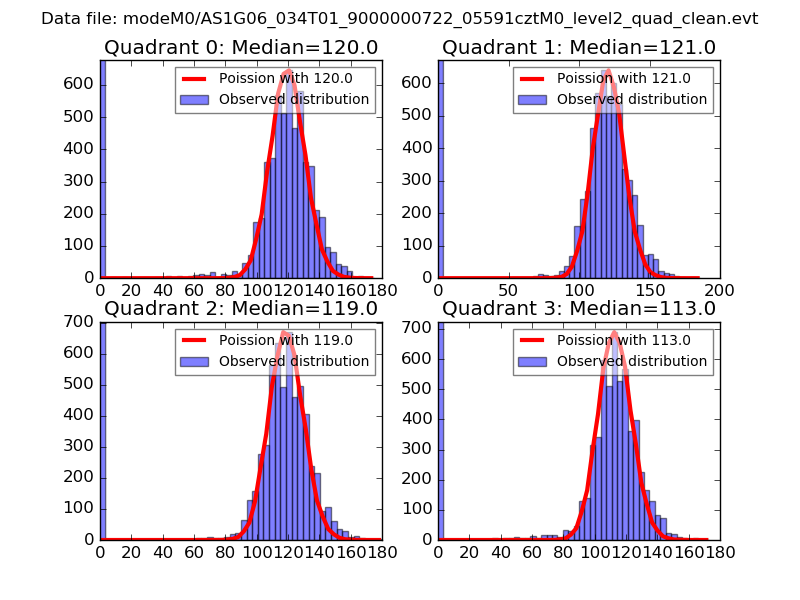 |
 |
| Quadrant-wise count rates Data is divided into 100 sec bins |
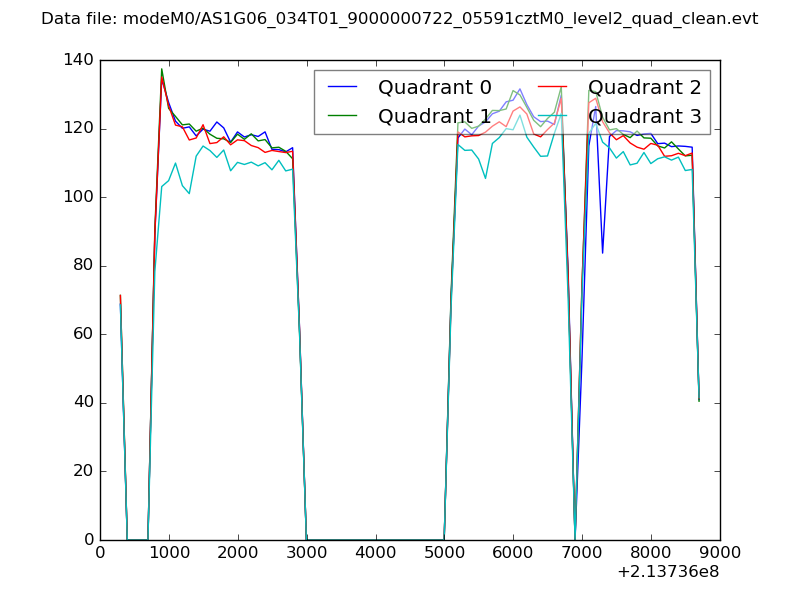 |
|
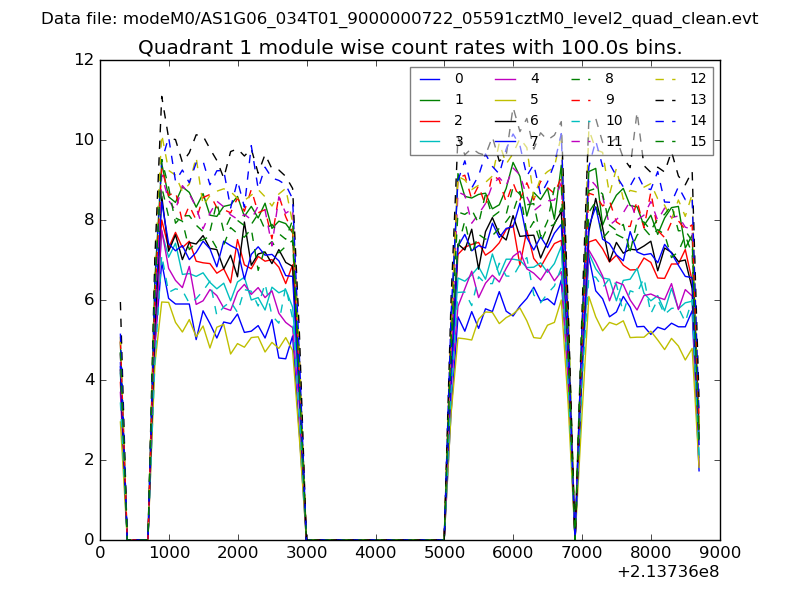
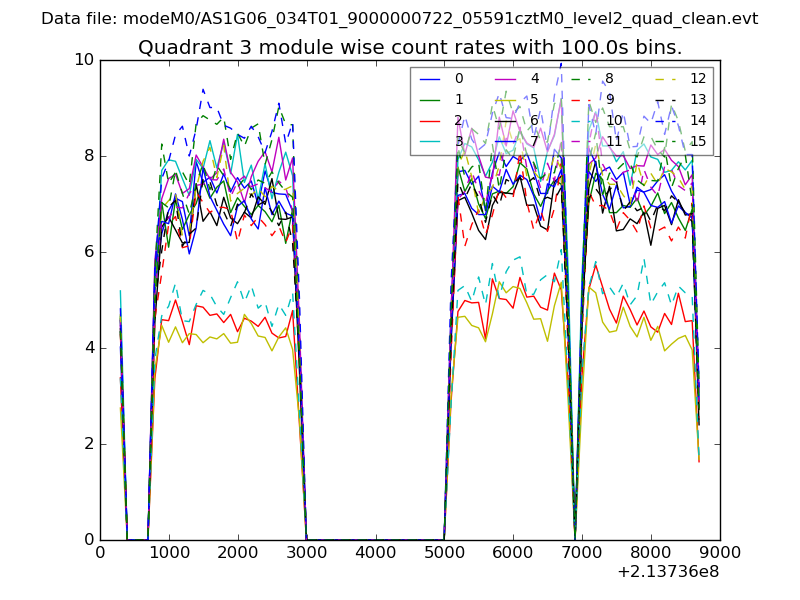
| Module-wise count rates for Quadrant A Data is divided into 100 sec bins |
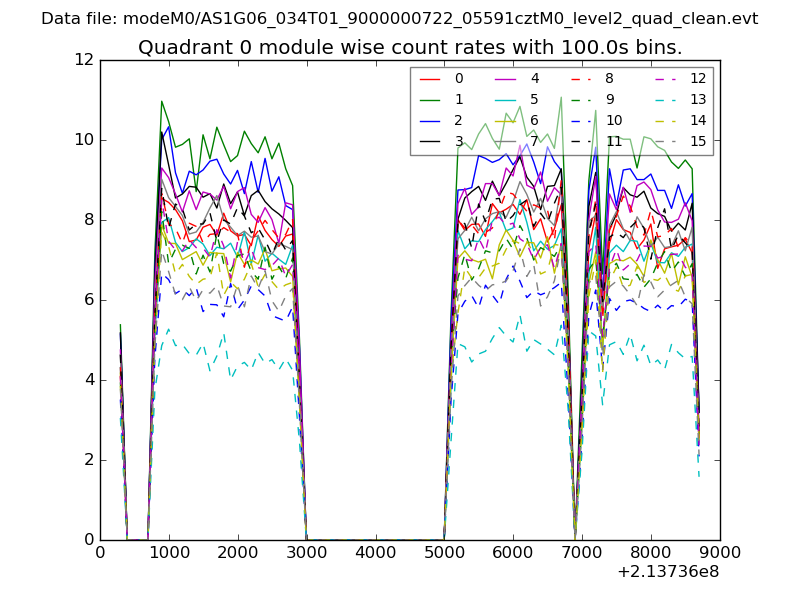 |
 |
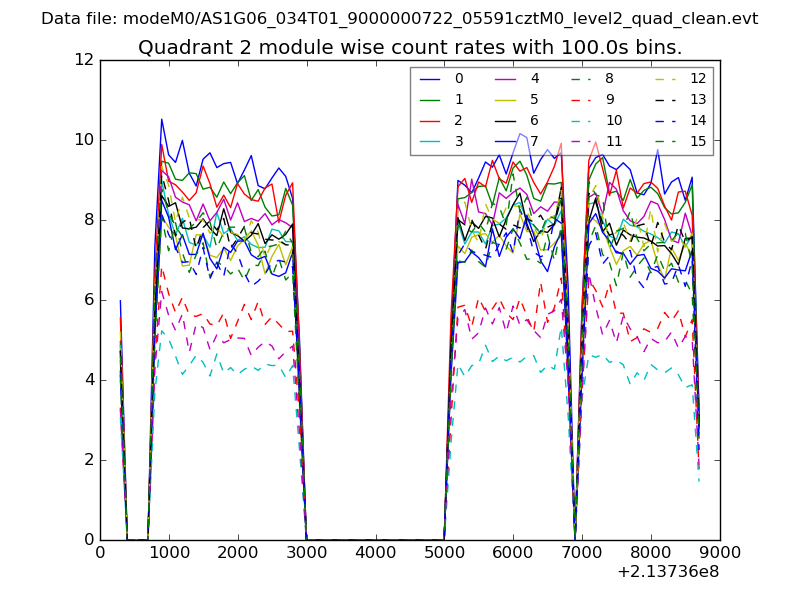
| Module-wise count rates for Quadrant B Data is divided into 100 sec bins |
 |
 |
| Module-wise count rates for Quadrant C Data is divided into 100 sec bins |
 |
 |
| Module-wise count rates for Quadrant D Data is divided into 100 sec bins |
 |
 |
| Parameter | Plot |
|---|---|
| CZT HV Monitor | 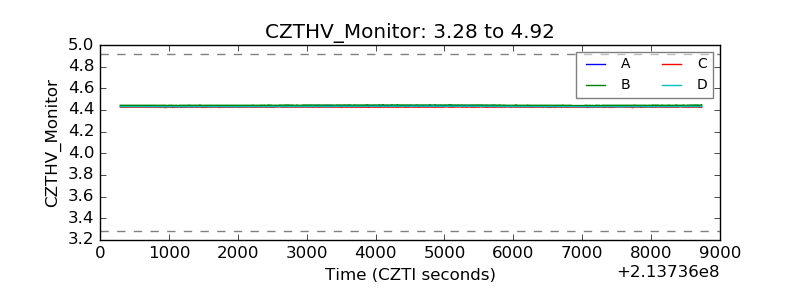 |
| D_VDD | 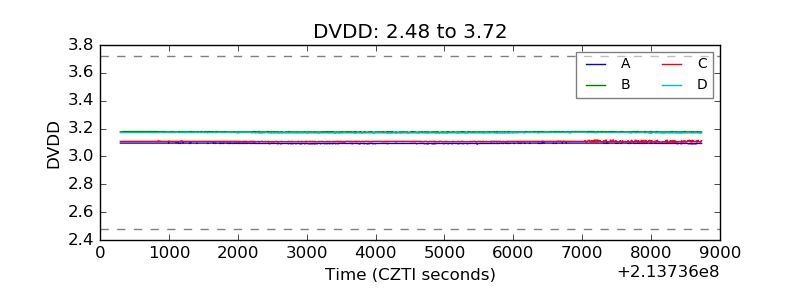 |
| Temperature 1 | 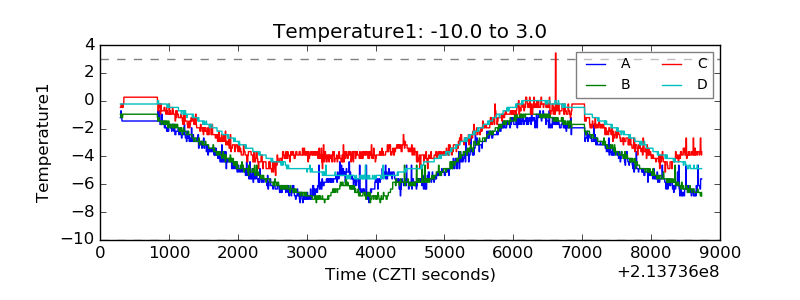 |
| Veto HV Monitor | 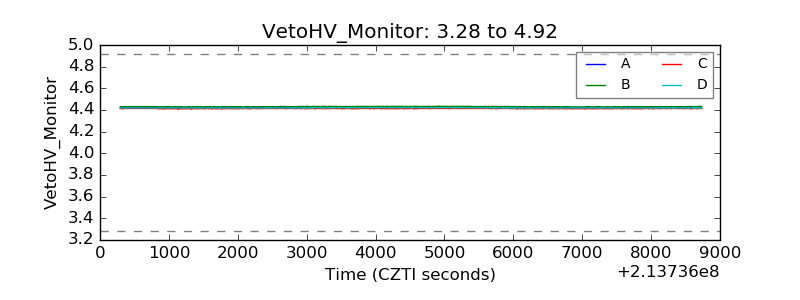 |
| Veto LLD | 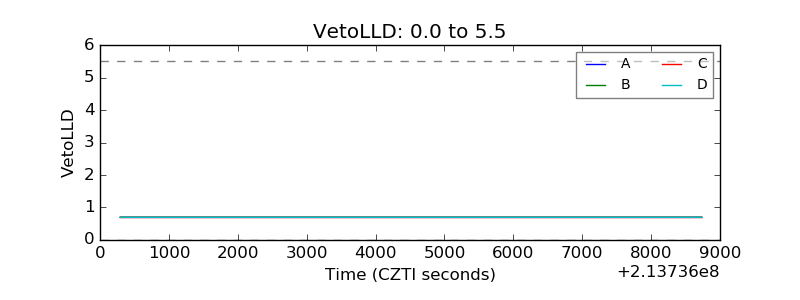 |
| Alpha Counter |  |
| _CPM_Rate | 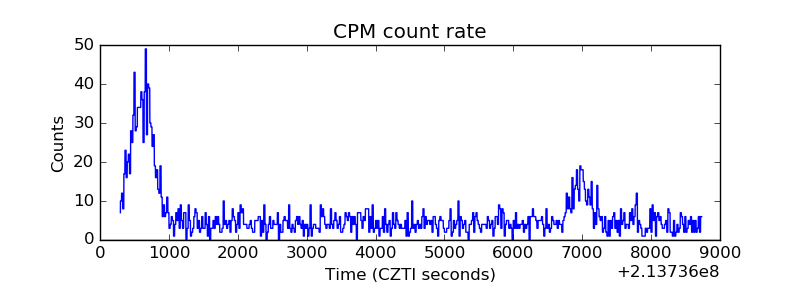 |
| CZT Counter | 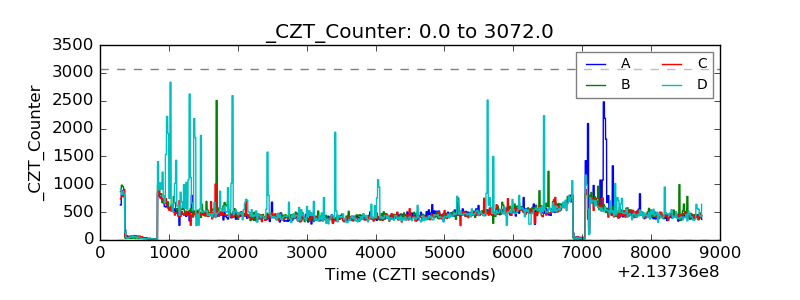 |
| +2.5 Volts monitor |  |
| +5 Volts monitor |  |
| _ROLL_ROT | 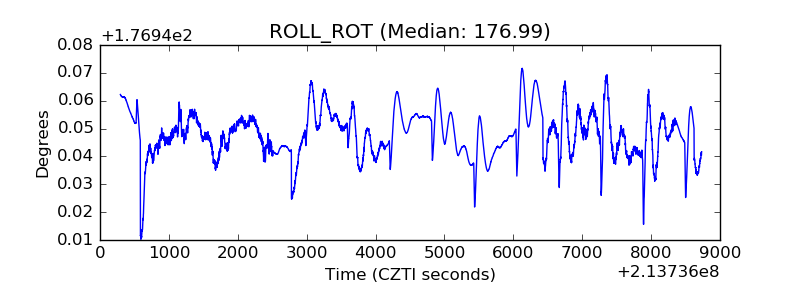 |
| _Roll_DEC | 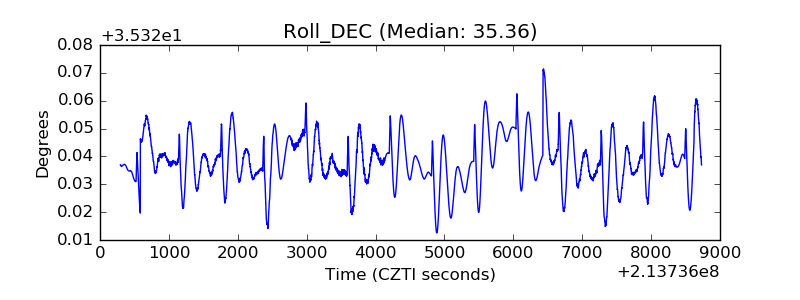 |
| _Roll_RA | 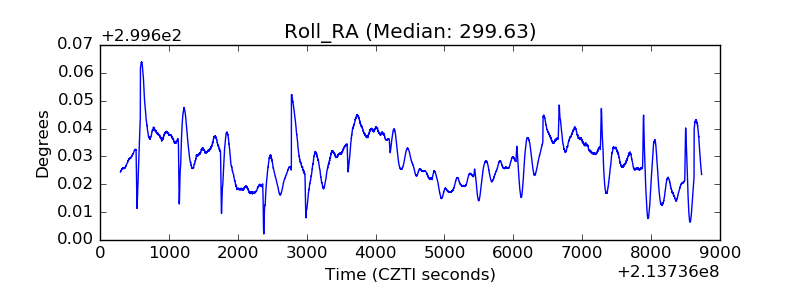 |
| Veto Counter | 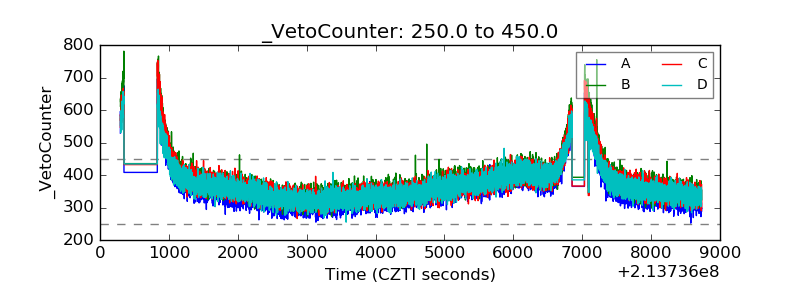 |