| Param | Original file | Final file |
|---|---|---|
| Filename | modeM0/AS1G06_034T01_9000000722_05592cztM0_level2.evt | modeM0/AS1G06_034T01_9000000722_05592cztM0_level2_quad_clean.evt |
| Size (bytes) | 559,408,320 | 99,936,000 |
| Size | 533.5 MB | 95.3 MB |
| Events in quadrant A | 4,005,589 | 627,818 |
| Events in quadrant B | 3,946,809 | 635,801 |
| Events in quadrant C | 3,626,816 | 627,107 |
| Events in quadrant D | 4,834,328 | 594,235 |
| Mode M9 | |||
|---|---|---|---|
| Quadrant | BADHDUFLAG | Total packets | Discarded packets |
| A | 0 | 6 | 0 |
| B | 0 | 6 | 0 |
| C | 0 | 6 | 0 |
| D | 0 | 6 | 0 |
| Mode M0 | |||
|---|---|---|---|
| Quadrant | BADHDUFLAG | Total packets | Discarded packets |
| A | 0 | 17325 | 3 |
| B | 0 | 17054 | 2 |
| C | 0 | 16183 | 2 |
| D | 0 | 19727 | 2 |
| Mode SS | |||
|---|---|---|---|
| Quadrant | BADHDUFLAG | Total packets | Discarded packets |
| A | 0 | 160 | 0 |
| B | 0 | 160 | 0 |
| C | 0 | 160 | 0 |
| D | 0 | 160 | 0 |
| Quadrant | Total seconds | Saturated seconds | Saturation percentage |
|---|---|---|---|
| A | 7790 | 237 | 3.042362% |
| B | 7790 | 135 | 1.732991% |
| C | 7790 | 61 | 0.783055% |
| D | 7790 | 147 | 1.887035% |
Noise dominated data is calculated using 1-second bins in cleaned event files. If a bin has >2000 counts, and if more than 50% of those come from <1% of pixels, then it is considered to be noise-dominated and hence unusable.
| Quadrant | # 1 sec bins | Bins with >0 counts | Bins with >2000 counts | High rate bins dominated by noise | Noise dominated (total time) | Noise dominated (detector-on time) | Marked lightcurve |
|---|---|---|---|---|---|---|---|
| A | 8315 | 7793 | 101 | 101 | 1.21% | 1.30% | 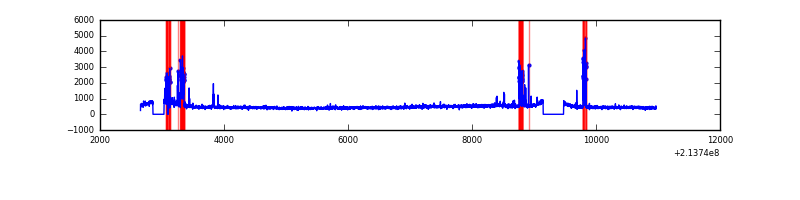 |
| B | 8315 | 7793 | 10 | 10 | 0.12% | 0.13% | 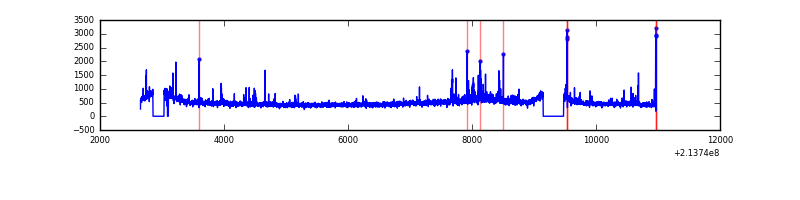 |
| C | 8315 | 7793 | 0 | 0 | 0.00% | 0.00% |  |
| D | 8315 | 7793 | 59 | 59 | 0.71% | 0.76% |  |
Top three noisy pixels from each quadrant. If the there are fewer than three noisy pixels in the level2.evt file, extra rows are filled as -1
| Pixel properties | Quadrant properties | ||||||
|---|---|---|---|---|---|---|---|
| Quadrant | DetID | PixID | Counts | Sigma | Mean | Median | Sigma |
| A | 14 | 111 | 209685 | 1097.52 | 927 | 908 | 190.2 |
| A | 0 | 50 | 112937 | 588.92 | 927 | 908 | 190.2 |
| A | 15 | 174 | 92992 | 484.08 | 927 | 908 | 190.2 |
| B | 10 | 245 | 73430 | 402.1 | 947 | 926 | 180.3 |
| B | 15 | 204 | 45658 | 248.08 | 947 | 926 | 180.3 |
| B | 0 | 214 | 36632 | 198.02 | 947 | 926 | 180.3 |
| C | 1 | 16 | 19626 | 87.85 | 916 | 924 | 212.9 |
| C | 8 | 128 | 16396 | 72.68 | 916 | 924 | 212.9 |
| C | 8 | 112 | 7791 | 32.26 | 916 | 924 | 212.9 |
| D | 11 | 241 | 954485 | 4193.4 | 915 | 886 | 227.4 |
| D | 2 | 63 | 147884 | 646.42 | 915 | 886 | 227.4 |
| D | 2 | 136 | 63722 | 276.32 | 915 | 886 | 227.4 |
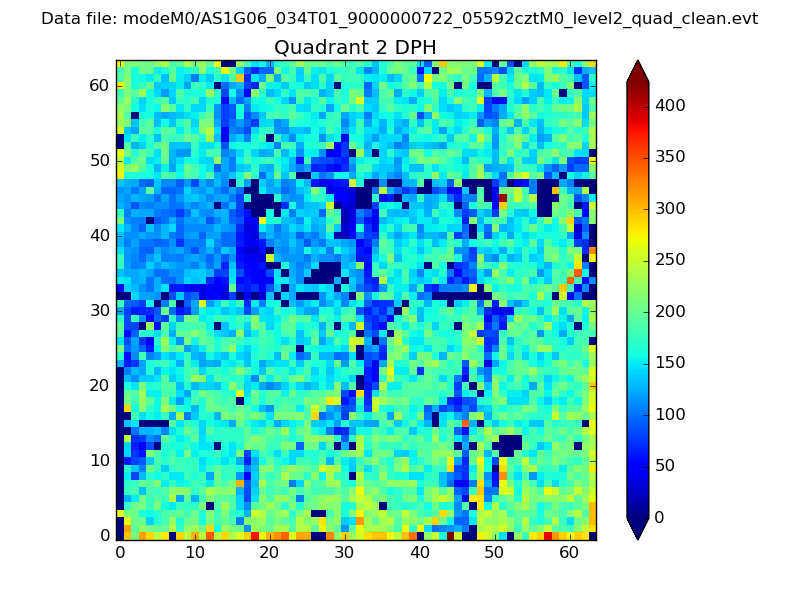
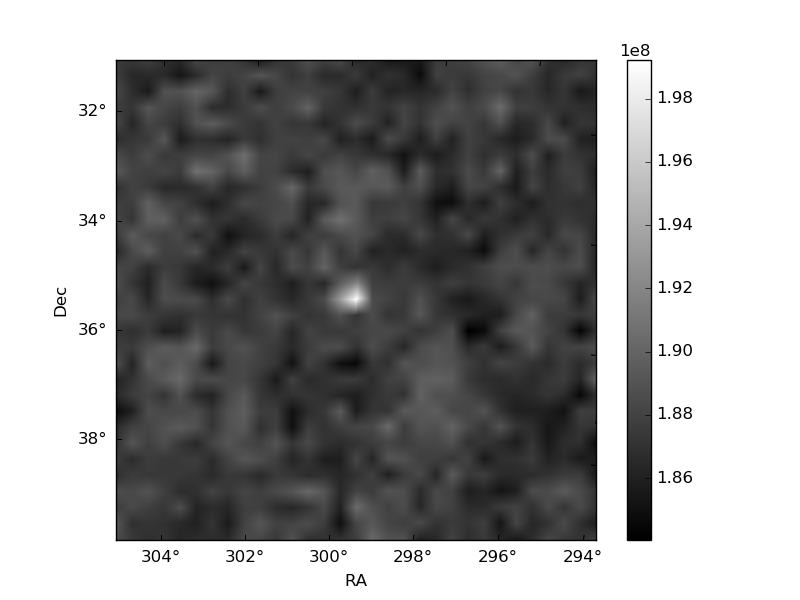
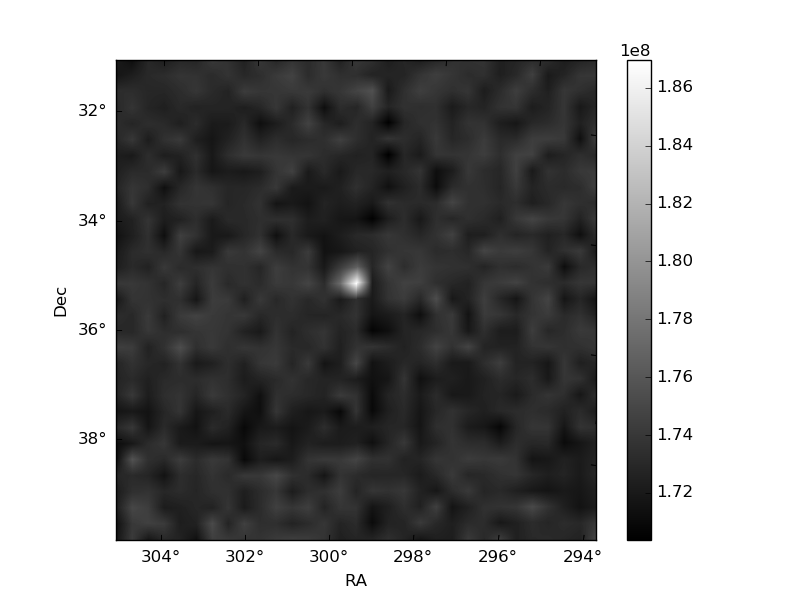
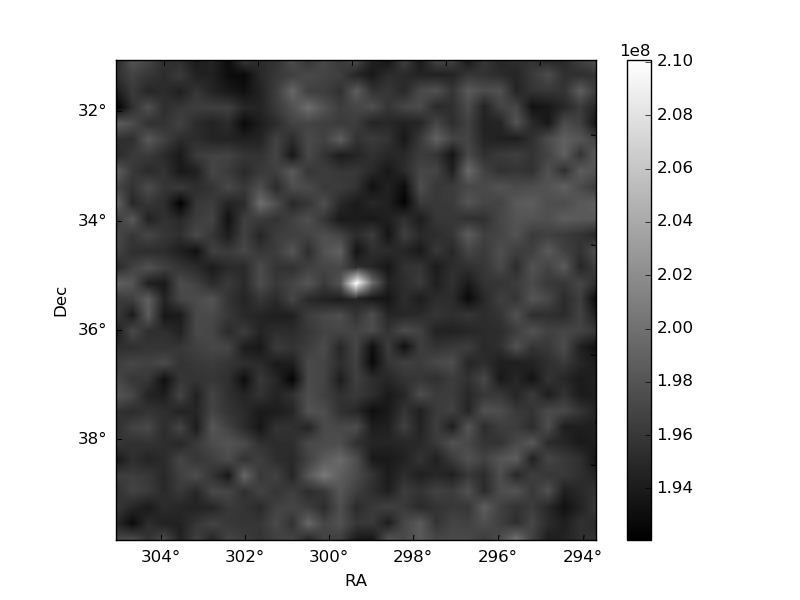
Histogram calculated using DETX and DETY for each event in the final _common_clean file
| Quadrant A | 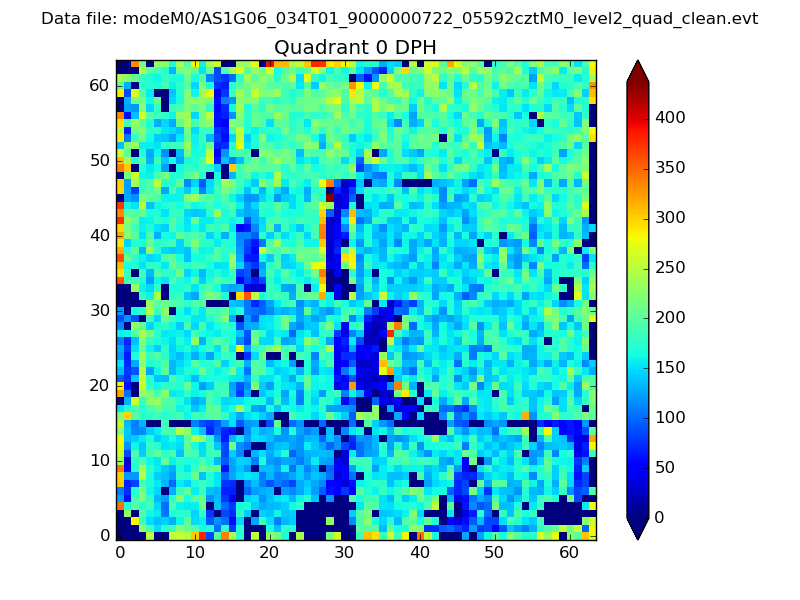 |
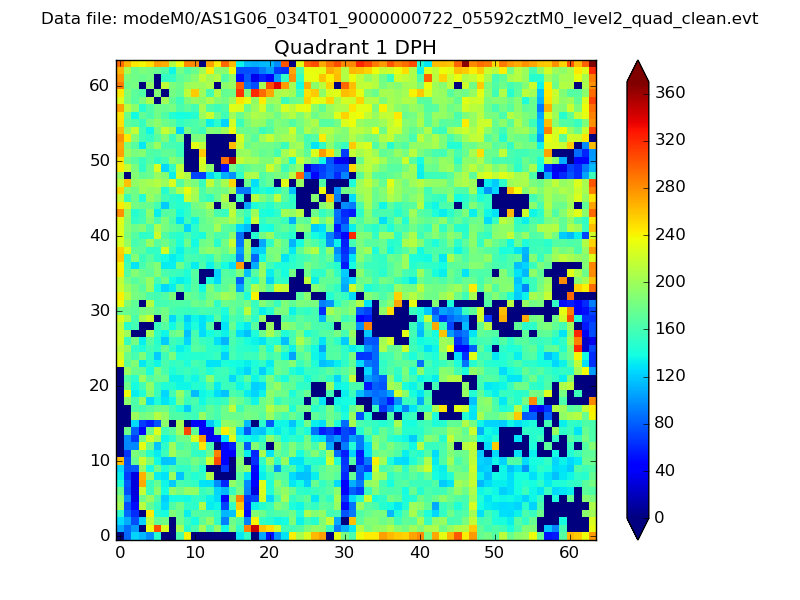 |
Quadrant B |
|---|---|---|---|
| Quadrant D | 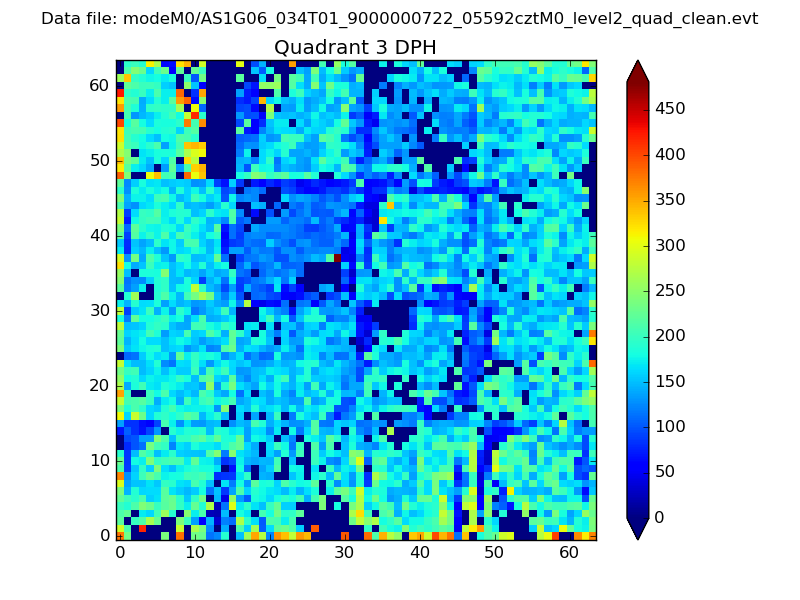 |
 |
Quadrant C |
| Plot type | Count rate plots | Images |
|---|---|---|
| Comparison with Poisson distribution Blue bars denote a histogram of data divided into 1 sec bins. Red curve is a Poisson curve with rate = median count rate of data. |
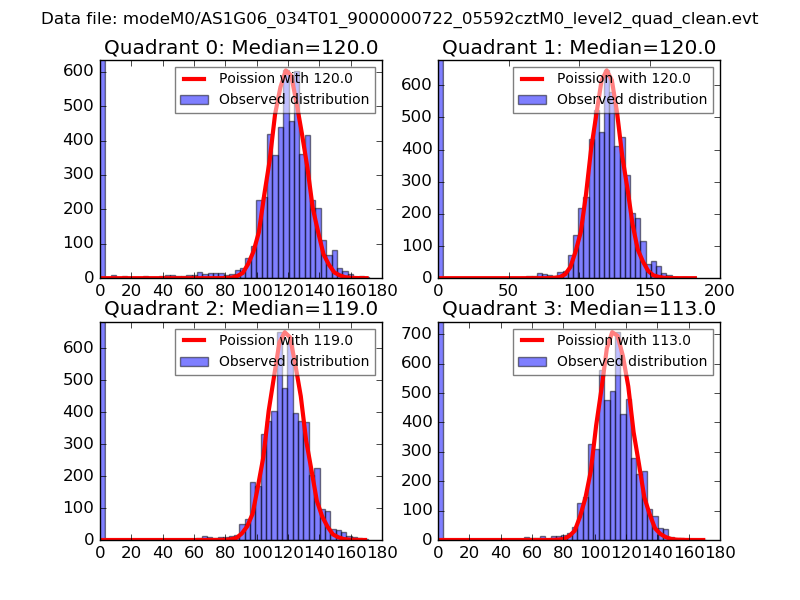 |
 |
| Quadrant-wise count rates Data is divided into 100 sec bins |
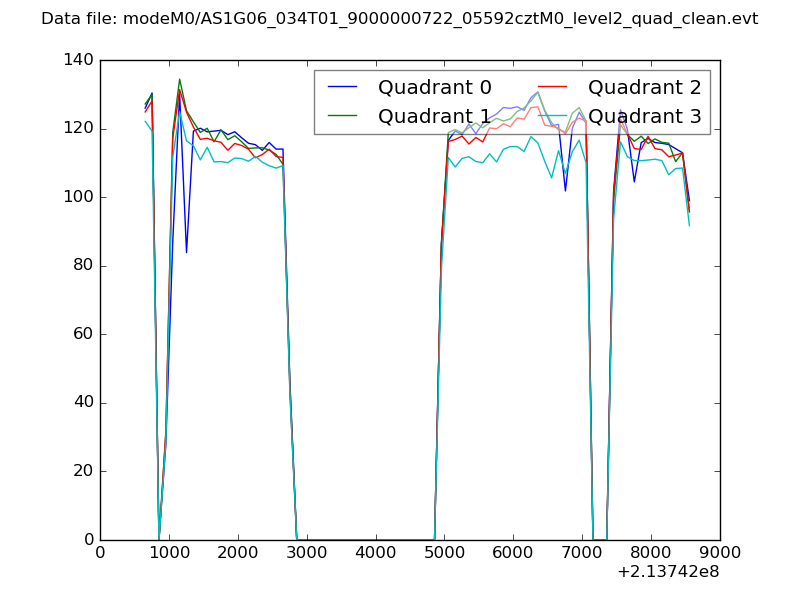 |
|
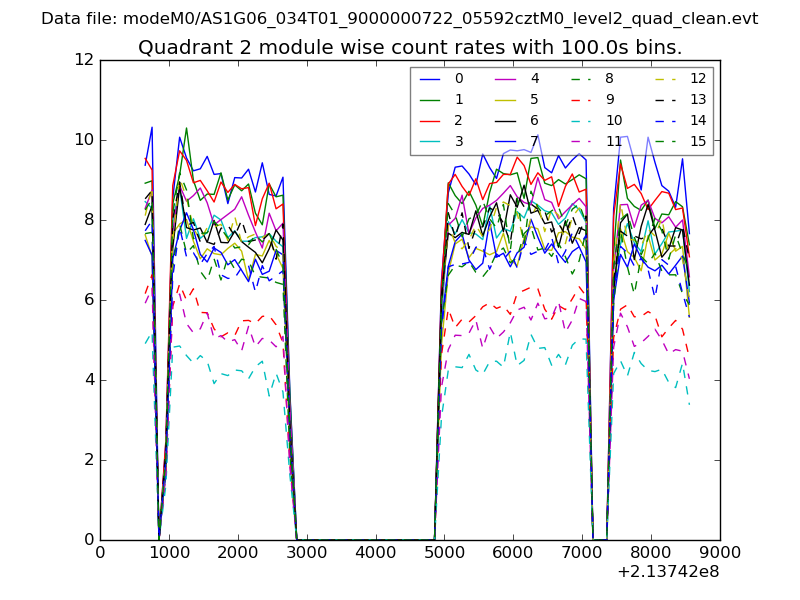
| Module-wise count rates for Quadrant A Data is divided into 100 sec bins |
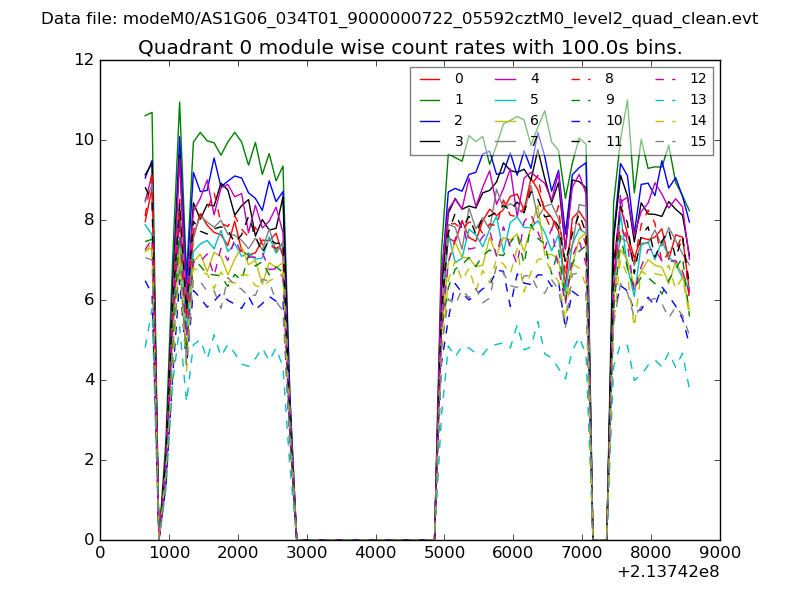 |
 |
| Module-wise count rates for Quadrant B Data is divided into 100 sec bins |
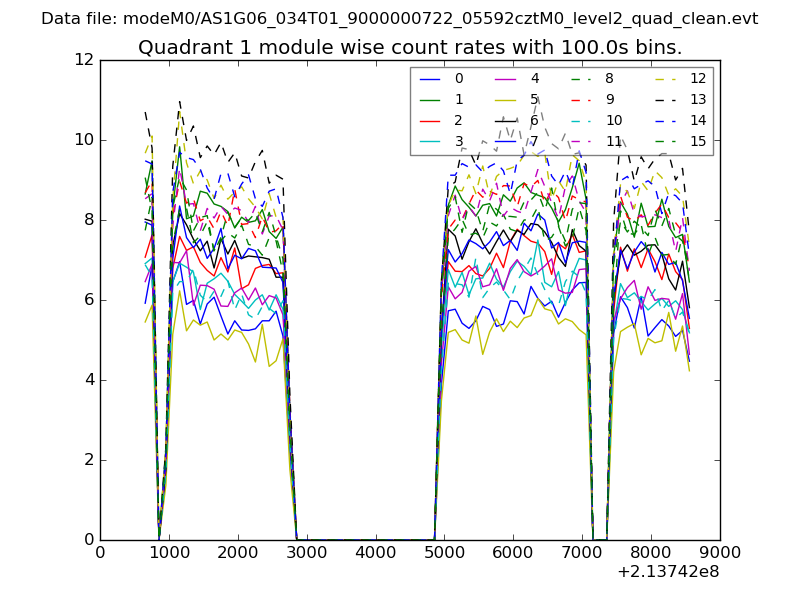 |
 |
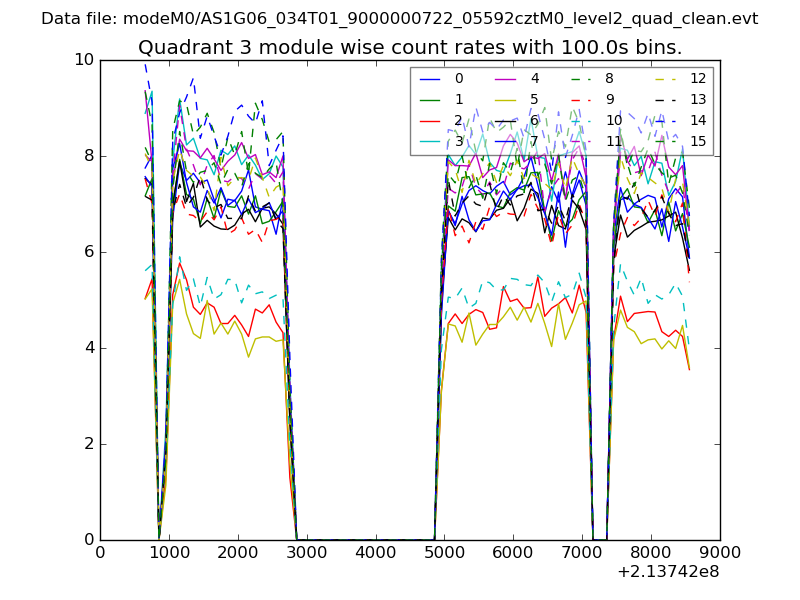
| Module-wise count rates for Quadrant C Data is divided into 100 sec bins |
 |
 |
| Module-wise count rates for Quadrant D Data is divided into 100 sec bins |
 |
 |
| Parameter | Plot |
|---|---|
| CZT HV Monitor |  |
| D_VDD |  |
| Temperature 1 | 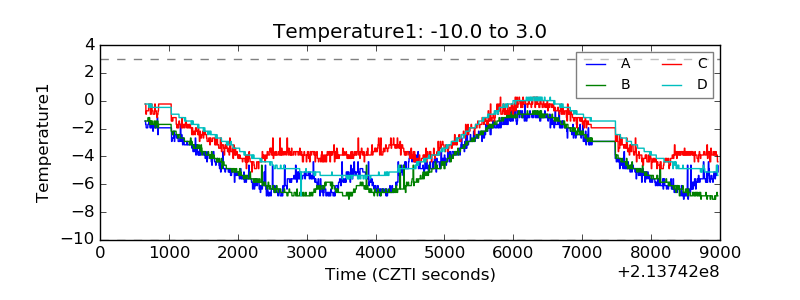 |
| Veto HV Monitor | 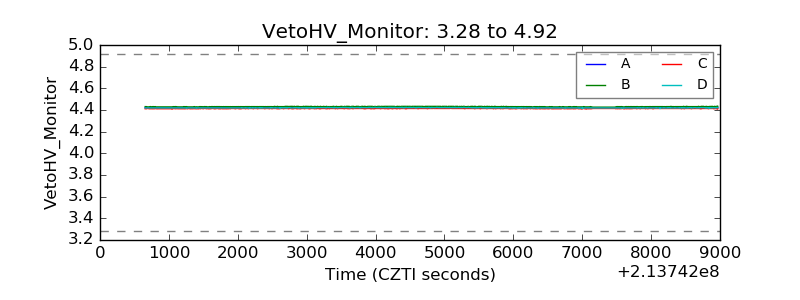 |
| Veto LLD | 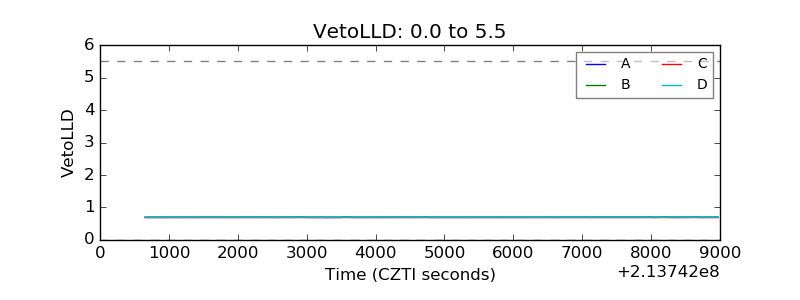 |
| Alpha Counter | 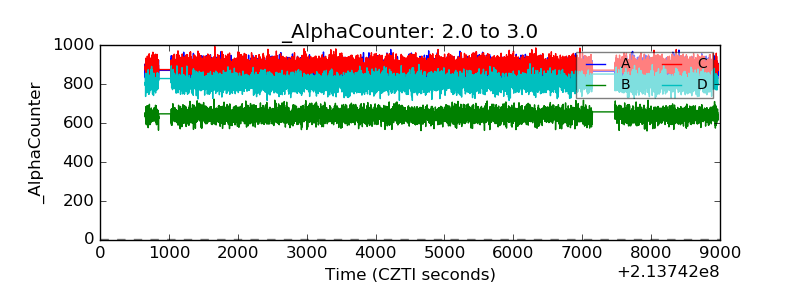 |
| _CPM_Rate | 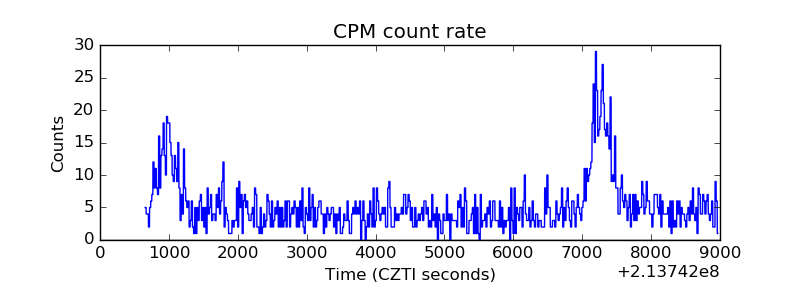 |
| CZT Counter | 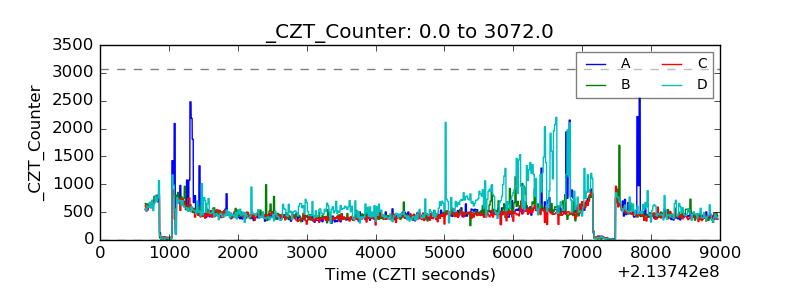 |
| +2.5 Volts monitor |  |
| +5 Volts monitor |  |
| _ROLL_ROT | 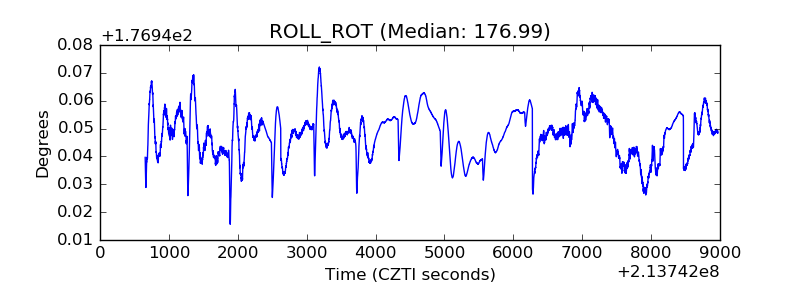 |
| _Roll_DEC | 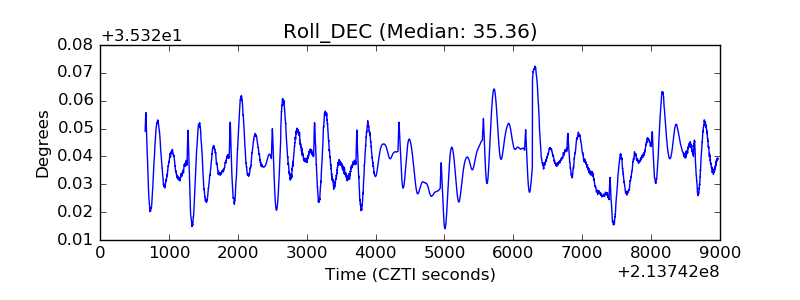 |
| _Roll_RA | 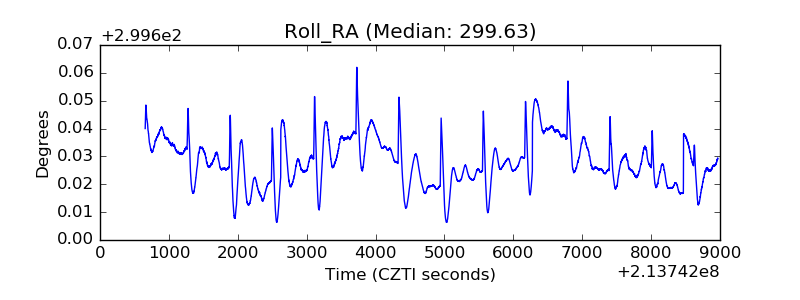 |
| Veto Counter | 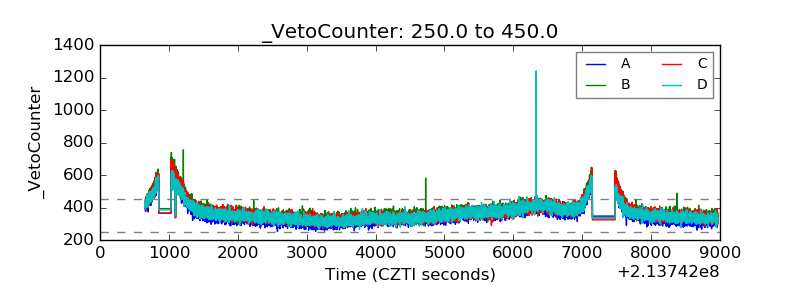 |