| Param | Original file | Final file |
|---|---|---|
| Filename | modeM0/AS1G06_034T01_9000000722_05595cztM0_level2.evt | modeM0/AS1G06_034T01_9000000722_05595cztM0_level2_quad_clean.evt |
| Size (bytes) | 1,383,140,160 | 203,544,000 |
| Size | 1.3 GB | 194.1 MB |
| Events in quadrant A | 8,544,601 | 1,256,410 |
| Events in quadrant B | 8,957,942 | 1,254,198 |
| Events in quadrant C | 8,325,635 | 1,236,042 |
| Events in quadrant D | 14,818,049 | 1,149,329 |
| Mode M9 | |||
|---|---|---|---|
| Quadrant | BADHDUFLAG | Total packets | Discarded packets |
| A | 0 | 17 | 0 |
| B | 0 | 17 | 0 |
| C | 0 | 17 | 0 |
| D | 0 | 17 | 0 |
| Mode M0 | |||
|---|---|---|---|
| Quadrant | BADHDUFLAG | Total packets | Discarded packets |
| A | 0 | 37756 | 9 |
| B | 0 | 38664 | 6 |
| C | 0 | 37420 | 8 |
| D | 0 | 56925 | 4 |
| Mode SS | |||
|---|---|---|---|
| Quadrant | BADHDUFLAG | Total packets | Discarded packets |
| A | 0 | 378 | 0 |
| B | 0 | 378 | 0 |
| C | 0 | 378 | 0 |
| D | 0 | 378 | 0 |
| Quadrant | Total seconds | Saturated seconds | Saturation percentage |
|---|---|---|---|
| A | 18390 | 160 | 0.870038% |
| B | 18391 | 194 | 1.054864% |
| C | 18390 | 95 | 0.516585% |
| D | 18393 | 524 | 2.848910% |
Noise dominated data is calculated using 1-second bins in cleaned event files. If a bin has >2000 counts, and if more than 50% of those come from <1% of pixels, then it is considered to be noise-dominated and hence unusable.
| Quadrant | # 1 sec bins | Bins with >0 counts | Bins with >2000 counts | High rate bins dominated by noise | Noise dominated (total time) | Noise dominated (detector-on time) | Marked lightcurve |
|---|---|---|---|---|---|---|---|
| A | 20267 | 18395 | 16 | 16 | 0.08% | 0.09% | 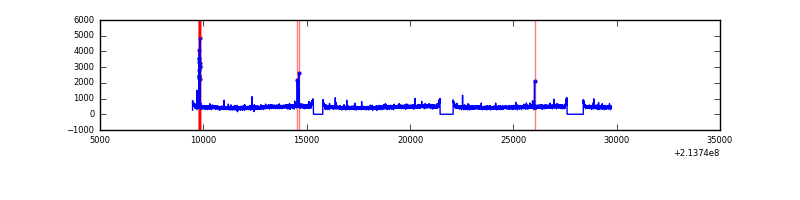 |
| B | 20267 | 18395 | 20 | 20 | 0.10% | 0.11% | 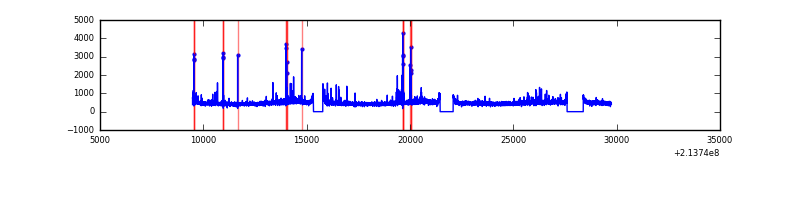 |
| C | 20267 | 18395 | 0 | 0 | 0.00% | 0.00% | 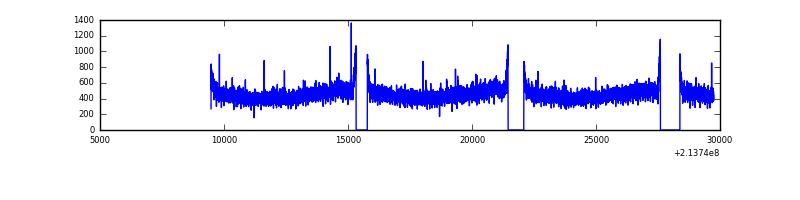 |
| D | 20268 | 18396 | 241 | 241 | 1.19% | 1.31% | 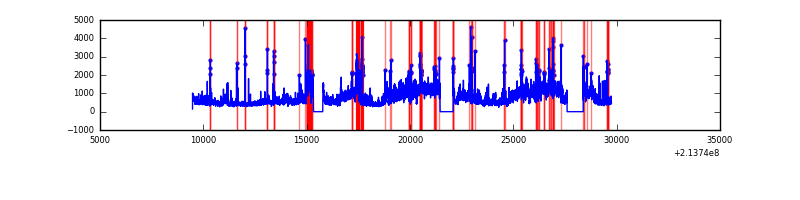 |
Top three noisy pixels from each quadrant. If the there are fewer than three noisy pixels in the level2.evt file, extra rows are filled as -1
| Pixel properties | Quadrant properties | ||||||
|---|---|---|---|---|---|---|---|
| Quadrant | DetID | PixID | Counts | Sigma | Mean | Median | Sigma |
| A | 0 | 50 | 99699 | 221.31 | 2172 | 2129 | 440.9 |
| A | 13 | 14 | 49223 | 106.82 | 2172 | 2129 | 440.9 |
| A | 12 | 194 | 21237 | 43.34 | 2172 | 2129 | 440.9 |
| B | 0 | 214 | 123600 | 291.2 | 2196 | 2151 | 417.1 |
| B | 11 | 51 | 79212 | 184.77 | 2196 | 2151 | 417.1 |
| B | 15 | 204 | 73508 | 171.09 | 2196 | 2151 | 417.1 |
| C | 13 | 61 | 17246 | 30.7 | 2123 | 2140 | 492.1 |
| C | 8 | 128 | 16263 | 28.7 | 2123 | 2140 | 492.1 |
| C | 8 | 112 | 9243 | 14.43 | 2123 | 2140 | 492.1 |
| D | 2 | 63 | 4792150 | 9351.29 | 2100 | 2039 | 512.2 |
| D | 11 | 241 | 1042481 | 2031.16 | 2100 | 2039 | 512.2 |
| D | 2 | 33 | 350390 | 680.05 | 2100 | 2039 | 512.2 |
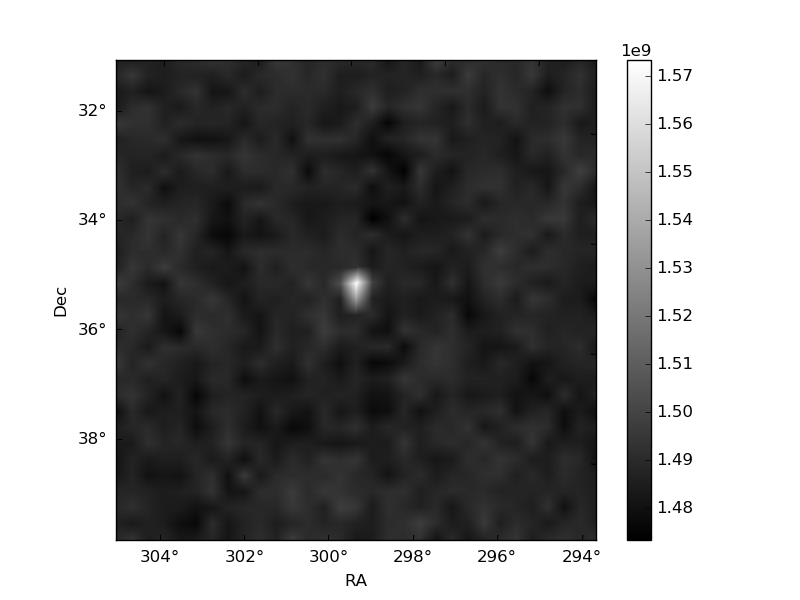
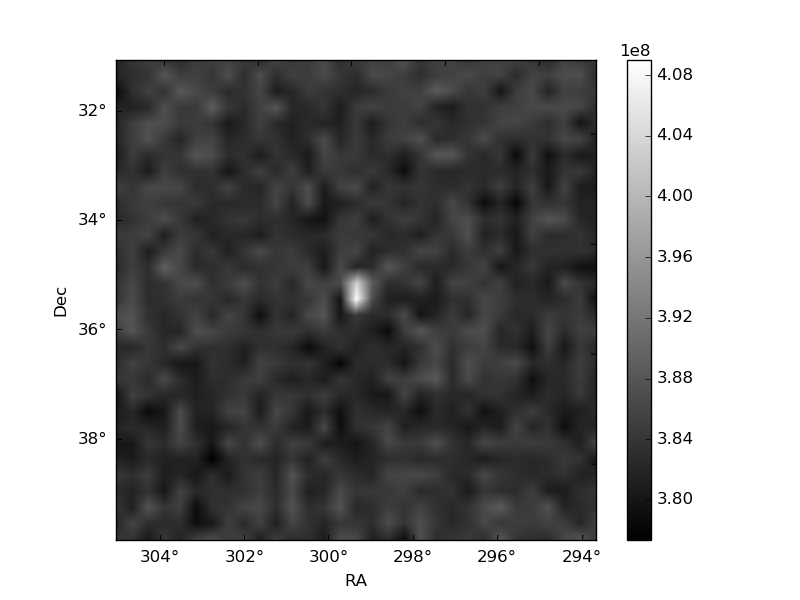
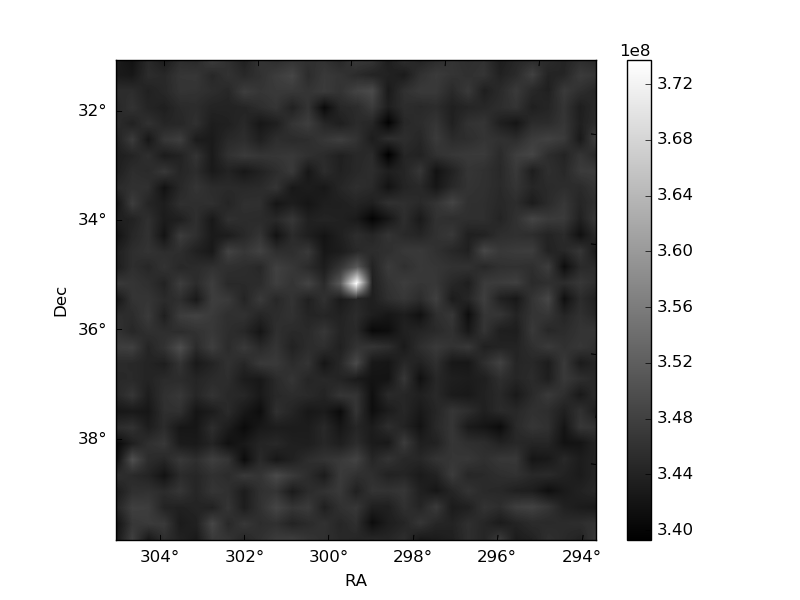
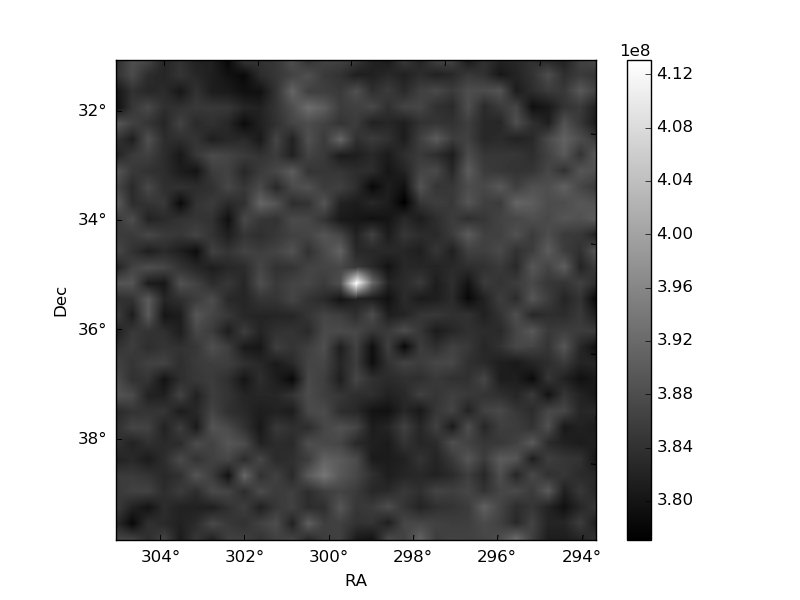
Histogram calculated using DETX and DETY for each event in the final _common_clean file
| Quadrant A | 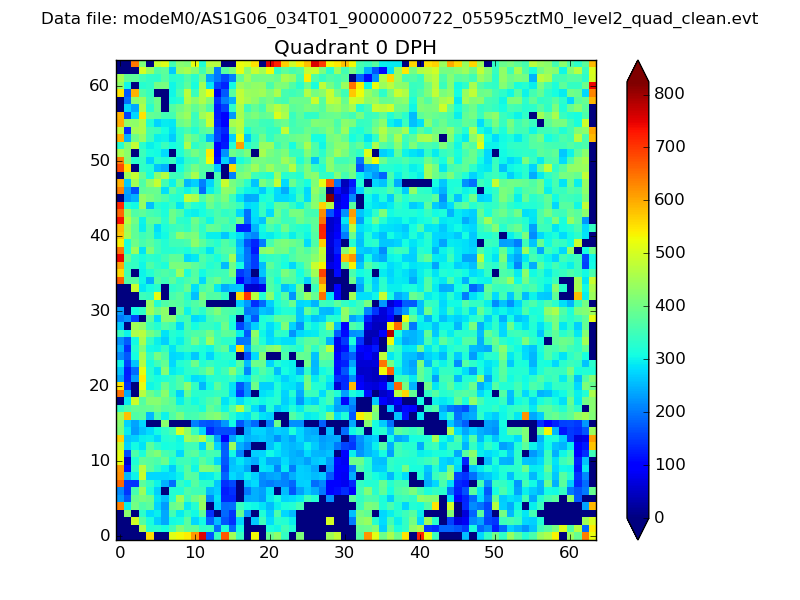 |
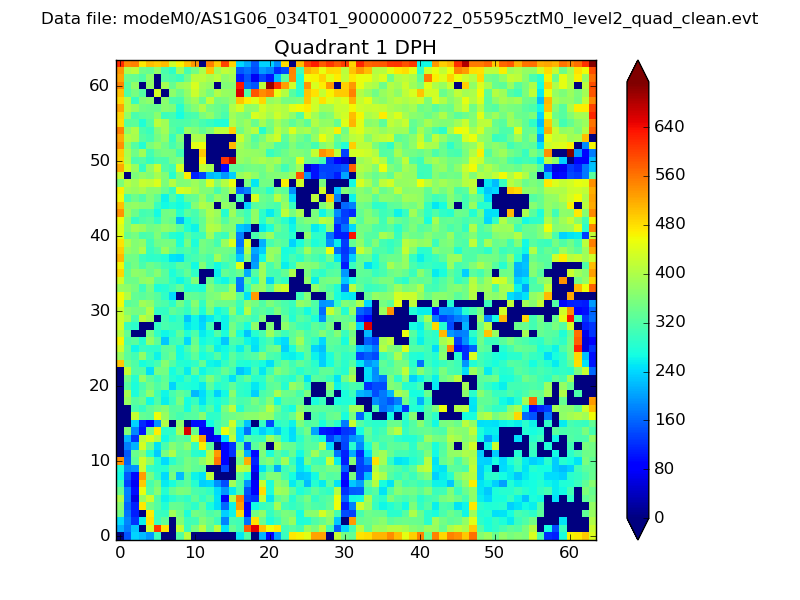 |
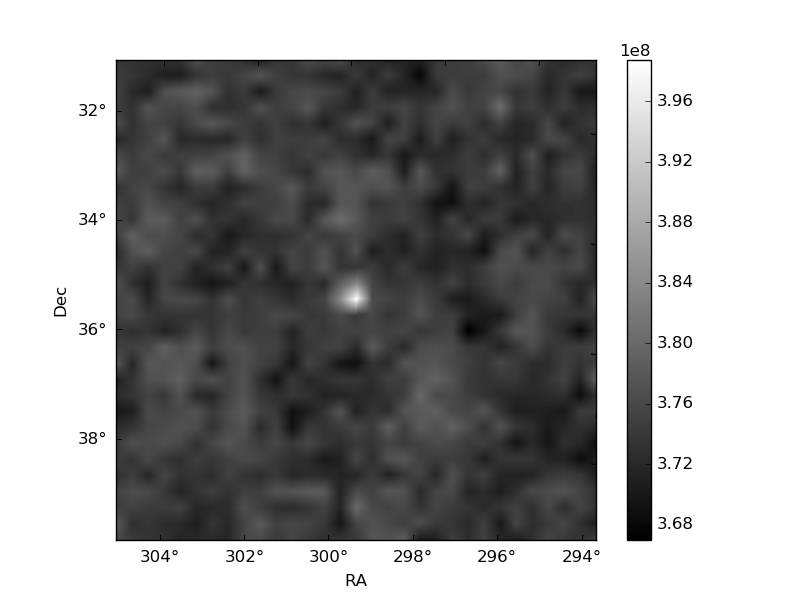
Quadrant B |
|---|---|---|---|
| Quadrant D | 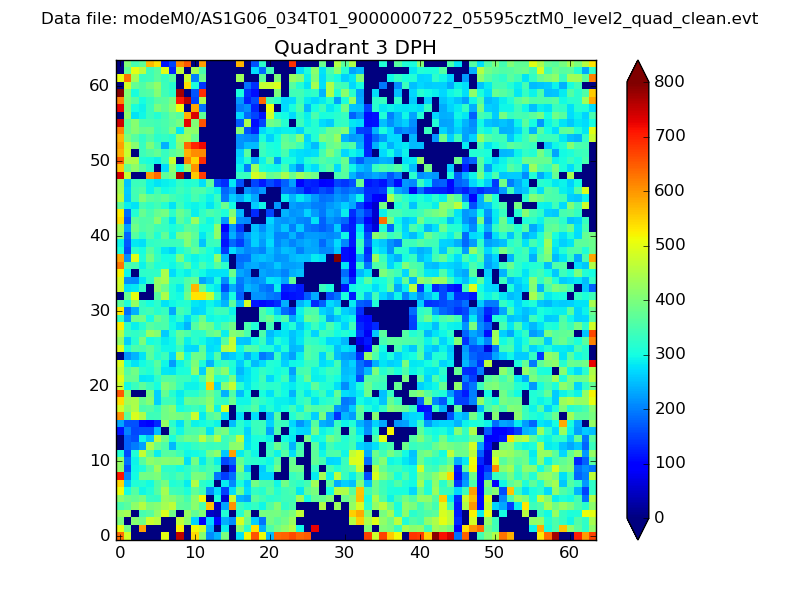 |
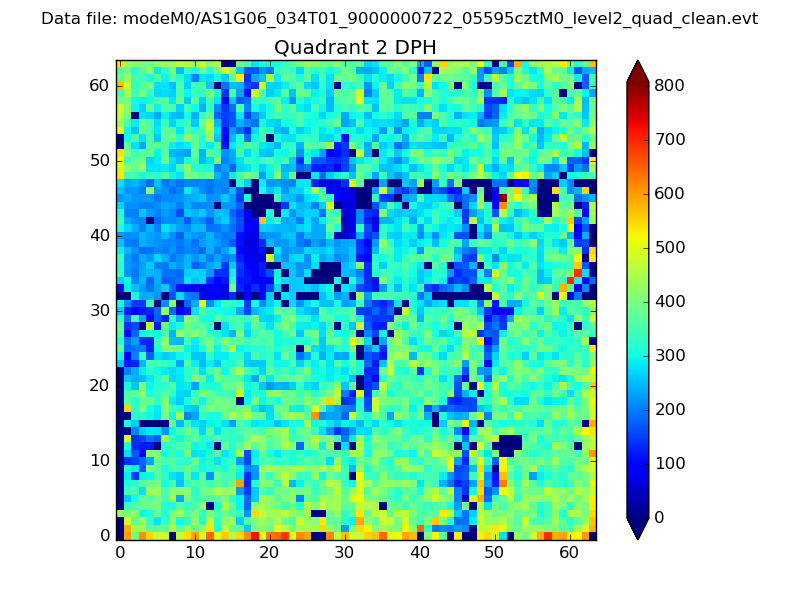 |
Quadrant C |
| Plot type | Count rate plots | Images |
|---|---|---|
| Comparison with Poisson distribution Blue bars denote a histogram of data divided into 1 sec bins. Red curve is a Poisson curve with rate = median count rate of data. |
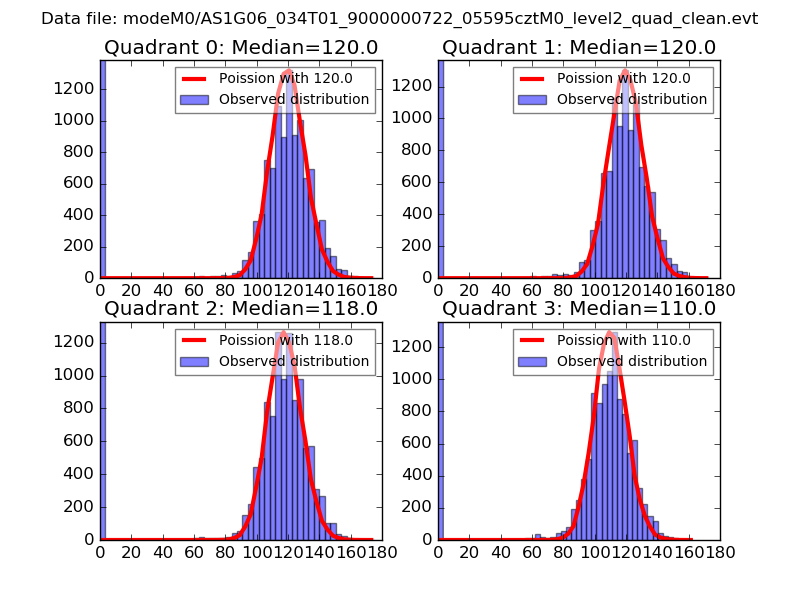 |
 |
| Quadrant-wise count rates Data is divided into 100 sec bins |
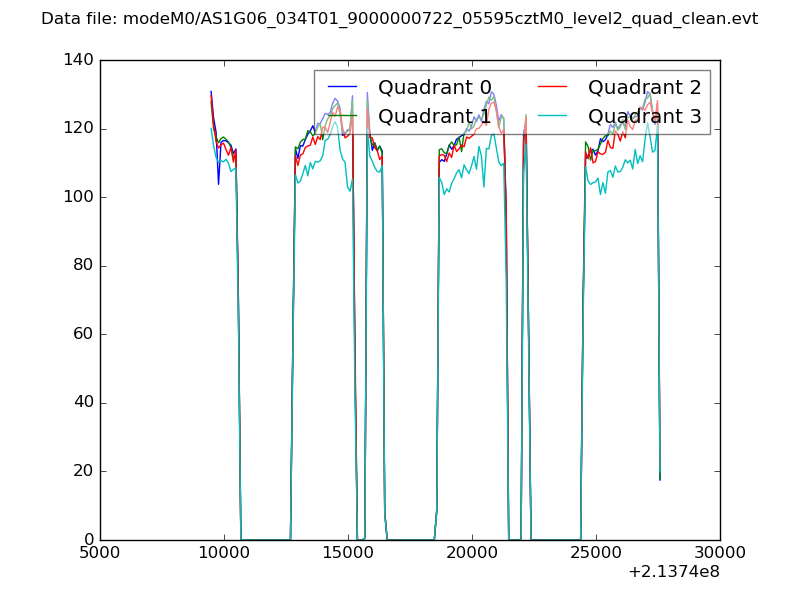 |
|
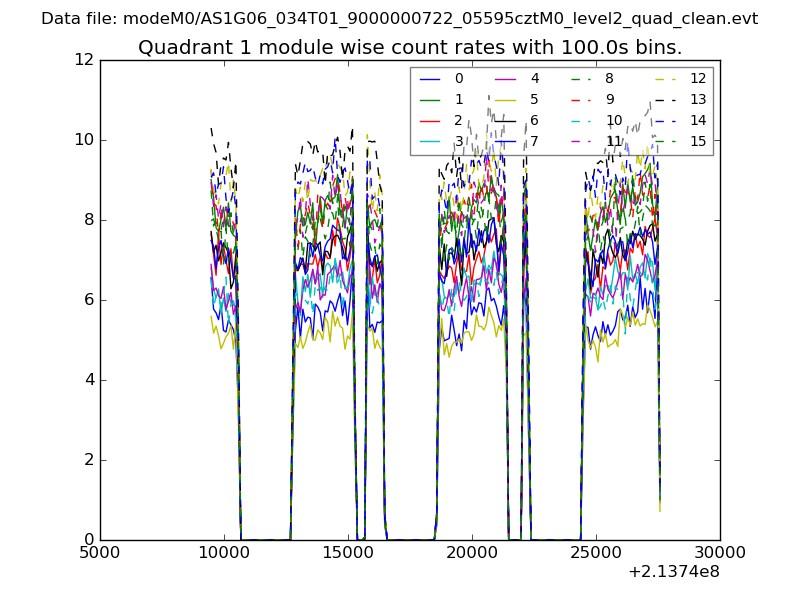
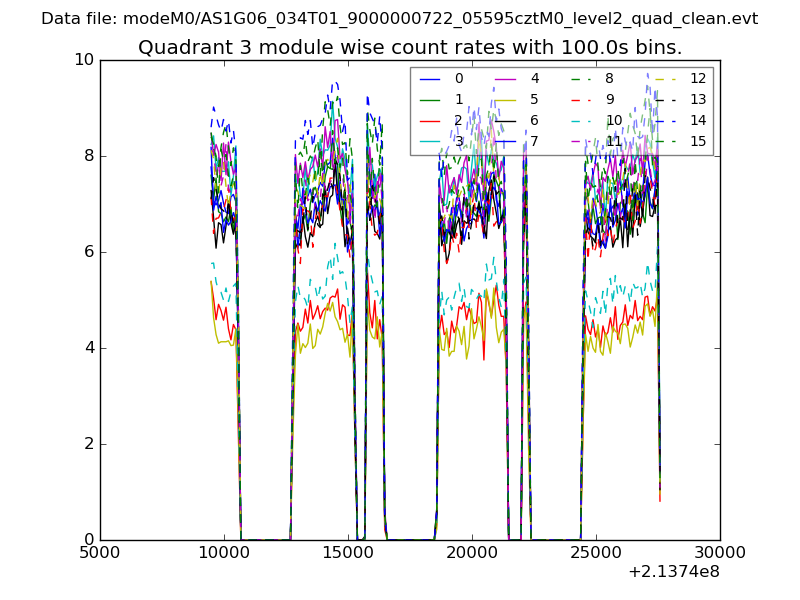
| Module-wise count rates for Quadrant A Data is divided into 100 sec bins |
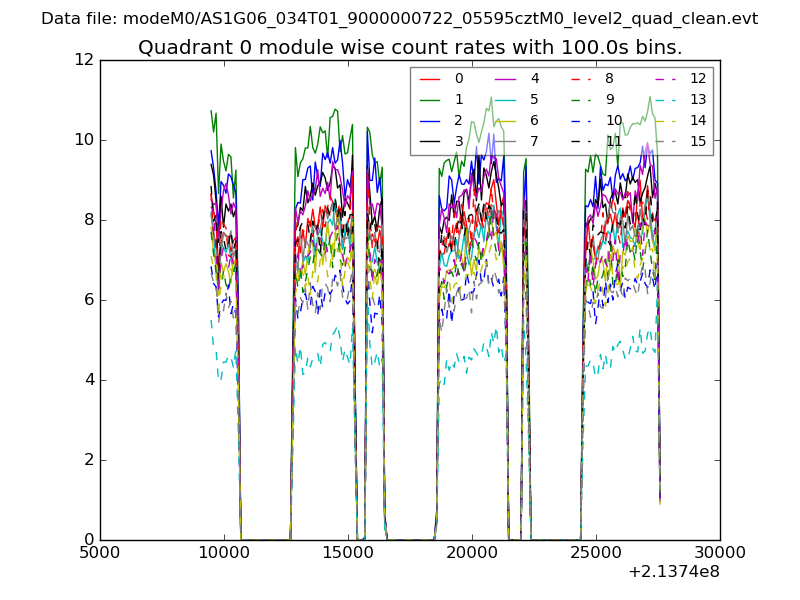 |
 |
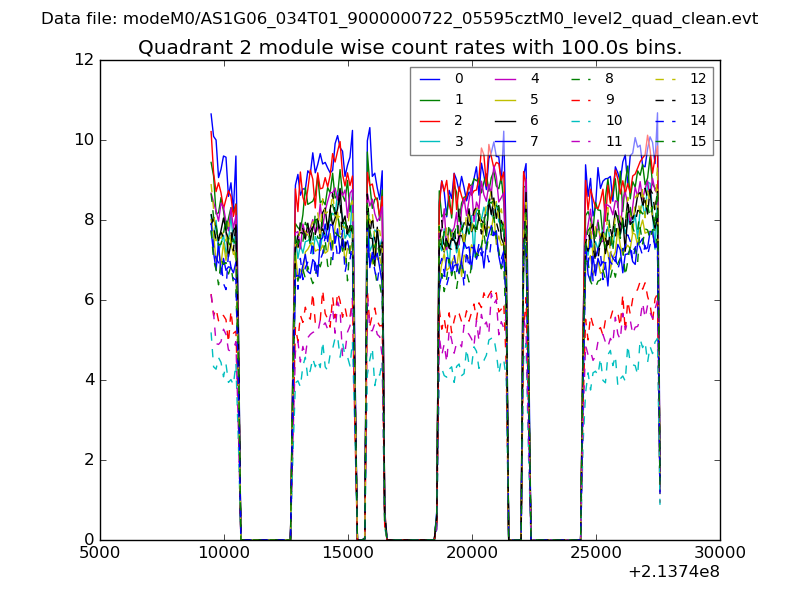
| Module-wise count rates for Quadrant B Data is divided into 100 sec bins |
 |
 |
| Module-wise count rates for Quadrant C Data is divided into 100 sec bins |
 |
 |
| Module-wise count rates for Quadrant D Data is divided into 100 sec bins |
 |
 |
| Parameter | Plot |
|---|---|
| CZT HV Monitor | 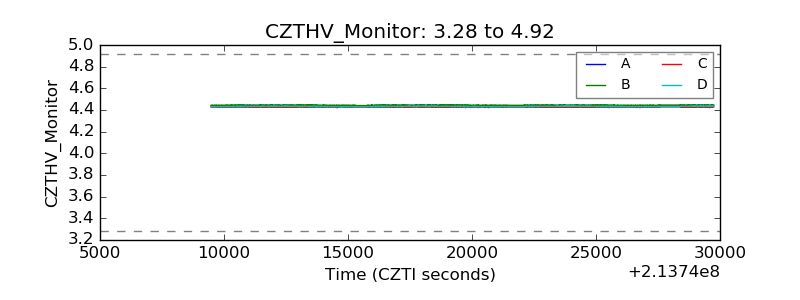 |
| D_VDD | 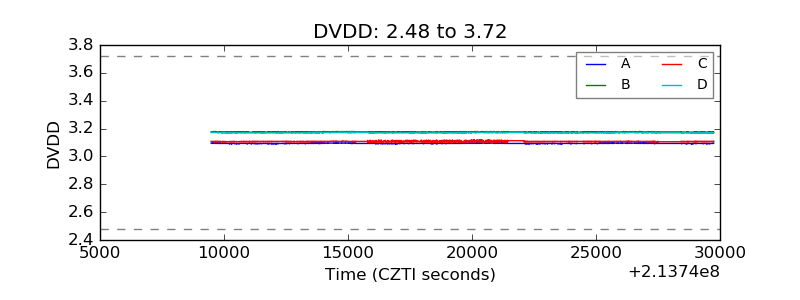 |
| Temperature 1 | 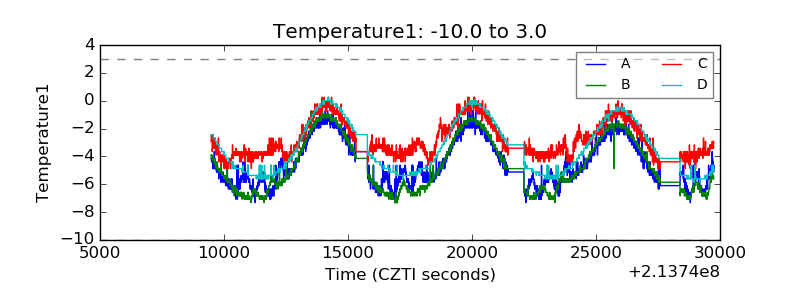 |
| Veto HV Monitor | 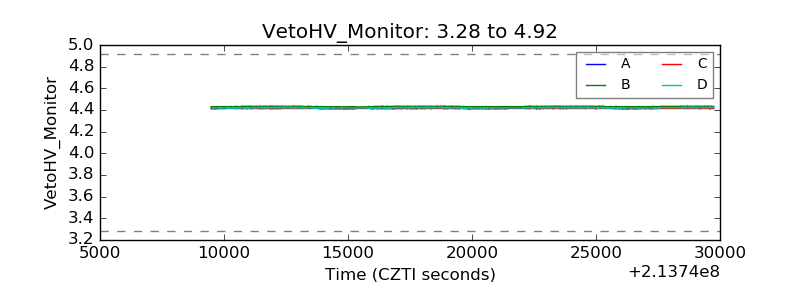 |
| Veto LLD | 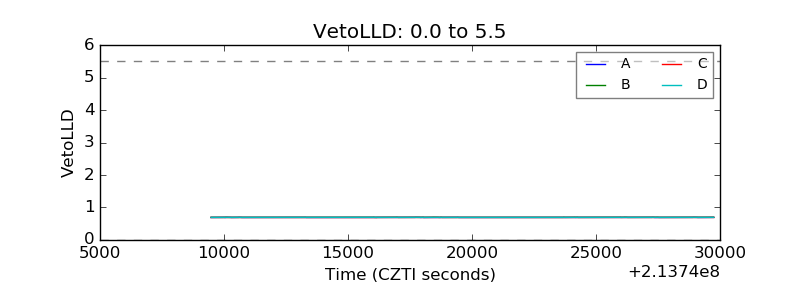 |
| Alpha Counter | 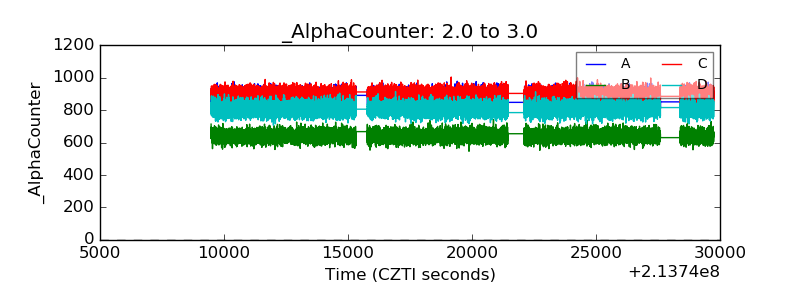 |
| _CPM_Rate | 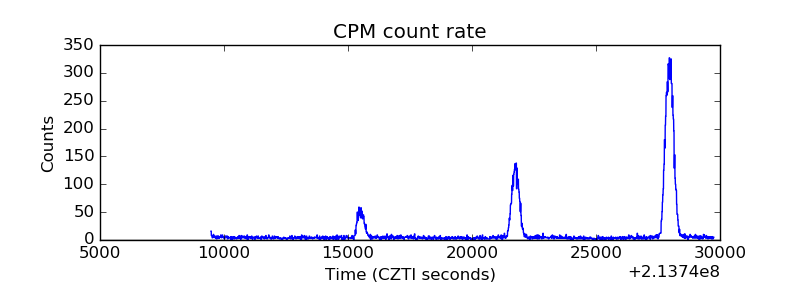 |
| CZT Counter | 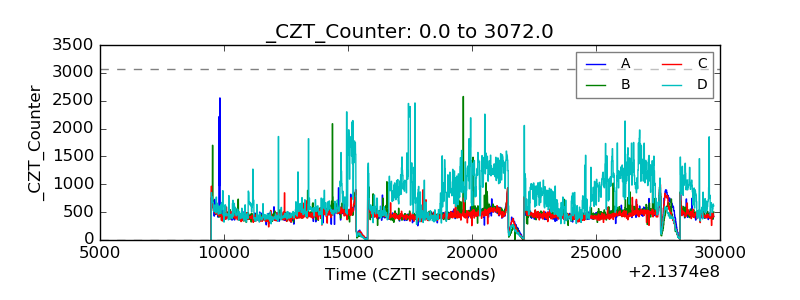 |
| +2.5 Volts monitor |  |
| +5 Volts monitor |  |
| _ROLL_ROT | 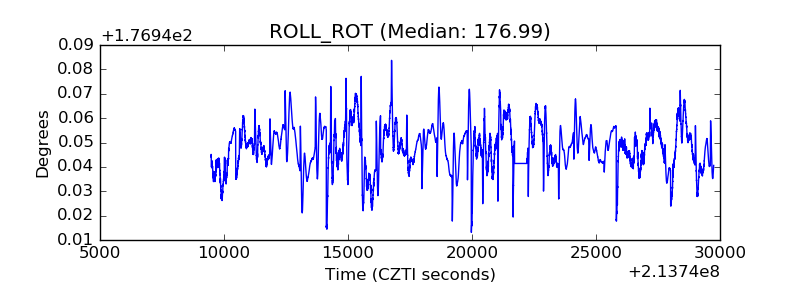 |
| _Roll_DEC | 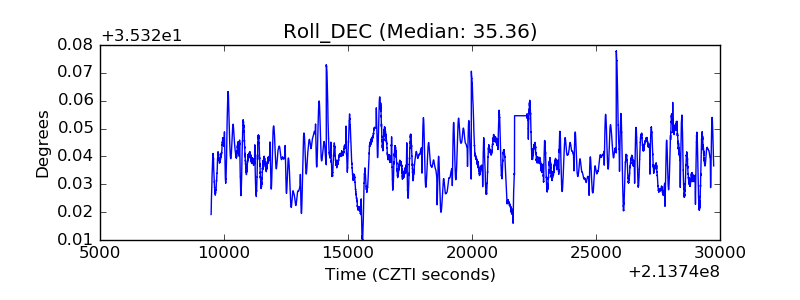 |
| _Roll_RA | 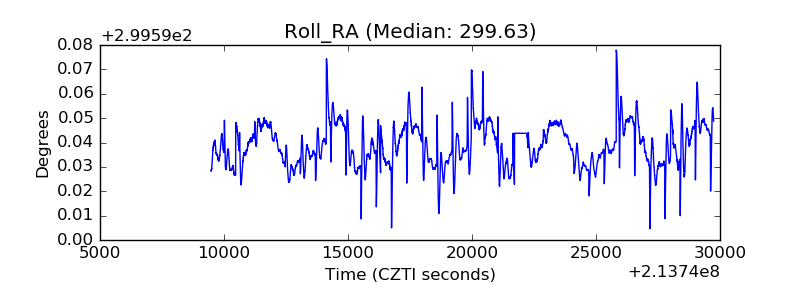 |
| Veto Counter | 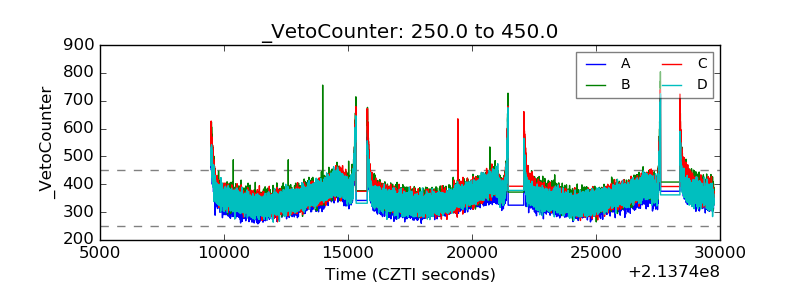 |