| Param | Original file | Final file |
|---|---|---|
| Filename | modeM0/AS1G06_034T01_9000000722_05596cztM0_level2.evt | modeM0/AS1G06_034T01_9000000722_05596cztM0_level2_quad_clean.evt |
| Size (bytes) | 507,709,440 | 70,251,840 |
| Size | 484.2 MB | 67.0 MB |
| Events in quadrant A | 3,285,221 | 422,527 |
| Events in quadrant B | 3,429,059 | 420,264 |
| Events in quadrant C | 3,211,192 | 413,896 |
| Events in quadrant D | 4,982,023 | 389,392 |
| Mode M9 | |||
|---|---|---|---|
| Quadrant | BADHDUFLAG | Total packets | Discarded packets |
| A | 0 | 16 | 0 |
| B | 0 | 16 | 0 |
| C | 0 | 16 | 0 |
| D | 0 | 16 | 0 |
| Mode M0 | |||
|---|---|---|---|
| Quadrant | BADHDUFLAG | Total packets | Discarded packets |
| A | 0 | 14180 | 3 |
| B | 0 | 14421 | 2 |
| C | 0 | 14180 | 2 |
| D | 0 | 19430 | 2 |
| Mode SS | |||
|---|---|---|---|
| Quadrant | BADHDUFLAG | Total packets | Discarded packets |
| A | 0 | 144 | 0 |
| B | 0 | 144 | 0 |
| C | 0 | 144 | 0 |
| D | 0 | 144 | 0 |
| Quadrant | Total seconds | Saturated seconds | Saturation percentage |
|---|---|---|---|
| A | 6897 | 108 | 1.565898% |
| B | 6897 | 126 | 1.826881% |
| C | 6897 | 84 | 1.217921% |
| D | 6897 | 190 | 2.754821% |
Noise dominated data is calculated using 1-second bins in cleaned event files. If a bin has >2000 counts, and if more than 50% of those come from <1% of pixels, then it is considered to be noise-dominated and hence unusable.
| Quadrant | # 1 sec bins | Bins with >0 counts | Bins with >2000 counts | High rate bins dominated by noise | Noise dominated (total time) | Noise dominated (detector-on time) | Marked lightcurve |
|---|---|---|---|---|---|---|---|
| A | 8597 | 6898 | 0 | 0 | 0.00% | 0.00% | 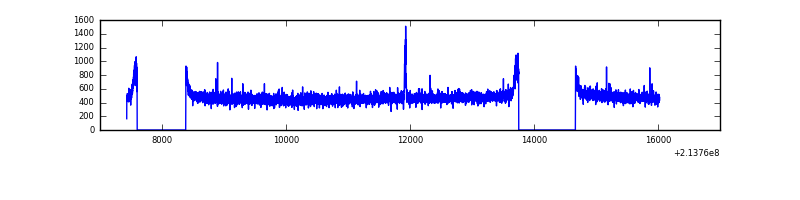 |
| B | 8597 | 6898 | 0 | 0 | 0.00% | 0.00% | 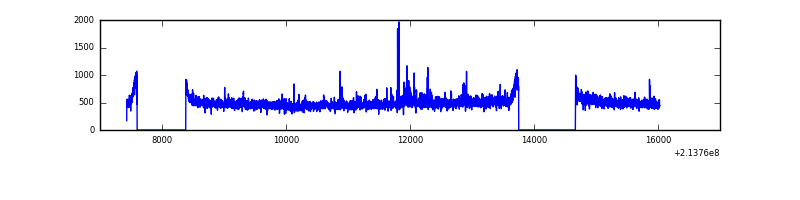 |
| C | 8597 | 6898 | 1 | 1 | 0.01% | 0.01% |  |
| D | 8597 | 6899 | 76 | 76 | 0.88% | 1.10% | 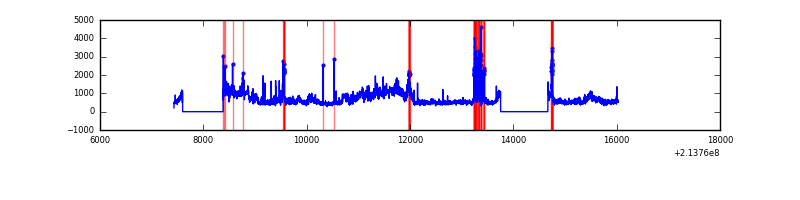 |
Top three noisy pixels from each quadrant. If the there are fewer than three noisy pixels in the level2.evt file, extra rows are filled as -1
| Pixel properties | Quadrant properties | ||||||
|---|---|---|---|---|---|---|---|
| Quadrant | DetID | PixID | Counts | Sigma | Mean | Median | Sigma |
| A | 13 | 14 | 24689 | 138.47 | 842 | 824 | 172.3 |
| A | 0 | 50 | 19650 | 109.23 | 842 | 824 | 172.3 |
| A | 12 | 194 | 8186 | 42.72 | 842 | 824 | 172.3 |
| B | 15 | 204 | 57447 | 344.09 | 851 | 832 | 164.5 |
| B | 0 | 219 | 28218 | 166.44 | 851 | 832 | 164.5 |
| B | 0 | 214 | 20151 | 117.41 | 851 | 832 | 164.5 |
| C | 8 | 79 | 8368 | 39.54 | 817 | 820 | 190.9 |
| C | 13 | 61 | 6513 | 29.82 | 817 | 820 | 190.9 |
| C | 1 | 16 | 5892 | 26.57 | 817 | 820 | 190.9 |
| D | 2 | 63 | 1189788 | 5984.25 | 809 | 786 | 198.7 |
| D | 11 | 241 | 342696 | 1720.83 | 809 | 786 | 198.7 |
| D | 2 | 136 | 158901 | 795.79 | 809 | 786 | 198.7 |
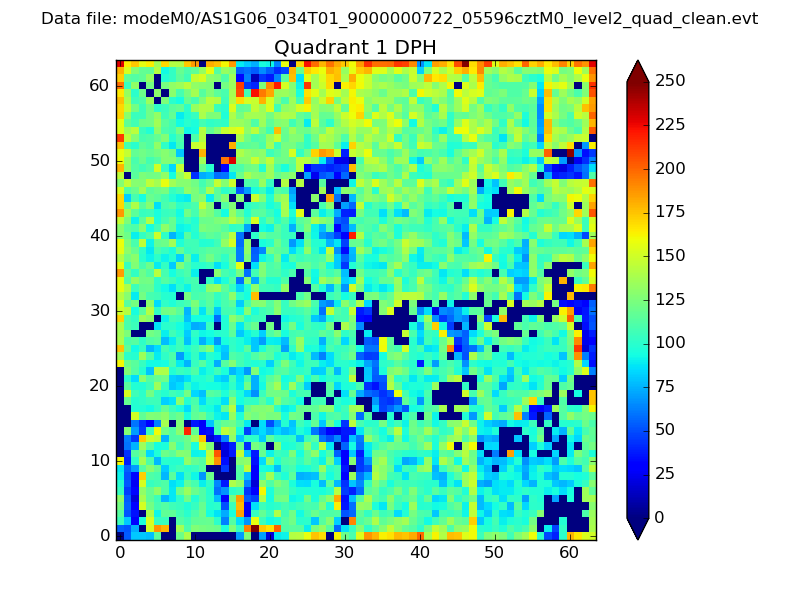
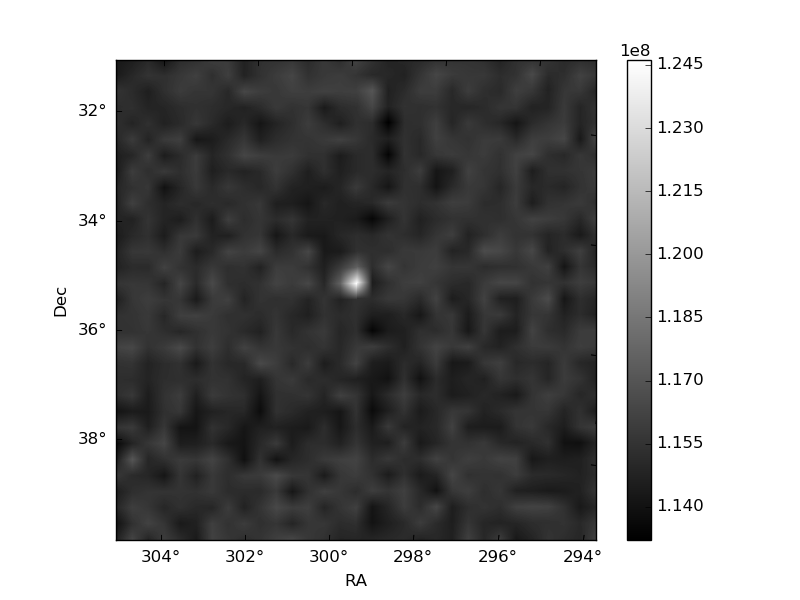
Histogram calculated using DETX and DETY for each event in the final _common_clean file
| Quadrant A |  |
 |
Quadrant B |
|---|---|---|---|
| Quadrant D |  |
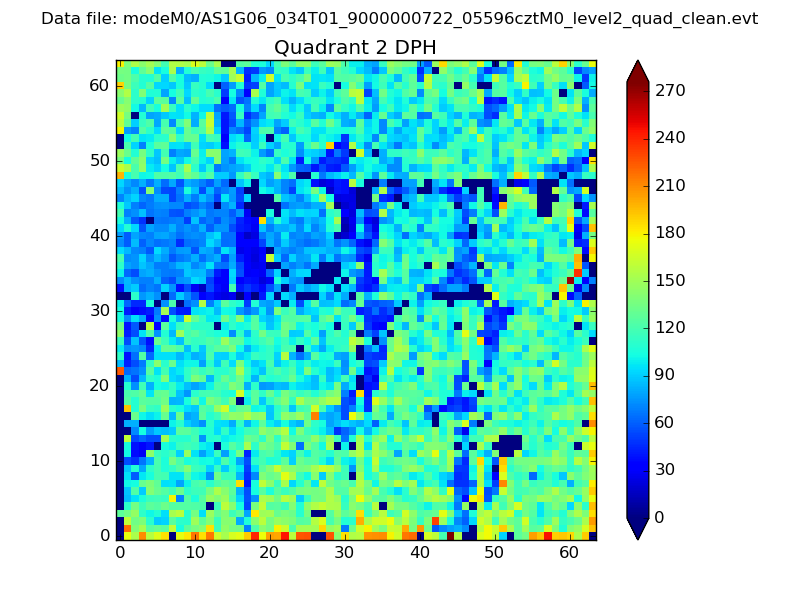 |
Quadrant C |
| Plot type | Count rate plots | Images |
|---|---|---|
| Comparison with Poisson distribution Blue bars denote a histogram of data divided into 1 sec bins. Red curve is a Poisson curve with rate = median count rate of data. |
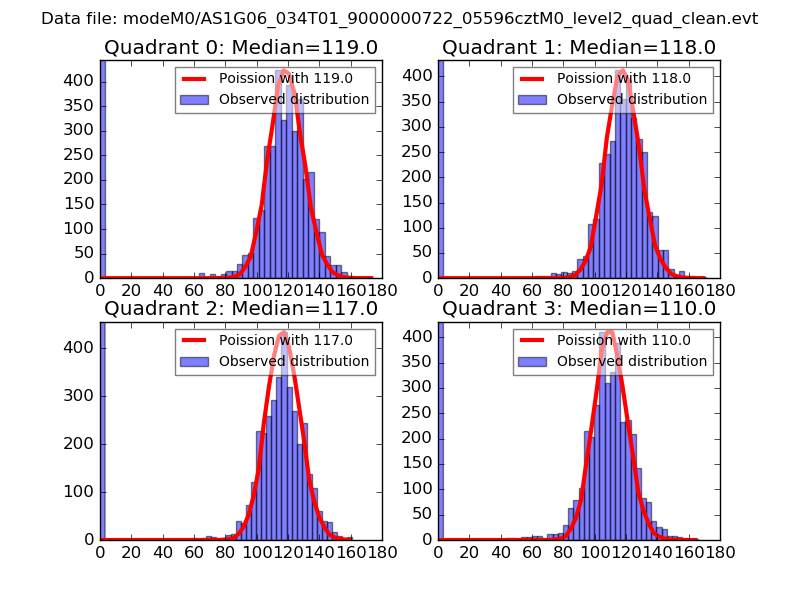 |
 |
| Quadrant-wise count rates Data is divided into 100 sec bins |
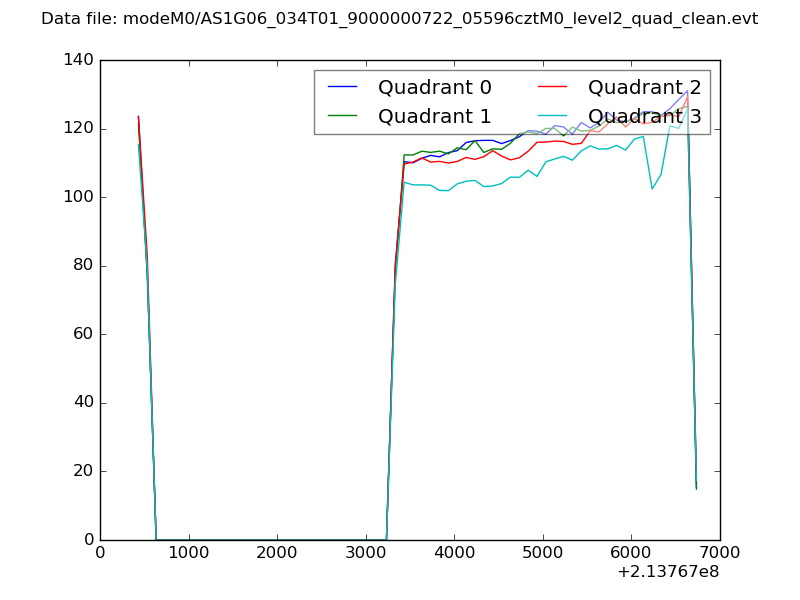 |
|
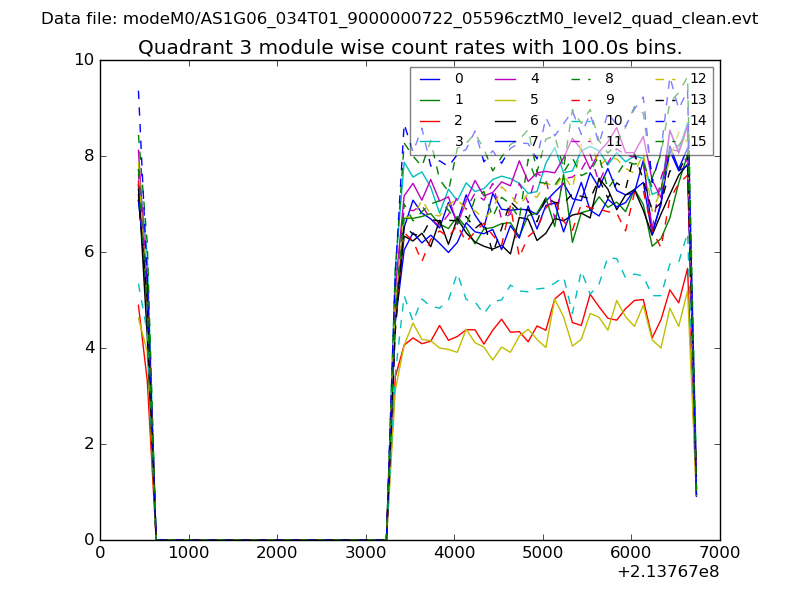
| Module-wise count rates for Quadrant A Data is divided into 100 sec bins |
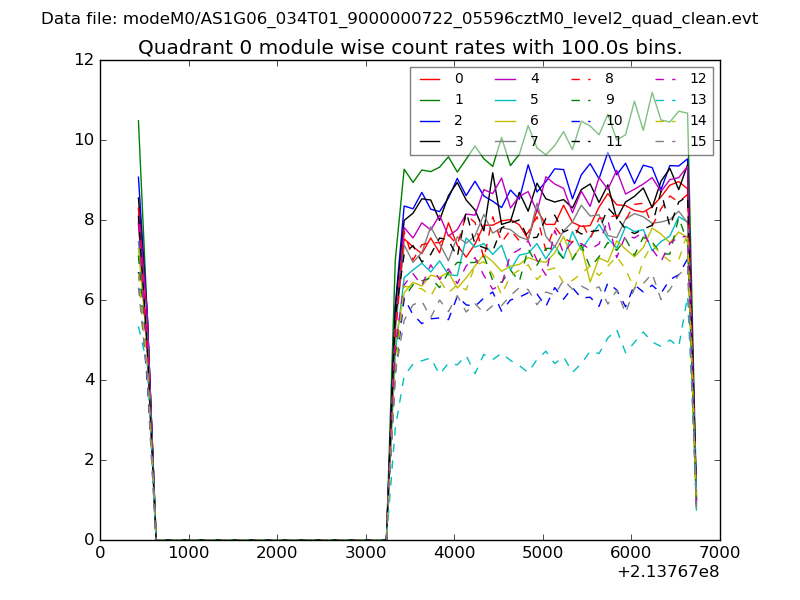 |
 |
| Module-wise count rates for Quadrant B Data is divided into 100 sec bins |
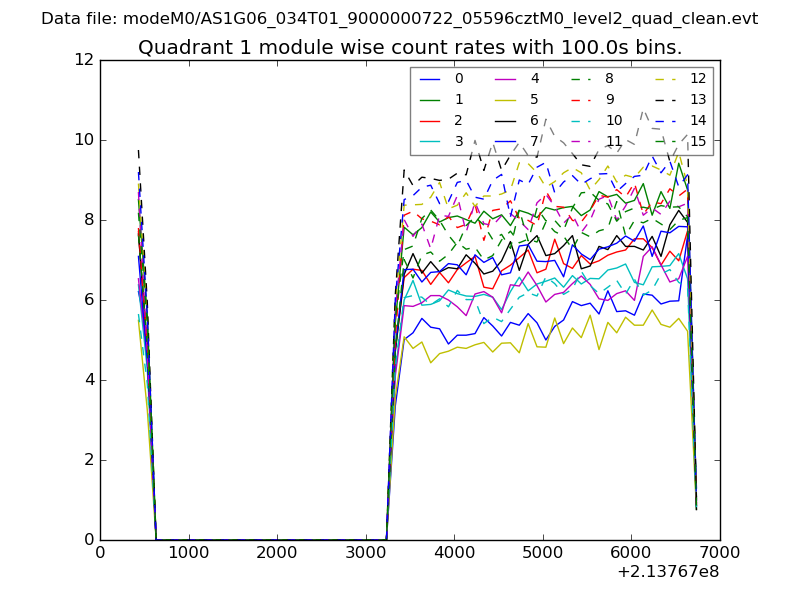 |
 |
| Module-wise count rates for Quadrant C Data is divided into 100 sec bins |
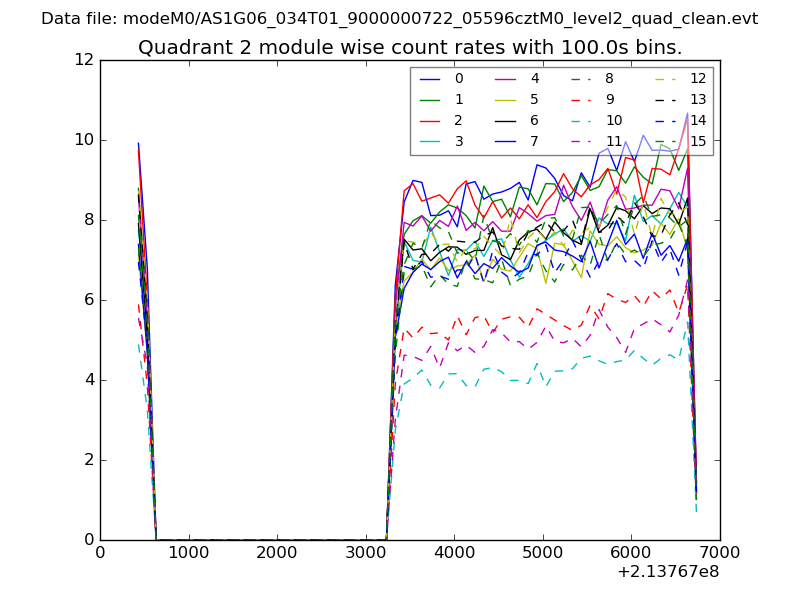 |
 |
| Module-wise count rates for Quadrant D Data is divided into 100 sec bins |
 |
 |
| Parameter | Plot |
|---|---|
| CZT HV Monitor |  |
| D_VDD | 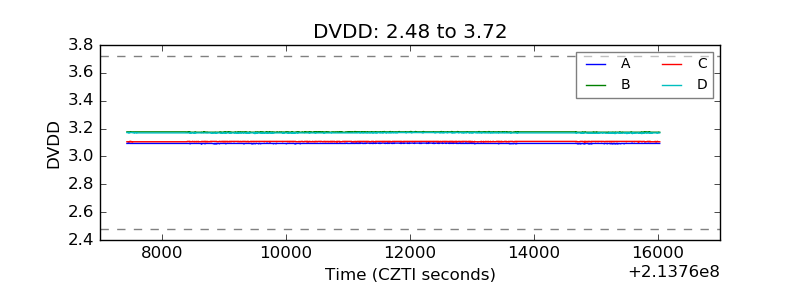 |
| Temperature 1 | 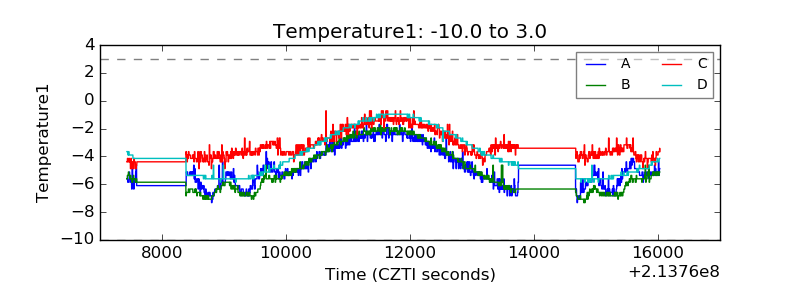 |
| Veto HV Monitor | 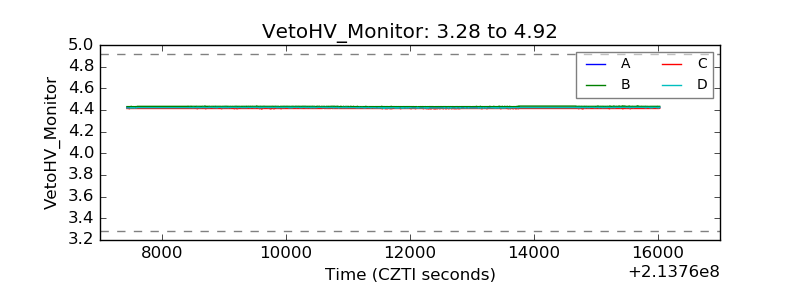 |
| Veto LLD | 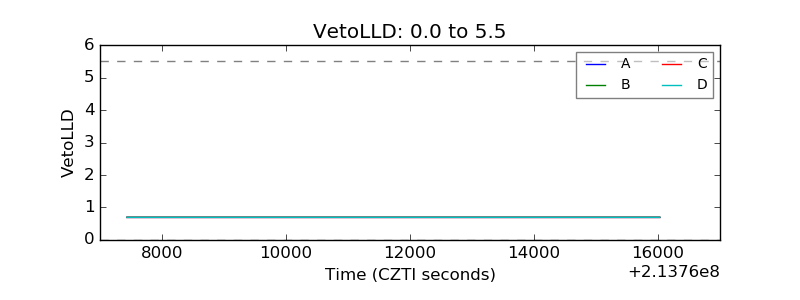 |
| Alpha Counter | 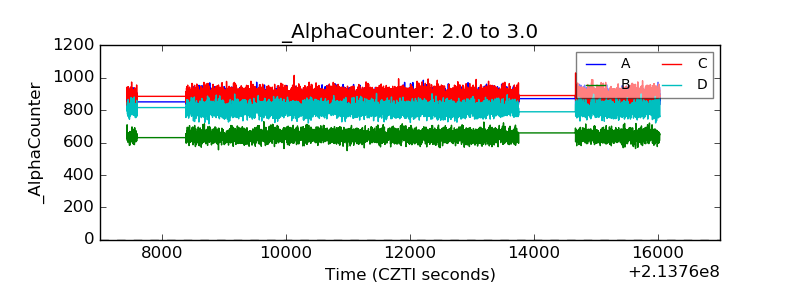 |
| _CPM_Rate | 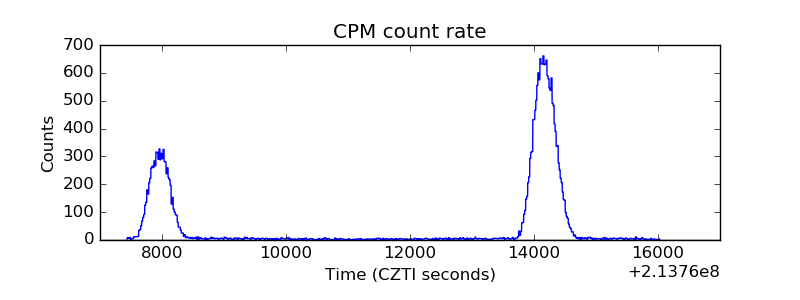 |
| CZT Counter | 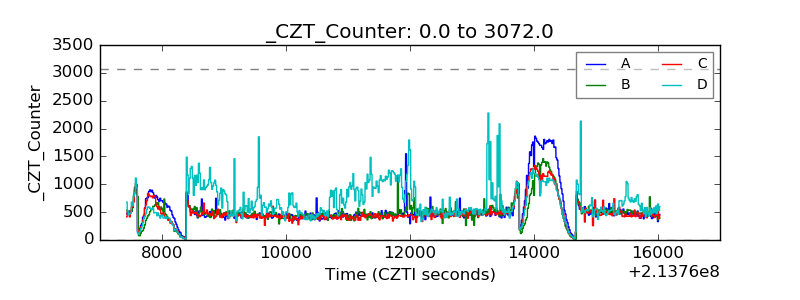 |
| +2.5 Volts monitor |  |
| +5 Volts monitor |  |
| _ROLL_ROT | 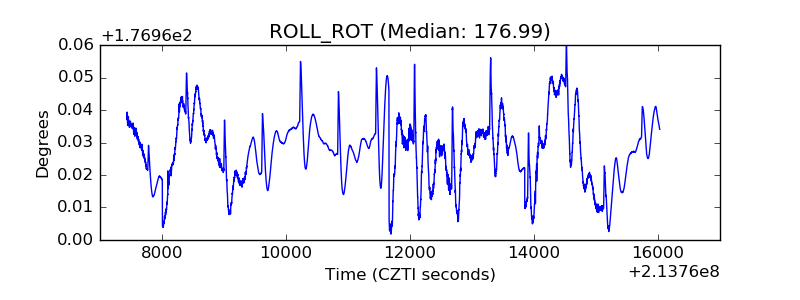 |
| _Roll_DEC | 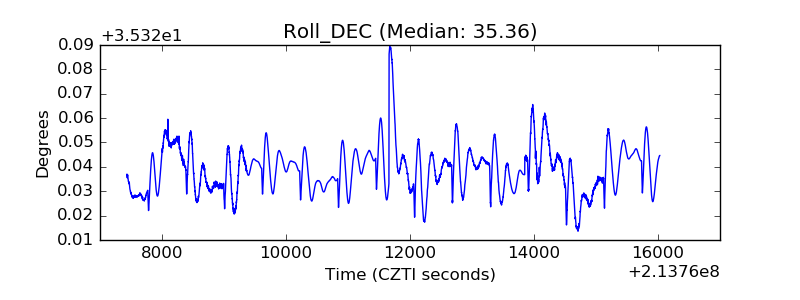 |
| _Roll_RA | 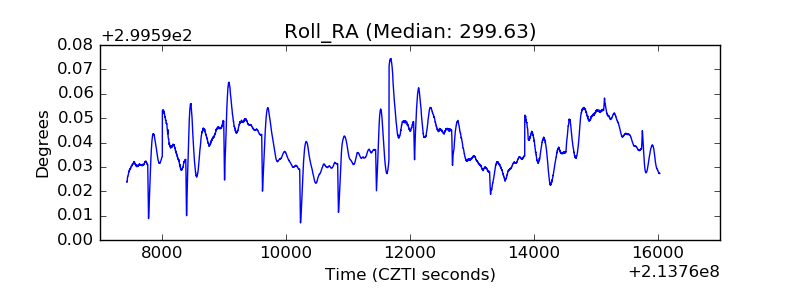 |
| Veto Counter | 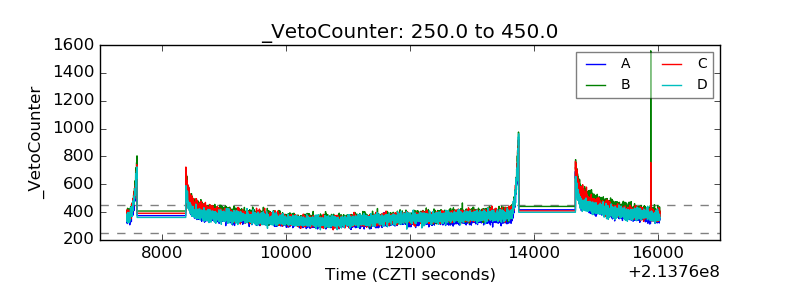 |