| Param | Original file | Final file |
|---|---|---|
| Filename | modeM0/AS1A02_028T01_9000000724cztM0_level2.fits | modeM0/AS1A02_028T01_9000000724cztM0_level2_quad_clean.evt |
| Size (bytes) | 369,241,920 | 371,456,640 |
| Size | 352.1 MB | 354.2 MB |
| Events in quadrant A | 2,274,626 | 2,263,693 |
| Events in quadrant B | 2,174,388 | 2,267,439 |
| Events in quadrant C | 2,219,200 | 2,161,893 |
| Events in quadrant D | 1,882,266 | 1,924,681 |
| Mode SS | |||
|---|---|---|---|
| Quadrant | BADHDUFLAG | Total packets | Discarded packets |
| A | 0 | 780 | 0 |
| B | 0 | 780 | 0 |
| C | 0 | 780 | 0 |
| D | 0 | 780 | 0 |
| Mode M0 | |||
|---|---|---|---|
| Quadrant | BADHDUFLAG | Total packets | Discarded packets |
| A | 0 | 79668 | 0 |
| B | 0 | 84991 | 0 |
| C | 0 | 79367 | 0 |
| D | 0 | 114450 | 0 |
| Mode M9 | |||
|---|---|---|---|
| Quadrant | BADHDUFLAG | Total packets | Discarded packets |
| A | 0 | 81 | 0 |
| B | 0 | 81 | 0 |
| C | 0 | 81 | 0 |
| D | 0 | 81 | 0 |
| Quadrant | Total seconds | Saturated seconds | Saturation percentage |
|---|---|---|---|
| A | 38337 | 665 | 1.734617% |
| B | 38337 | 722 | 1.883298% |
| C | 38337 | 550 | 1.434645% |
| D | 38337 | 1134 | 2.957978% |
Noise dominated data is calculated using 1-second bins in cleaned event files. If a bin has >2000 counts, and if more than 50% of those come from <1% of pixels, then it is considered to be noise-dominated and hence unusable.
| Quadrant | # 1 sec bins | Bins with >0 counts | Bins with >2000 counts | High rate bins dominated by noise | Noise dominated (total time) | Noise dominated (detector-on time) | Marked lightcurve |
|---|---|---|---|---|---|---|---|
| A | 46137 | 38333 | 0 | 0 | 0.00% | 0.00% |  |
| B | 46137 | 38334 | 0 | 0 | 0.00% | 0.00% | 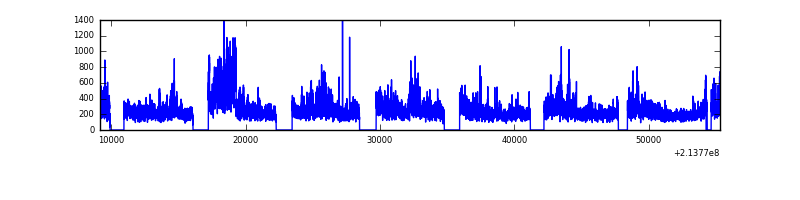 |
| C | 46137 | 38335 | 0 | 0 | 0.00% | 0.00% | 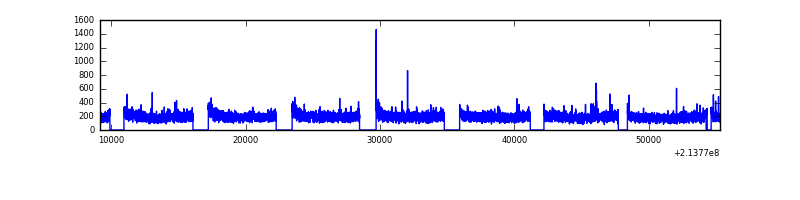 |
| D | 46137 | 38335 | 0 | 0 | 0.00% | 0.00% |  |
Top three noisy pixels from each quadrant. If the there are fewer than three noisy pixels in the level2.evt file, extra rows are filled as -1
| Pixel properties | Quadrant properties | ||||||
|---|---|---|---|---|---|---|---|
| Quadrant | DetID | PixID | Counts | Sigma | Mean | Median | Sigma |
| A | 0 | 29 | 2129 | 10.36 | 590 | 550 | 152.4 |
| A | 7 | 110 | 1960 | 9.25 | 590 | 550 | 152.4 |
| A | 9 | 19 | 1675 | 7.38 | 590 | 550 | 152.4 |
| B | 2 | 9 | 1969 | 12.06 | 573 | 545 | 118.1 |
| B | 5 | 128 | 1499 | 8.08 | 573 | 545 | 118.1 |
| B | 14 | 254 | 1471 | 7.84 | 573 | 545 | 118.1 |
| C | 12 | 241 | 1584 | 6.61 | 586 | 541 | 157.9 |
| C | 1 | 81 | 1562 | 6.47 | 586 | 541 | 157.9 |
| C | 1 | 80 | 1558 | 6.44 | 586 | 541 | 157.9 |
| D | 1 | 3 | 1421 | 6.57 | 536 | 489 | 142.0 |
| D | 11 | 82 | 1414 | 6.52 | 536 | 489 | 142.0 |
| D | 3 | 14 | 1384 | 6.31 | 536 | 489 | 142.0 |
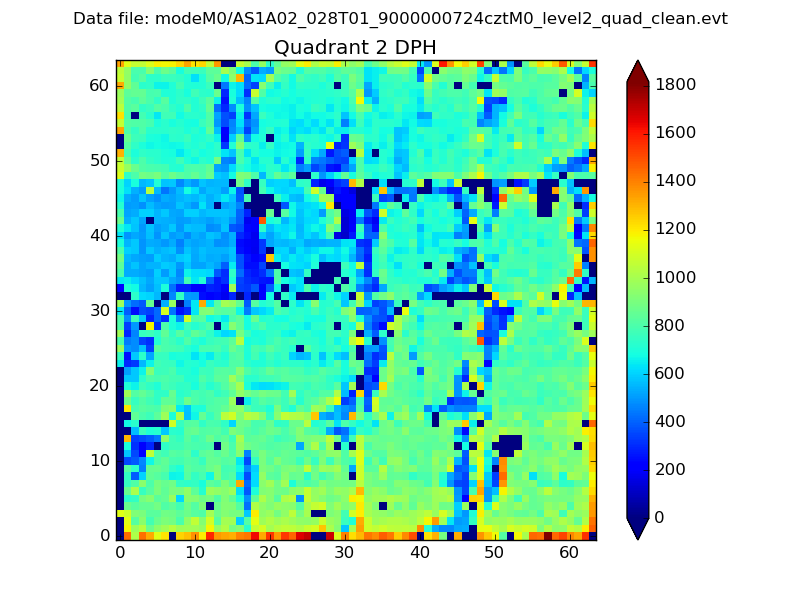
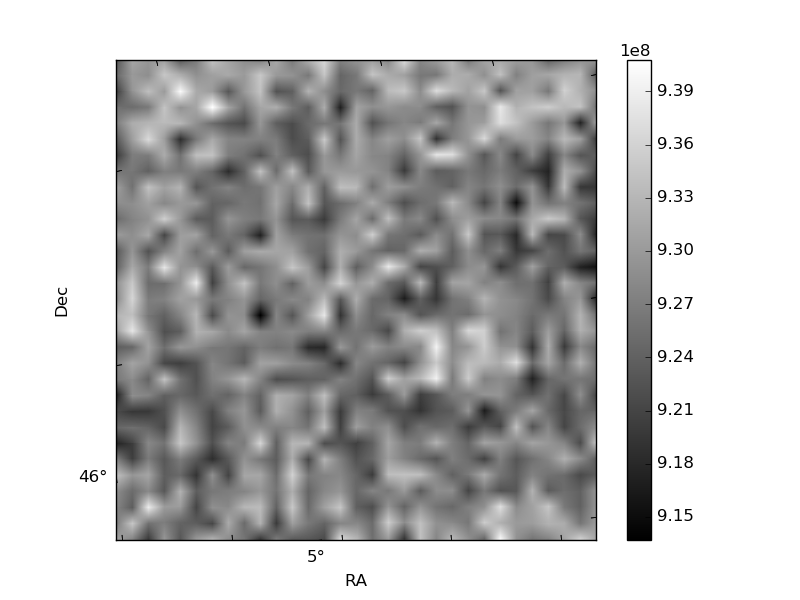
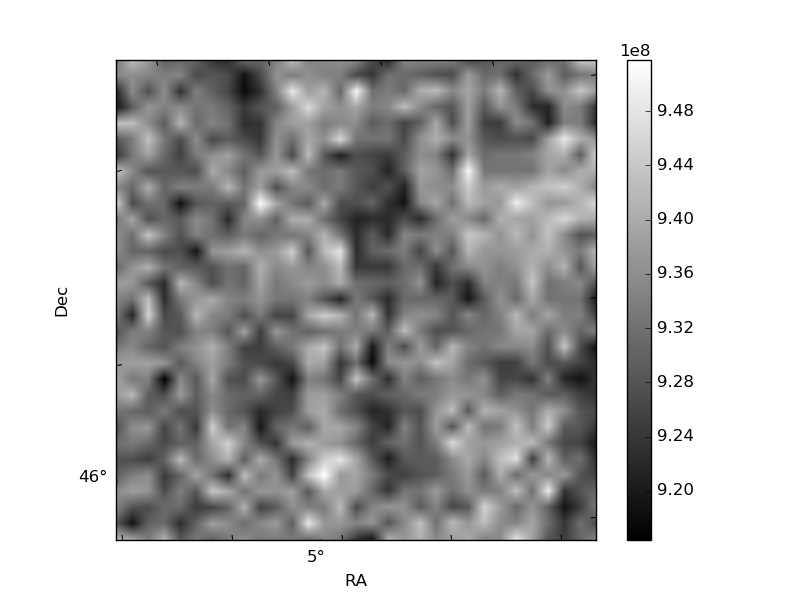
Histogram calculated using DETX and DETY for each event in the final _common_clean file
| Quadrant A |  |
 |
Quadrant B |
|---|---|---|---|
| Quadrant D |  |
 |
Quadrant C |
| Plot type | Count rate plots | Images |
|---|---|---|
| Comparison with Poisson distribution Blue bars denote a histogram of data divided into 1 sec bins. Red curve is a Poisson curve with rate = median count rate of data. |
 |
 |
| Quadrant-wise count rates Data is divided into 100 sec bins |
 |
|
| Module-wise count rates for Quadrant A Data is divided into 100 sec bins |
 |
 |
| Module-wise count rates for Quadrant B Data is divided into 100 sec bins |
 |
 |
| Module-wise count rates for Quadrant C Data is divided into 100 sec bins |
 |
 |
| Module-wise count rates for Quadrant D Data is divided into 100 sec bins |
 |
 |
| Parameter | Plot |
|---|---|
| CZT HV Monitor |  |
| D_VDD | 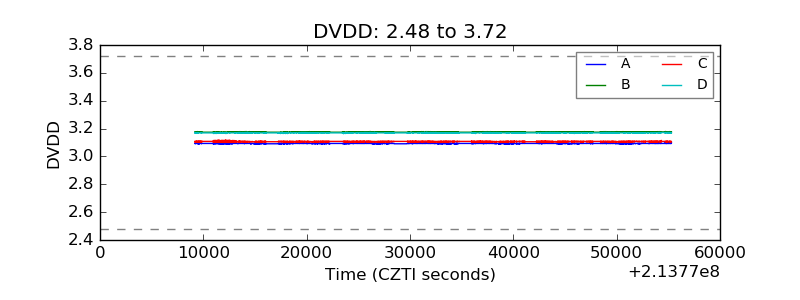 |
| Temperature 1 | 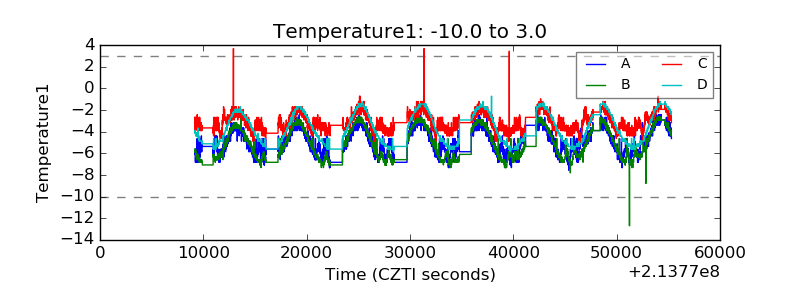 |
| Veto HV Monitor |  |
| Veto LLD |  |
| Alpha Counter | 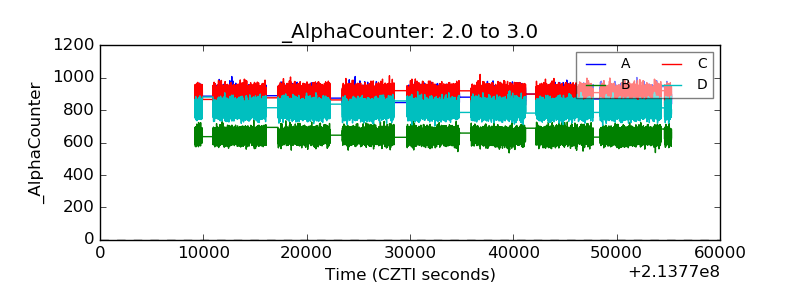 |
| _CPM_Rate |  |
| CZT Counter |  |
| +2.5 Volts monitor | 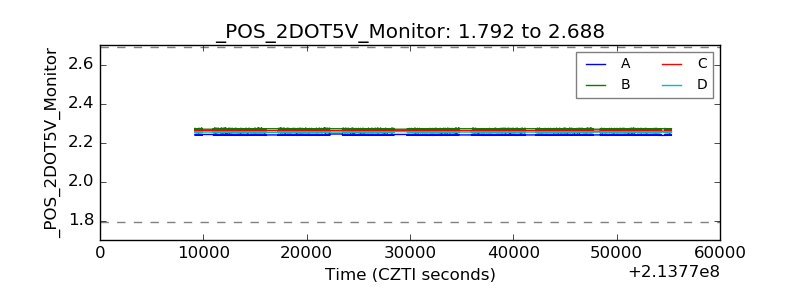 |
| +5 Volts monitor |  |
| _ROLL_ROT |  |
| _Roll_DEC |  |
| _Roll_RA |  |
| Veto Counter |  |